Abstract
An eco-compatible and sustainable development requires integrated management of all available information and the extraction of analytical evaluation on the impact of human activities. Agrometeorology can be used to contribute to further understanding of the relative importance of each environmental component, organising the field activities and optimising the use of natural resources. This is especially true today, due to the availability of new tools, as geographic information systems (GIS), which allow the management of an incredible quantity of data, as traditional digital maps, database, models etc. The advantages are manifold and highly important, especially for the fast cross-sector interactions and the production of synthetic and lucid information for decision-makers. Remote sensing provides the most important informative contribution to GIS, which furnishes basic informative layers in optimal time and space resolutions.
This paper describes various recent applications of GIS and remote sensing in Agrometeorology, both in developed and developing countries. It illustrates the possible evolution of these systems and the expected future developments, which can be decisive for a re-launch of the role of this science in the environmental and land resource management. © 2000 Elsevier Science B.V. All rights reserved.
Keywords: Agrometeorology; GIS; LIS; Remote sensing
1. Introduction
In the last 30 years, the role that agrometeorology could play both in developed and in developing coun-tries has increased, because of the traditional objec-tives of agriculture, we should add the quality of
prod-∗Corresponding author. Fax:+39-55-308910. E-mail addresses: [email protected]
(G. Maracchi), [email protected] (V. P´erarnaud), [email protected] (A.D. Kleschenko)
1Fax:+33-5-61078390. 2Fax:+7-7-095-2552225.
ucts and the environmental role of agriculture, also in the context of global change. The ‘rural development’ concept launched by the Agenda 2000 of the Euro-pean Union (E.U.) means an integrated management of land where the exploitation of natural resources, in-cluding climate, plays a central role. In this context, agrometeorology can help to reduce the inputs, while in the frame of the global change, allows the clarifica-tion of the contribuclarifica-tion of ecosystems and agriculture to the carbon budget (Maracchi, 1991). Secondly, due to the dramatic increase in world population, which has grown from 3.5 billions of people in the 1960s to 6 billion in October 1999, there is a need to increase
the total production under the constraints of a durable environment.
Nevertheless, the operational application of agrom-eteorology in the last 30 years has been slowed down due to several constraints, which can be summarised as follows.
1.1. From a general point of view
• The minor role that agrometeorology plays in the context of meteorological services with few person-nel and scarce resources.
• A declining position of both national and interna-tional agricultural institutes of research, together with a very weak presence in the agriculture and physics departments.
1.2. From a technical point of view
• The need to diffuse agrometeorological information to users very accurately in time and space, because agricultural activities are related to the very local situation.
With regard to the last point, many new tools are at the disposal of agrometeorology to attain this goal. These include local area models, climatic models, satellite and radar measurements, together with the improvements in crop models. The outputs of all these tools, together with ancillary information on the land, should allow the downscaling up to a very de-tailed grid, consistent with the needs of the users. In order to combine all this information in a systematic way, the use of the GIS offers the scope to modernize agrometeorology.
2. GISs and LISs
A geographic information system (GIS) is a computer-assisted system for acquisition, storage, analysis and display of geographic data. GIS technol-ogy integrates common database operations such as query and statistical analysis with the unique visu-alisation and geographic analysis benefits offered by maps (Burrough, 1990).
Maps have traditionally been used to explore the earth and to exploit its resources. GIS technology is
an expansion of Cartographic Science, which takes advantage of computer science technologies, enhanc-ing the efficiency and analytic power of traditional methodologies (Coulson et al., 1991; Ballestra et al., 1996).
Nowadays, GIS is becoming an essential tool in the effort to understand complex processes at dif-ferent scales: local, regional and global. In GIS, the information coming from different disciplines and sources, such as traditional or digital maps, databases and remote sensing, can be combined in models that simulate the behaviour of complex systems. Some common applications are relative to the control of industrial cycles, simulation of urban and natural sys-tems, evaluation of specific procedures and analysis of environmental impact (Mueksch, 1996; Bouman et al., 1998; Taylor and Burger, 1998).
This can be represented schematically (Fig. 1) showing the main informative sources, the components and the results of the GIS’s data processing. Data in-put can be obtained by means of direct digitalisation, scanning or acquisition from compatible sources.
The problem of the presentation of the geographic elements is solved in two ways: using x, y coordi-nates (vectors) or representing the object as variation of values in a geometric array (raster). The possibil-ity to transform the data from one format to the other, allows fast interaction between different informative layers. Typical operations include overlaying differ-ent thematic maps, contributing areas and distances, acquiring statistical information about the attributes, changing the legend, scale and projection of maps, and making three-dimensional perspective view plots using elevation data.
The capability to manage this diverse information, analysing and processing together the informative layers, open new possibilities for the simulation of complex systems. A GIS can be used to produce im-ages, not only maps, but the cartographic products, and drawings, animations or interactive instruments as well. These products allow researchers to anal-yse their data in new ways, predicting the natural behaviour, explaining events and planning strategies.
For the agronomic and natural components, in agrometeorology these tools have taken the name of land information systems (LIS).
tech-nicians), but in relationship to the information that is required, their relative importance varies.
In particular, LISs requires a series of very detailed information on the environmental elements, such as meteorological parameters, vegetation, soil and water. The final product of a LIS, is often the result of a combination of numerous complex informative layers, whose precision is fundamental for the reliability of the whole system. An example of the main information is schematically shown in Fig. 2.
The importance of each informative layer provides various examples of applications in developed coun-tries are outlined below.
2.1. The informative layers
In a GIS all the information can be linked and processed simultaneously, obtaining a syntactical ex-pression of the changes induced in the system by the variation of a parameter. In this way, we have two types of archives: static and dynamic. This technology allows the contemporary updating of geographical data and their relative attributes, producing a fast adap-tation to the real conditions and obtaining answers in near real-time. The system requires preliminary basic information that, in the agrometeorological sector, is often furnished by the historical archives of differ-ent disciplines: geography, meteorology, climatology, agronomy, etc. The importation of data requires time and attention, mainly because this information will provide the basic knowledge of the territory and on the individual parameters, and it is difficult to modify in a second time. A recent important improvement is relative to the realisation of high resolution digital elevation models (DEMs) (Moore et al., 1991), which are three-dimensional representations of the land, realised starting from quoted contour lines (Fig. 3). A realistic reproduction of the morphology, allows a series of considerations on many other parameters, like hydrology, sunshine duration, etc. (Bruneau et al., 1995; Mitasova et al., 1995). Nowadays, we can say that this layer is basic to all the others, especially for the agrometeorologist.
Other elements can be introduced, such as text, photographs, film, etc, to complete the informative layer. For example, an area characterised by a typi-cal agronomic technique can be linked to an image that explains this technique. This is important not
only for educational purpose, but also for enlarging information in particular aspects.
In agrometeorological applications, data collected directly in the field are the most important, because they present the ground truth. Meteorological sta-tions, field data collection (eco-physiological obser-vations, agronomic practices, insect attacks, diseases, soil, etc.) and direct territorial observations are fun-damental to all the possible agrometeorological GIS applications.
All these sources produce the reality of the territory and the condition of the elements that it is composed of. These data are used directly or after further treatment. After the preliminary considera-tions, only the availability of real time field data may allow simulations and evaluation of the actual and future scenario.
When there is a lack of information, the models can help the users to complete the information and understand the real situation (Rijks et al., 1998). For instance, it is possible to estimate the soil water deficit of a given area in two ways: direct measurements (very expensive process) or using the estimated values of a model.
Fig. 3. Digital evaluation model (DEM) of a part of Gran Sasso National Park. Quotes are represented in false colour.
In many cases the outputs of the models are intro-duced as inputs in the GIS, but it is also possible to introduce the models directly. In this way, all the in-formations could be used for news interactions with other informative layers.
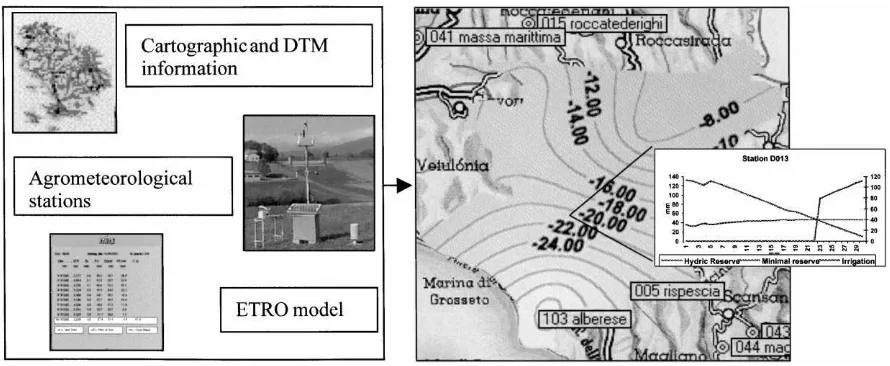
Fig. 4. Water deficit of the Grosseto lowland (26 June 1997) as estimated by ETRO. In input the different informative layers and in output the cartographic representation.
2.2. The role of remote sensing
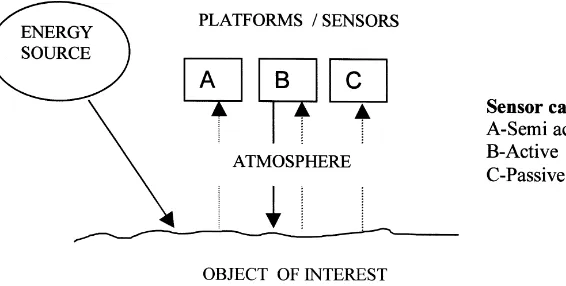
Fig. 5. Main types of remote sensing techniques.
earth’s surface and surrounding atmosphere. Without entering into a detailed description of remote sensing instruments and techniques, Fig. 5 shows the main ele-ments of these systems (Cochran, 1986).
Remote sensing provides a series of information, continually improved, which become very reliable and practically irreplaceable (Rijks, 1995).
A modern and effective agrometeorological weather service, using advanced data collection methods such as remote sensing, must be equipped with sophisti-cated devices, but above all must have efficient and trained staff.
The improvement in technical tools of meteorolog-ical observation, during the last 20 years, has created a favourable substratum for research and monitoring in many applications of sciences of great economic relevance, such as agriculture and forestry. Each waveband provides different information about the atmosphere and land surface: surface temperature, clouds, solar radiation, processes of photosynthesis and evaporation, which can affect the reflected and emitted radiation, detected by satellites. The chal-lenge research, therefore, is to develop new systems extracting this information from remotely sensed data, giving to the final users, near-real-time information.
The platform for remote sensing can be either fixed or moving, terrestrial or operating from different alti-tudes, and be either manned or unmanned. Consider-ing the operatConsider-ing time, the platform can be classified as temporary, semipermanent or virtually permanent. These aspects are important in order to understand the
quality and quantity of the information available to the agrometeorological service. The distance of the instru-ments affects directly the resolution and the precision of the information. The scale of observation can vary from a few square meters, with a scanner mounted on a vehicle, to continental scale, using a meteorological satellite.
The sensors most widely used by environmental scientists are:
• cameras with quartz lenses for use with ultraviolet
film;
• cameras for use in the visible and photo infrared
spectral region;
• multiband cameras (VIS, NIR, SWIR);
• optical mechanical scanners and radiometers for thermal infrared and passive microwave regions; • active microwave sensors such as side-looking
air-borne radar (SLAR) and synthetic aperture radar (SAR) which are not dependent on daylight and possess a near all-weather capability.
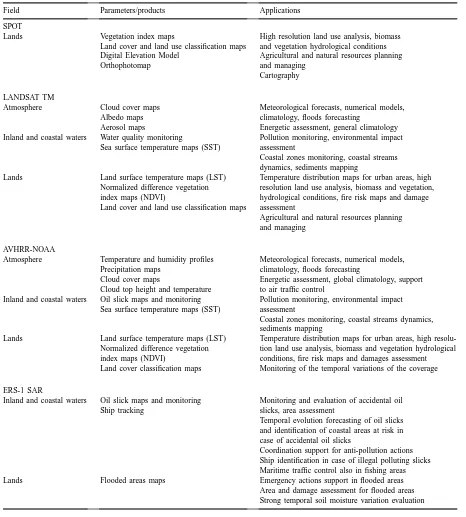
Each instrument furnishes different information and a station of detection is generally multipurpose, be-cause it is equipped with different sensors. The most common remote sensing products and applications are reported in the Table 1 (Maracchi et al., 1998).
Table 1
Main products of the operating satellites
Field Parameters/products Applications
SPOT
Lands Vegetation index maps High resolution land use analysis, biomass Land cover and land use classification maps and vegetation hydrological conditions Digital Elevation Model Agricultural and natural resources planning
Orthophotomap and managing
Cartography
LANDSAT TM
Atmosphere Cloud cover maps Meteorological forecasts, numerical models, Albedo maps climatology, floods forecasting
Aerosol maps Energetic assessment, general climatology Inland and coastal waters Water quality monitoring Pollution monitoring, environmental impact
Sea surface temperature maps (SST) assessment
Coastal zones monitoring, coastal streams dynamics, sediments mapping
Lands Land surface temperature maps (LST) Temperature distribution maps for urban areas, high Normalized difference vegetation resolution land use analysis, biomass and vegetation, index maps (NDVI) hydrological conditions, fire risk maps and damage Land cover and land use classification maps assessment
Agricultural and natural resources planning and managing
AVHRR-NOAA
Atmosphere Temperature and humidity profiles Meteorological forecasts, numerical models, Precipitation maps climatology, floods forecasting
Cloud cover maps Energetic assessment, global climatology, support Cloud top height and temperature to air traffic control
Inland and coastal waters Oil slick maps and monitoring Pollution monitoring, environmental impact Sea surface temperature maps (SST) assessment
Coastal zones monitoring, coastal streams dynamics, sediments mapping
Lands Land surface temperature maps (LST) Temperature distribution maps for urban areas, high resolu-Normalized difference vegetation tion land use analysis, biomass and vegetation hydrological index maps (NDVI) conditions, fire risk maps and damages assessment Land cover classification maps Monitoring of the temporal variations of the coverage
ERS-1 SAR
Inland and coastal waters Oil slick maps and monitoring Monitoring and evaluation of accidental oil Ship tracking slicks, area assessment
Temporal evolution forecasting of oil slicks and identification of coastal areas at risk in case of accidental oil slicks
Coordination support for anti-pollution actions Ship identification in case of illegal polluting slicks Maritime traffic control also in fishing areas Lands Flooded areas maps Emergency actions support in flooded areas
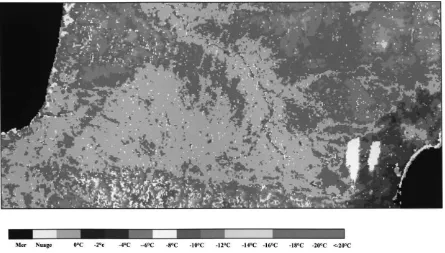
Fig. 6. Surface temperature on 25th February 1993 in the south-west of France. The algorithm used in the calculation is a linear combination of the satellite’s AVHRR channels (split-window technique) that enables most atmospheric effects to be eliminated.
• The sea surface temperature (SST) — index used
for meteorological and climatological study and observations
• The land surface temperature (LST) — good
indi-cator of climatic and microclimatic conditions pre-vailing close to the surface, as well as the frost or the moisture soil (Fig. 6).
• The normalised difference vegetation index (NDVI) — optimal index of current plant cover and its vari-ation with time.
The images can be subsequently used as informa-tive layers in the GIS, entering in a quantity of analysis or evaluation procedures. One of the simplest meth-ods is the overlapping of these images with a digital elevation model (DEM), for a realistic representation of the observed phenomenon.
It is sufficient to remember that remote sensing out-puts are the bases for principal strategic decisions sys-tems (e.g. Early Warning System — FAO, FAS — USA, EXTEC — Russia, and meteorological archive and retrieval system (MARS — EU)), to understand the relevance of these contributions.
The transfer of the new techniques of processing and interpreting remote sensing data from developed to de-veloping countries is limited by many factors, such as the cost of receiving equipment, the restrictive or very difficult access to the archives of satellite images and data, the shortage of qualified staff, etc. The situation has changed to better in recent years, thanks to the availability of long series of satellite data; for exam-ple the data archives from NOAA (USA) and Meteor (Russia), contain information for more than 15 years. In this way, the researcher and user, have the possi-bility to apply the traditional techniques, approaches and procedures and to local studies. The access to the archives and the transfer of information, software and so on is becoming simpler, especially with the use of INTERNET tools.
(WGSAT) that can be the place designed for such activity.
The main goal is the development of common working strategies and the improvement of regional and global management capability of satellite data. For this reason, particular emphasis is placed on data compatibility and integration between different sources of data. WGSAT has supported a project aimed at developing the receiving stations (both hard-ware and softhard-ware) at a reasonable cost to be available for developing countries. The WGSAT has discussed a possible process to improve the use of satellite data from the present global satellite observing system, and has proposed a set of recommended actions.
Table 2 shows the requirements for agrometeoro-logical parameters, outlined by the Working Group.
The WMO strategy to improve satellite system util-isation is made up by four components:
• the strategic vision;
• the long-term strategic goal;
• the major objectives;
• the methodology to meet the objectives.
The strategic vision, to improve satellite system utilisation, is the prospect of substantially improved transfer to communities around the world of the ben-efit of meteorological science and technology, via rapidly evolving global and regional communications networks. This will allow improved access to satel-lite data and services and the interactions between developed and developing countries.
The long-term strategic goal for the next 15 years is to improve systematically the utilisation of satellite systems by National Meteorological and Hydromete-orological Services with emphasis on improving util-isation in the developing countries.
The major strategic objectives are:
• to focus on the needs of the developing countries;
• to improve access to satellite data through increased
effectiveness in the distribution of satellite sys-tem data and products at major hubs, in particular those maintained by the satellite operators, WMO WMC’s, RSMCs and other entities as appropriate; • to improve the use of satellite data through increased capabilities in its applications by direct involvement of existing WMO Member expertise.
The methodology to improve satellite system utili-sation is based on an iterative process to assess con-tinuously the status of the use of satellite data and
ser-vices and their impact on the various applications and, therefore, to identify limitations and deficiencies. The necessary steps to improve the utilisation will be de-veloped and implemented through the use of specific projects.
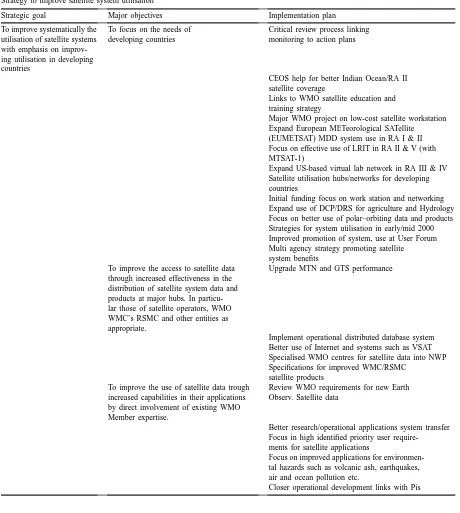
The overall strategy is summarised in Table 3.
3. GISs and remote sensing applications in Agrometeorology
Nowadays, public agencies, research laboratories, academic institutions, private and public services, have established their own information system such as GIS. Due to increasing pressure on land and wa-ter resources, land use management and forecasting (crop, weather, fire, etc.) become more essentials ev-ery day. GIS is, therefore, an irreplaceable powerful tool at the disposal of decision-makers.
As discussed earlier the term GIS is currently ap-plied to computerised storage, processing and retrieval systems that have hardware and software specially de-signed to cope with geographically referenced spatial data and corresponding informative attribute. Spatial data is commonly in the form of layers that may de-pict topography or environmental elements.
In Agrometeorology, to describe a specific situation, we use all the informations available on the territory: water availability, soil types, forest and grasslands, climatic data, geology, population, land-use, adminis-trative boundaries and infrastructure (highways, rail-roads, electricity or communications systems). Each informative layer provides to the operator the possi-bility to consider its influence to the final result. How-ever, more than the overlap of the different themes, the relationship of the numerous layers is reproduced with simple formulas or with complex models. The fi-nal information is extracted using graphical represen-tation or precise descriptive indexes.
Developed countries use agricultural and environ-mental GIS to plan the times and types of agricultural practices, territorial management activities, population security, to monitor devastating events and to evaluate damages, etc.
Table 3
Strategy to improve satellite system utilisation
Strategic goal Major objectives Implementation plan
To improve systematically the utilisation of satellite systems with emphasis on improv-ing utilisation in developimprov-ing countries
To focus on the needs of developing countries
Critical review process linking monitoring to action plans
CEOS help for better Indian Ocean/RA II satellite coverage
Links to WMO satellite education and training strategy
Major WMO project on low-cost satellite workstation Expand European METeorological SATellite (EUMETSAT) MDD system use in RA I & II Focus on effective use of LRIT in RA II & V (with MTSAT-1)
Expand US-based virtual lab network in RA III & IV Satellite utilisation hubs/networks for developing countries
Initial funding focus on work station and networking Expand use of DCP/DRS for agriculture and Hydrology Focus on better use of polar–orbiting data and products Strategies for system utilisation in early/mid 2000 Improved promotion of system, use at User Forum Multi agency strategy promoting satellite system benefits
To improve the access to satellite data through increased effectiveness in the distribution of satellite system data and products at major hubs. In particu-lar those of satellite operators, WMO WMC’s RSMC and other entities as appropriate.
Upgrade MTN and GTS performance
Implement operational distributed database system Better use of Internet and systems such as VSAT Specialised WMO centres for satellite data into NWP Specifications for improved WMC/RSMC
satellite products To improve the use of satellite data trough
increased capabilities in their applications by direct involvement of existing WMO Member expertise.
Review WMO requirements for new Earth Observ. Satellite data
Better research/operational applications system transfer Focus in high identified priority user require-ments for satellite applications
Focus on improved applications for environmen-tal hazards such as volcanic ash, earthquakes, air and ocean pollution etc.
Closer operational development links with Pis
prevention needs a series of information very detailed on an enormous scale. The analysis of data, such as the vegetation coverage with different levels of in-flammability, the presence of urban agglomeration, the
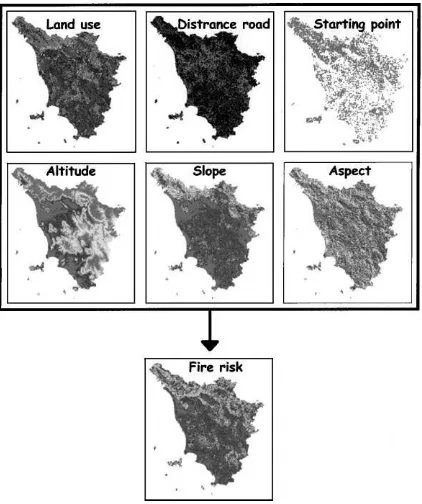
Fig. 7. Informative layers for the evaluation of fire risk index.
helicopters, aeroplanes, fire fighting equipment, etc.), can help the decision-makers in the management of the territorial systems.
Monitoring the resources and the meteorological conditions, therefore, allows, the consideration of the dynamics of the system, with more adherence to reality.
For instance, Fig. 7 shows the informative layers used for the evaluation of fire risk in Tuscany (Italy). The final map is the result of the integration of satel-lite data with territorial data, through the use of im-plemented GIS technologies (Romanelli et al., 1998).
The input data required are:
• Multitemporal satellite images (Landsat TM);
• Colour Aerial photographs;
• High resolution digital elevation model of region;
• Vectorial map of roads;
• Vectorial map of municipality boundary;
• Informative technical schedule of the Tuscany Region on fire events (period 1984–1996);
• Direct measurements.
A preliminary analysis of the data has allowed the realisation of the following informative layers: land
use; starting point of fire; distance road; elevation; slope; aspect.
The ground truth for the supervised classification of the Landsat Tm images and auxiliaries data has been done by means of direct measurements and aerial photographs.
The classification, according to a modified maxi-mum likelihood model, has produced a thematic fuzzy representation, to which has been assigned the rel-ative levels of risk. Since the risk of fire changes during the year, the monthly distributions of the fire frequencies in the period 1984–1996 were observed (Fig. 8). The figure shows two different periods of fire risk: winter-spring with its maximum in March, and summer–autumn with its maximum in August.
The methodology foresees the extraction of the fire frequencies for each class of land use. These values were normalised for the area of each class and give values of probability, according to the number of start-ing points of fire.
A comparative analysis of the winter map with the summer one, shows a sharp difference in the spa-tial distribution of the risk of fire in the two seasons (Fig. 9). In summer the risk is generally higher, with extreme values in hilly zones. Instead in winter the risk is mostly definite, located mainly to the more elevated elevations.
data used for the production of the informative lay-ers are often unreliable or even lacking. Besides, the models used in these systems are the results of studies and projects, realised at different scales.
Implementation of a GIS requires a great effort to collect and organise the available information on the territory. This important activity requires a period of validation for the operational use of the system.
In any case, many projects have started to imple-ment GIS in a number of different environimple-mental and economical systems, mainly using information derived from remote sensing to complete the direct observa-tions. The common advantage is the definition of the state of the art and a first study of the particular prob-lems, with the suggestion of innovative specific so-lutions. At this level, the products often are already used for practical applications and the operators find it sufficiently powerful and reliable.
The general philosophy of the projects, finalised to produce GIS, is to realise more and more complex and integrated systems, to satisfy the needs of users. In developing countries, the approach has to be quite different, realising in a first phase sufficiently simple systems, which answer specific problems, arriving gradually complete the different informative layers and to create a fully operative GIS.
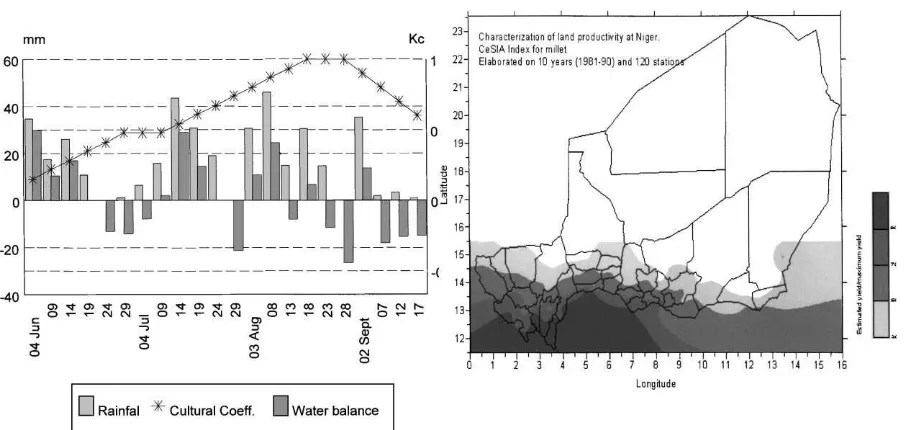
An example of preliminary information system to country scale is given by the SISP (Integrated infor-mation system for monitoring cropping season by me-teorological and satellite data), developed to allow the monitoring of the cropping season and to provide an early warning system with useful information about evolution of crop conditions (Di Chiara and Maracchi, 1994).
The SISP uses:
• Statistical analysis procedures on historical series of rainfall data to produce agroclimatic classification;
in Niger, with the possibility to estimate the moment of the harvest and final production.
SISP is based on the simulation of the millet growth and it gives an index of annual productivity (range 0–1) by administrative units. These values, compared to the historical crop yields of the single administrative unit, allow the estimation of the expected productivity. By means of systems like this, based on modelling and remote sensing, it is possible to extract indices relative to the main characteristics of the agricultural season and conditions of natural systems. This sys-tem is less expensive, easily transferable and requires minor informative layers, adapting it to the specific requirements of the users.
When the information available on the territory is sufficient, the passage of all this information to GIS is immediate. An example in this regard is the envi-ronmental information system (EIS) realised by the PEICRE project for the department of Keita (Niger), starting from a large data set collected on this area (2.500 km2).
The data collected and the different information lay-ers are organised in a database and all the information about the territory is integrated in a GIS. Each layer is composed of different archives (numeric data, text and images), which were preliminary controlled and evaluated. The archives are completed with graphical representations of the main data trends and synthetic information, obtained by means of spreadsheet and statistical software (Genesio and Di Vecchia, 1998).
Fig. 10. Examples of outputs of SISP.
informations can give a synthetic representation of the reality.
An analysis of Landsat TM, MSS and SPOT mul-tispectral images has been used to update the avail-able maps and to obtain territorial classifications. The classification procedure is based on the integration of the different information layers (digital cartogra-phy, on-field observation, multispectral satellite im-ages, aerial photographs etc.).
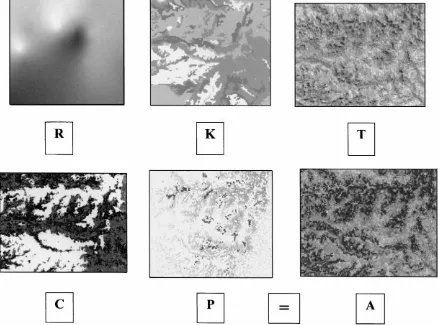
In the EIS–PEICRE some models are also intro-duced, which are able to simulate the behaviour of different parameters or show possible scenarios. In particular, great importance is given to water and to the soil degradation. For instance, the evaluation of the erosion hazard requires many different layers for the application of the RUSLE model (Renard et al., 1994), derived from the USLE equation:
A=R K L S C P
where A is the soil loss (t/ha/year); R represent rain-fall and runoff erosivity; K is the soil erodibility; L represent slope length; S is the slope steepness; C rep-resent cover management and P denotes supporting practices.
Fig. 11 shows the images of different layers of the RUSLE model. The erosivity (R factor) is calculated using rain data; the K values, given to each class of soil, are evaluated using all the available informations and indications derived from ground observations. Cover management and supporting practices have been intro-duced by means of combinations of different informa-tion: digital cartography, on-field observation, aerial and satellite photographs. The heart of the model is a DEM of the land, which allows the evaluation of the morphological factors (L and S of the USLE) for each point of the territory and the estimation of the water flow direction.
These new powerful tools give the possibility to in-troduce a new coefficient for the USLE, that was called transport capacity factor (T) and represents the soil transport capacity of the water flow in each element (pixel).
The simple multiplication of the resulting layers, each with its own series of values for each territorial unity, allows the evaluation of the erosion hazard in the considered time period.
environmen-Fig. 11. Information layers for RUSLE model (T=L×S).
tal recovery and preservation project PIK (Integrated Project Keita), the positive effect of the agronomic works in the reduction of erosion has been evaluated. This effect is due to the increase of the vegetation cov-erage and to a better water management (Rapi et al., 1996).
4. Conclusions
The existence of new tools is based to reinforce the use of agrometeorology and to increase its applications both in developed and developing countries, is based on the strengthening of this use of GIS and remote sensing in the national services, research and training. To reach this objective there are several initiatives that should be undertaken:
• a greater visibility of the agrometeorology at both
national and international level;
• a larger participation to the international
pro-grammes;
• better integration with meteorology and
climatol-ogy.
All these activities are based on the development of new competencies as in the case of GIS utilisation. To prepare this new type of agrometeorologist we can identify three possible ways:
• the reinforcement of training in these new fields;
• the promotion of specialised software;
• the preparation of multimedia training tools to make learning and the updating of the competencies easier.
bearing in mind the possible combination of several types of inputs such as data coming from standard net-works, radar and satellites, meteorological and clima-tological models, digital cartography and crop models based on the scientific acquisition of the last 20 years. In this perspective, the activity of International Agencies such as the WMO and the FAO, in coop-eration with the national services and the scientific institutions, is the only way to guarantee the strength-ening of the role of agrometeorology for the service of agriculture and of environment in the world.
Acknowledgements
A special thanks to Dr. Piero Battista and to Mr. Bernardo Rapi, researchers of CeSIA-Accademia dei Georgofili of Firenze, for their collaboration.
References
Ballestra, G., Bertozzi, R., Buscaroli, A., Gherardi, M., Vianello, G., 1996. Applicazioni dei sistemi informativi geografici nella valutazione delle modificazioni ambientali e territoriali. Franco Angeli, Milano, Italy.
Battista, P., Benincasa, F., Duce, P., Pellizzaro, G., 1996. Calcolo dei fabbisogni irrigui delle colture tramite metodi micrometeorologici: un semplice software applicativo — In: Proc. Annual Congress AICA’95, Cagliari, pp. 796–803. Bouman, B.A.M., Nieuwenhuyse, A., Hengsdijk, H., Jansen,
H.G.P., Schipper, R.A., 1998. An integrated methodology for sustainable land use exploration using GIS. In: Proc. 1st Int. Conf. Geospatial Information in Agriculture and Forestry. Lake Buena Vista, FL, USA, pp. 230–237.
Bruneau, P., Gascuel-Odoux, G., Robin, P., Merot, Ph., Beven, K., 1995. Sensitivity to space and time resolution of a hydrological model using digital elevation data. Hydrol. Processes 9, 68–81. Burrough, P.A., 1990. Principles of Geographical Information System for Land Resources Assessment. Oxford University Press, Oxford.
Cochran, G.R., 1986. The technology of remote sensing: system components, data processing and prospect. In: Eden, M.J., Parry, J.T. (Eds.), Remote Sensing and Tropical Land Management. Wiley, UK, pp. 17–34.
Coulson, R.N., Lovelady, C.N., Flamm, R.O., Spradling, S.L., Saunders, M.C., 1991. Intelligent geographic information systems for natural resource management. In: Turner, M.G.,
Gardner, R.H. (Eds.), Quantitative Methods in Landscape Ecology. Springer, New York, pp. 153–172.
Di Chiara, C., Maracchi, G., 1994. Guide au S.I.S.P. ver. 1.0. Technical manual no. 14, CeSIA, Firenze, Italy.
Genesio, L., Di Vecchia, A., 1998. Le Systeme d’Information Environmental SIE — P.E.I.C.R..E., Technical Report, PEICRE PROJECT, CeSIA, Firenze, Italy.
Maracchi, G., 1991. Agrometeorologia: stato attuale e prospettive future. Proc. Congress Agrometeorologia e Telerilevamento. Agronica, Palermo, Italy, pp. 1–5.
Maracchi, G., Battista, P., Rapi, B., 1998. A Guide to Computer Science Application in Agrometeorology. Regional Training Seminar for National Instructors of RA.I and RA.VI, Nairobi, Kenya.
Mitasova, H., Mitas, L., Brown, W.M., Gerdes, D.P., Kosinvsky, I., Baker, T., 1995. Modelling spatially and temporally distributed phenomena: new methods and tools for GRASS GIS. Int. J. Geogr. Information Systems 9 (4), 433–466.
Moore, I.D., Grayson, R.B., Ladson, A.R., 1991. Digital terrain modelling: a review of hydrological, geomorphological and biological applications. Hydrol. Processes 5, 3–30.
Mueksch, M.C., 1996. Monitoring and Assessing Natural Lake and Environments for Lake-GIS. In: Proc. GIS/LIS’96, Annual Conf. and Exposition, Denver, Colorado, pp. 30–36. Rapi, B., Conese, C., Maracchi, G., 1996. Risque d’érosion et
évaluation des oeuvres hydraulico- agraires du PIK. PEICRE, RT2, CeSIA, Firenze, Italy.
Renard, K.G., Laflen, J.M., Foster, G.R., Mc Cool, D.K., 1994. The revised universal soil loss equation. In: Lal, R. (Ed.), Soil Erosion Research Methods. The Soil and Water Conservation Society and St. Lucie Press, USA.
Rijks, D., 1995. The use of remote sensing techniques in agrometeorological practices: some activities by members of the EU Support Group Agrometeorology (SUGRAM) in respect of low resolution satellite data and quantitative yield assessment. Workshop COST 77, in: Dunkel, Z. (Ed.), Workshop Cost 77, pp. 141–173.
Rijks, D., Terres, J.M., Vossen, P., 1998. Agrometeorological applications for regional crop monitoring and production assessment. Account of the EU Support Group on Agrometeorology (SUGRAM) 1991–1996. Joint Research Centre EU, EUR 17735 EN.
Romanelli, S., Bottai, L., Maselli, F., 1998. Studio preliminare per la stima del rischio d’incendio boschivo a scala regionale per mezzo dei dati satellitari e ausiliari. Tuscany Region — Laboratory for Meteorology and Environmental Modelling (LaMMA), Firenze, Italy.