AUTOMATED DETECTION AND CLOSING OF HOLES IN AERIAL POINT CLOUDS
USING AN UAS
Torsten Fiolka, Fahmi Rouatbi and Daniel Bender
Fraunhofer Institute for Communication, Information Processing and Ergonomics FKIE, Wachtberg, Germany {torsten.fiolka, fahmi.rouatbi, daniel.bender}@fkie.fraunhofer.de
KEY WORDS:UAV, 3D terrain model, point cloud, hole detection, surface reconstruction
ABSTRACT:
3D terrain models are an important instrument in areas like geology, agriculture and reconnaissance. Using an automated UAS with a line-based LiDAR can create terrain models fast and easily even from large areas. But the resulting point cloud may contain holes and therefore be incomplete. This might happen due to occlusions, a missed flight route due to wind or simply as a result of changes in the ground height which would alter the swath of the LiDAR system. This paper proposes a method to detect holes in 3D point clouds generated during the flight and adjust the course in order to close them. First, a grid-based search for holes in the horizontal ground plane is performed. Then a check for vertical holes mainly created by buildings walls is done. Due to occlusions and steep LiDAR angles, closing the vertical gaps may be difficult or even impossible. Therefore, the current approach deals with holes in the ground plane and only marks the vertical holes in such a way that the operator can decide on further actions regarding them. The aim is to efficiently create point clouds which can be used for the generation of complete 3D terrain models.
INTRODUCTION
Many applications have needs for a detailed representation of the earth’s surface, depending on the application in different reso-lutions and with or without buildings and vegetation. The terms Digital Elevation Model (DEM) and Digital Terrain Model (DTM) are mostly used for models without any objects on the surface, the term Digital Surface Model (DSM) is commonly being used for a model containing all objects. We use in this work the term Digital Surface Model as defined in (Priestnall et al., 2000) as a terrain model including all features on the ground. High reso-lution DSMs are used in different fields such as in archaeology searching for buried sites, in disaster management for prevent-ing or evaluatprevent-ing damages or in reconnaissance for reconnoitrprevent-ing unknown areas. However, before the common availability of Un-manned Aircraft Systems (UAS), creating a DSM was an elabo-rate and expensive task which usually involves aircrafts or heli-copters. Nowadays, DSMs can be created in a fast and efficient way by the mean of a Light Detection And Ranging (LiDAR) system carried by an UAS.
Using such an automated system, one can easily create detailed DSMs over several square kilometers in a short amount of time. One of the problems which can occur are holes in the model. These can be caused by several reasons. For example, some areas are missed by the flight plan, the UAS path is influenced by wind or the holes are caused by occlusion from neighbouring structures on the surface. The latter is maybe the most problematic, because they represent areas which can not be covered by an UAS. These holes can cause problems depending on the application of the pointcloud. For example, normals at the edge of a hole tend to tilt into the direction. Also a subsequently created surface model will also not be complete or estimate the area of the hole by its boundaries, which might lead to a wrong representation. This work proposes a method for the detection of holes in point clouds, identifying the ones which can be covered and altering the flight
plan to close them automatically. Furthermore, our algorithm can be extended to handle regions with spare measurements as holes, so that the resulting point cloud has an overall sufficient point density.
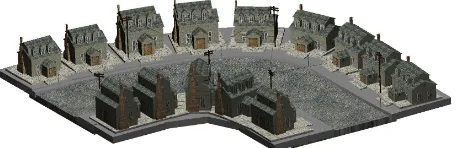
(a) Rendered image of the 3D-model used as environment in the simulation
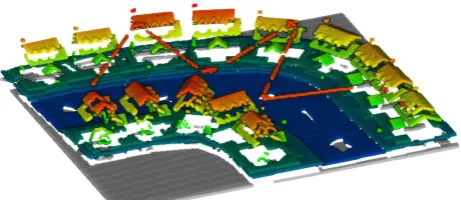
(b) The corresponding 3D point cloud colored according to the height of the points
Figure 1. Example of a point cloud generated from a simulated model containing more than two million points
(a) The voxel grid generated from the simulated point cloud of Fig 1(b) and colored according to the points height
(b) The height map created with the voxelgrid colored according to the maximum height of the corresponding voxels
Figure 2. The data structures used for the point cloud processing and the holes detection.
However, computations on the ground requires a high bandwidth connection to the UAS, which is also challenging or expensive. We propose therefore no online algorithm but an offline solution which can be computed either in the air or on the ground. If the solution is being used on the ground it does not need a contin-uous connection, an intermittent connection suffices. For exam-ple, if the UAS is in range for a high bandwidth connection to the ground station all data will be transmitted, evaluated and retrans-mitted to the UAS. With the size of point clouds easily reaching millions of points, the data processing has to be carefully pre-pared (Fig. 1). Therefore, we choose a voxelgrid as a base rep-resentation to handle huge point clouds taking into account the memory and computation time limitations.
The voxelgrid allows the discretization of a point cloud. It divides the 3D space into cells of identical size, called voxels. Each voxel represents all points that lie within its volume so that the size of the point cloud is not based on the number of points rather than their dilatation in space. This is especially helpful in the case of an irregularly sampled point cloud. But this also means that there will be some discretization errors. By carefully choosing the voxel size depending on the target application, these errors can be minimized. The voxelgrid is used to accumulate data dur-ing the flight. A height map is created out of it and used for
the hole detection (Fig. 2). During the creation of the height map, height jumps and potential vertical holes are identified. The height map is then used for to detect holes in the ground plane and decide, whether they can be covered by the UAS or not.
The remainder of this paper is structured as follows. In section 2 we compare our approach with prior proposals. Section 3 covers the data processing, the hole detection process and the way to take a decision about covering the surface of a hole. After that, section 4 outlines the path planning process needed to adjust the flight course of the UAS. Section 5 describes the experiments of the proposed methods and section 5 presents a conclusion and some future work.
RELATED WORK
There are different means of creating a DSM from an aerial ve-hicle, such as electro-optical cameras and LiDAR systems. Both techniques have their advantages and disadvantages and should be seen rather as complementary than competitive, as stated in (Baltsavias, 1999). A DSM therefore is a representation of the ground surface including all objects on it. When constructing DSM with an airborne LiDAR system, one usually uses an com-bination of Global Navigation Satellite System (GNSS) and Iner-tial Navigation System (INS) to produce georeferenced data from the scan lines. The result is a georeferenced point cloud, which is a point-wise representation of the underlying surface. These point clouds are usually not perfect, they may include sensor noise as outliers, are irregularly sampled due to different angles between surface and LiDAR or include holes. If vegetation is present, the laser may be reflected from the leaves or from the ground beneath. Depending on the application, the point cloud may be processed to remove outliers, apply regular sampling or create a DEM from it by removing artificial objects. Using a surface reconstruction algorithm a point cloud may be converted into a polygon mesh representation. Especially for the surface reconstruction the han-dling of missing data is important, as holes in the point cloud may lead to poor or wrong reconstructions. A overview into the field of surface reconstruction is given by (Berger et al., 2017). As holes are a common problem, multiple techniques have been de-veloped to lessen the influence of missing data. Many of these come from the areas of Computer-Aided Design or Computer Graphics with the aim of building a watertight surface from an incomplete model of an object. The algorithms try to reconstruct surfaces in smooth areas (Wang and Oliveira, 2007) or try to han-dle complex structure through assumptions about the original sur-face (Jun, 2005)(Davis et al., 2002).
two-dimensional procedure is sufficient. Another approach from Colleu et al. uses ray-based methods for detecting opening like windows in urban areas (Colleu and Benitez, 2016). They mark all areas there the laser ray intersects with the plane of a house wall as open windows. Wang et al. also detect windows from laser range images in (Wang et al., 2011). Both approaches need to extract the facade plane for detecting the holes first. As we are using an airborne LiDAR system, we usually do not see much of a facade and cannot use this approach.
Nguyen et al. use a grid representation of point clouds for detect-ing hole boundaries and simplifydetect-ing them (Nguyen et al., 2012) (Nguyen et al., 2013) (Nguyen et al., 2015). We found the ap-proach for detecting holes in the ground plane suitable, but needed to make changes for detecting vertical holes and height jumps. Another approach for filling holes uses tangent planes from the boundary (Nguyen et al., 2016). Several methods explore pos-sibilities to fill holes once they are detected. Chalmoviansky et. al 2003 fit algebraic surface into the holes (Chalmoviansk´y and J¨uttler, 2003). Another approach interpolating geometry and shading with a moving least square formulation is from Wang et al. (Wang and Oliveira, 2007). These approaches have in com-mon that they are filling holes with artificial data generated by mathematical models. In contrast, our approach attempts to fill these holes by rescanning the area containing them.
For closing the holes, we use a greedy algorithm for choosing the order of the holes we have to visit. There are more efficient ways to solve the problem (Li et al., 2007), but this work focuses on other aspects and the simple greedy solution is sufficient for demonstration. For covering a hole we use a Boustrophedon path (Galceran and Carreras, 2013) to close the hole with respect to the swath width of the LiDAR. The choice was made with respect to the Rotary Wing UAV we intend to use and may not be the best for other types. For example, a Fixed Wing UAV cannot turn in place, so the path planning has to be adjusted to reflect its capabilities.
HOLE DETECTION
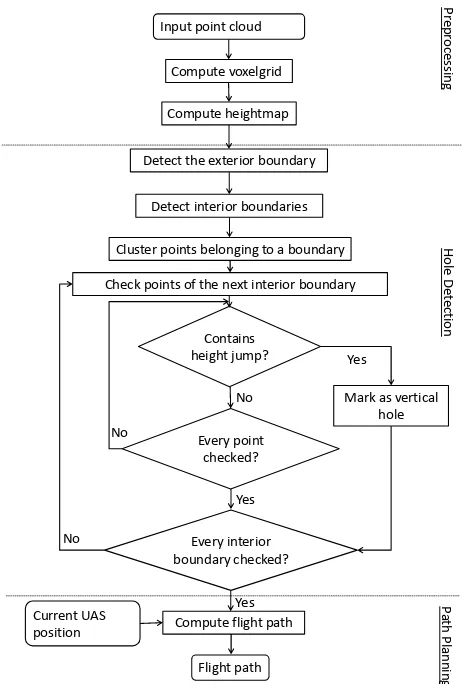
In this section, we describe the methods used to detect the hor-izontal and vertical holes in 3D point clouds. The flowchart of Fig. 3 summarizes the different steps of our approach. First, we present the data structure used to organize the input point cloud and perform the detection of holes. Then, we describe the algo-rithms used to detect the different kind of holes in the point cloud. Finally, we present the procedure used to calculate the path that the UAS has to perform in order to fly to the holes which can be covered.
Preprocessing
The point clouds in this paper are created by an aerial LiDAR which produces lines of range measurements. These are fused with an GPS/INS unit to transform the measurements into points with global coordinates. The density of the points depends on factors like the travelling speed of the UAS, the resolution and the scan rate of the LiDAR as well as the angle and the distance between the laser beams and the ground. As a result, the gen-erated point clouds consist of surfaces of irregularly distributed points in the 3D space Additionally, some areas may not be cov-ered by points as they are located in the shadows of buildings or other topographic structures as trees. Furthermore, uncovered ar-eas are a result from discontinuities in the scanned structures. For
Detect the exterior boundary Input point cloud
Cluster points belonging to a boundary
Every point
position Compute flight path
Flight path
Check points of the next interior boundary
Yes
Figure 3. Flowchart for the hole detection and path planning approaches
this reason, the point cloud may include some holes which are re-gions with no points. In this paper, we classify the holes into two categories:
• Horizontal holes: Missing points in planar horizontal sur-faces such as the ground
• Vertical holes: Gaps in vertical surfaces that have not been illuminated by the LiDAR and commonly generated by ver-tical structures such as buildings
voxel size for the grid. If the size is too big, details of the under-lying surface will be lost in the discretization, If the voxels are too small, the grid loses its advantages over the point cloud. In general, the size will be determined by the resolution of the Li-DAR and the application’s requirements. As the voxelgrid is a three-dimensional data structure and the following calculations perform better in a two-dimensional structure, we create a height map from the voxelgrid. It consists of a regular sampling of the xy-plane and integrates all point and height information in each cell. In our case the minimum and maximum z-coordinates and the number of voxels present are stored for later use. To make the creation computationally cheap, we use the resolution of the voxelgrid for the height map and integrate all cells with the same xy-coordinate from the voxelgrid into one corresponding cell in the height map.
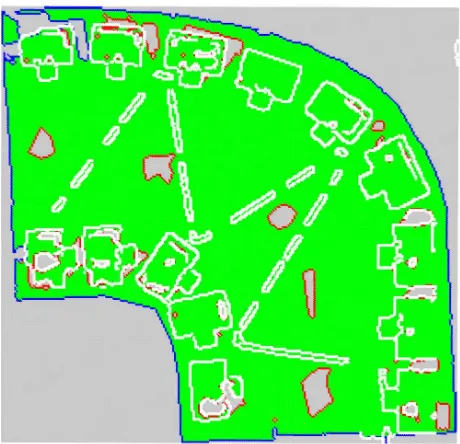
Figure 4. Classification of the grid cells. The exterior boundary of the surface (blue points), the boundaries of the horizontal
holes (red points) and the vertical holes (white points)
Detection of height jumps and vertical holes
During the creation of the height map, the jumps in the height and the potential vertical holes are detected. Large height differences in the surface may lead to occlusions causing holes in the point cloud. Therefore, we need the detected height jumps for deciding whether it is reasonable to return to the hole trying to close it. It might be possible to clear up some occluded area from the UAS, but that depends on knowledge about the occluded area or making assumptions on the nature of the surface in the area. The first step is to detect height jumps. As the height map contains the minimum and maximum z-coordinates from the points in each cell, height jumps can be detected by comparing the difference of these against a giventhresholdheight.
maxz−minz> thresholdheight. (1)
If the difference exceeds the threshold, the cell is marked accord-ingly. Thethresholdheighthas to be chosen carefully and de-pends on several factors including the resolution of the voxelgrid. If it is too small, even small slopes and bushes might be consid-ered as height jump, if it is too large, some holes will be missed.
In the next step we detect vertical holes by comparing the number of voxels on every cell with a height jump. If the number of voxels is less than the number on would expect given the height difference, we can conclude on missing voxels along the height jump:
maxz−minz
resolution >#voxels . (2)
Of course we cannot decide if this is the result from a single hole or due to under sampling of the surface given a steep angle be-tween LiDAR and surface. But as clearing up vertical areas is even more problematic than probably occluded ground areas, we do not investigate this question further in the scope of this work.
Detection of the exterior boundary
After creating the height map we perform the detection of the holes. Our method is based on the work of Nguyen (Nguyen et al., 2012). The points belonging to the exterior boundary are first extracted. We use the growth-clock-wise algorithm. This algo-rithm starts from the initial point which corresponds to the occu-pied cell in the 2D grid with the minimum x and y coordinates. Then, the exterior boundary is iteratively built by searching for the first occupied cell in the neighbourhood of the initial point in a clockwise circular way. In each iteration, the so called ring-neighbourhood is computed for the current cell, and the next point is searched by circularly analysing the neighbours in a clockwise order starting from the previous point’s direction. This algorithm can extract all exterior boundaries even if the area contains more than one patch.
Detection of inner boundaries
After extracting the exterior boundary, the remaining points are searched for inner boundaries. A point is considered as a bound-ary of a hole if one of its neighbours in 4-connectivity is empty. The next step is the clustering of the inner boundaries to the corre-sponding holes. For that purpose the neighbourhoods of all cells marked as inner boundary are search for adjacent inner bound-ary cells and stored as a connected component. Also the number cells with height jumps in the neighbourhood is accumulated dur-ing the clusterdur-ing. That allows the classification into holes that originate from occlusion and those from missing data.
PATH PLANNING
Figure 5. Scheme of a Boustrophedon path computed locally over a horizontal hole taking in consideration the swath width
and the desired overlap between the flight lanes
Map # Cells Time
Test site A 34380 16ms Simulation 164594 110ms Test site B 521368 510ms
Table 1. The computation time results of the algorithm. The left column shows the point cloud used, the middle column the number of cells in the height map and the right column the computation time for building the height map and classifying the
cells.
in the flight path. This distance also determines the overlap be-tween the present point cloud and the new laser scans. Having an overlap has the advantage of being more robust against deviations from the planned flight path as well as increasing the point clouds density. The disadvantage is the increased flight time needed for completing the course, so the values have to be adjusted to the target application. If the LiDAR is mounted at an angle from the vertical and if the UAV tends to fluctuate in flight through turbu-lences, the start and end points should be planned with a margin to cover the hole completely. The flight path starts from the ac-tual position of the UAS and sequentially goes to the nearest hole until all holes have been covered.
EXPERIMENTS
The implemented algorithms have been applied to simulated and real data. The results from simulations and flight tests as well as the evaluation of the algorithms are presented.
Simulated data
The simulation experiments were performed in the Gazebo frame-work (Koenig and Howard, 2004). We used a freely available 3D
Figure 6. Example of a global path starting from the actual position of the UAS and connection all local paths over each
hole
model from (Nieves, 2013) as environment (Fig. 1(a)). The hec-tor quadrohec-tor package developed by (Meyer et al., 2012) has been used to model the UAS. In our setup the model carries a simulated LiDAR system with the same technical characteristics and orien-tation as the real system. The point clouds have been generated by flying the quadrotor model according to a list of way points. The results of the holes detection are shown is Fig. 4. The path planned subsequently is depicted in Fig. 6. Most of the holes are caused by occlusion from the houses and are correctly classi-fied as occluded and will be skipped for the recovery flight. The other holes were placed deliberately in the middle of the street to test the algorithm. The holes were classified correctly and a path was planned to close them accordingly. Interestingly, the telephone lines between the houses also cause vertical holes in the height map. While the lines would probably not cause seri-ous occlusions, adjacent holes in the ground might be classified as occluded hole and would not be recovered.
Real data
(a) The components of the LiDAR system mounted on the multicopter
(b) The AR200 while performing a mapping flight
Figure 7. The airborne LiDAR system.
covering an area of 600x400x50 meters but offers little features other than some trees. It is mainly used for evaluating the perfor-mance of the algorithm on a very large point cloud.
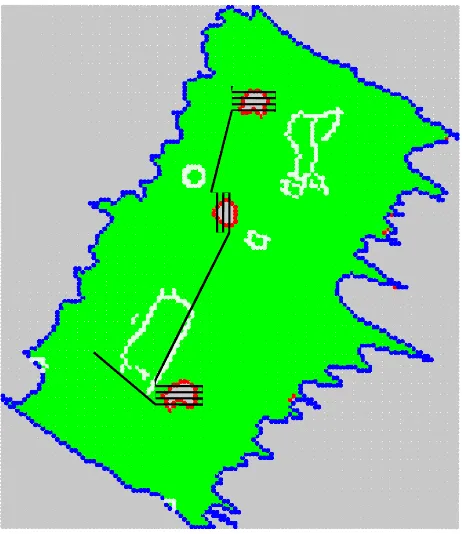
Fig. 8(a) shows an example of a registered point cloud with our LiDAR which has been collected over a test area. The point cloud has over 2 million points and comprises structures of small con-tainers, vegetation and a hill. A set of horizontal holes with dif-ferent shapes have been added in order to test our approach. The results are visualized in Fig. 8(b).
Evaluation
In the data sets from the simulation and Test site A, the exte-rior boundary and the horizontal holes have been reliably de-tected.The corresponding flight plans are shown in Fig. 6 and Fig. 8(b). The height map can also detect the vertical holes in most cases. Some special cases where the interior holes are con-nected to the exterior boundary still have to be considered. The computational complexity is outlined as follows: The creation of the voxelgrid is linear in the size of the point cloud, since every point has to be considered once. All following steps rely only on the voxelgrid, e.g. the creation of the height map is linear in the size of the voxelgrid. According to Nguyen et al. (Nguyen et al., 2012), the computing time for extracting the exterior bound-ary depends on the size of the boundbound-aryN and the size of the neighbourhoodk. The worst case isO(N∗k2), but the aver-age complexity is lower due to the fact that the algorithm will not search the complete neighbourhood in most cases. The cost for
(a) Point cloud of a test area at the institute colored according to the height of each point
(b) Results of the hole detection and flight plan
Figure 8. Experiments on Test site A
the path planning is negligible in our case. We did test the al-gorithm on a desktop computer with three different point clouds depicting the results in Table 1. The voxel and cell sizes were set to 0.5m for all point clouds for better comparison of the results.
CONCLUSION
REFERENCES
Baltsavias, E. P., 1999. A comparison between photogrammetry and laser scanning. {ISPRS}Journal of Photogrammetry and Remote Sensing54(23), pp. 83 – 94.
Bendels, G. H., Schnabel, R. and Klein, R., 2006. Detecting holes in point set surfaces.Journal of WSCG.
Berger, M., Tagliasacchi, A., Seversky, L. M., Alliez, P., Guen-nebaud, G., Levine, J. A., Sharf, A. and Silva, C. T., 2017. A survey of surface reconstruction from point clouds. Computer Graphics Forum36(1), pp. 301–329.
Chalmoviansk´y, P. and J¨uttler, B., 2003. Filling Holes in Point Clouds. Springer Berlin Heidelberg, Berlin, Heidelberg, pp. 196– 212.
Colleu, T. and Benitez, S., 2016. Ray-based detection of open-ings in urban areas using mobile lidar data.ISPRS - International Archives of the Photogrammetry, Remote Sensing and Spatial In-formation SciencesXLI-B3, pp. 591–598.
Davis, J., Marschner, S. R., Garr, M. and Levoy, M., 2002. Filling holes in complex surfaces using volumetric diffusion. In: Pro-ceedings. First International Symposium on 3D Data Processing Visualization and Transmission, pp. 428–441.
Galceran, E. and Carreras, M., 2013. A survey on coverage path planning for robotics.Robotics and Autonomous Systems61(12), pp. 1258 – 1276.
Jun, Y., 2005. A piecewise hole filling algorithm in reverse engi-neering.Computer-Aided Design37(2), pp. 263 – 270.
Koenig, N. and Howard, A., 2004. Design and use paradigms for gazebo, an open-source multi-robot simulator. In:IEEE/RSJ International Conference on Intelligent Robots and Systems, Sendai, Japan, pp. 2149–2154.
Li, F., Golden, B. and Wasil, E., 2007. The open vehicle rout-ing problem: Algorithms, large-scale test problems, and com-putational results. Computers & Operations Research34(10), pp. 2918 – 2930.
Meyer, J., Sendobry, A., Kohlbrecher, S., Klingauf, U. and von Stryk, O., 2012. Comprehensive simulation of quadrotor uavs using ros and gazebo. In: 3rd Int. Conf. on Simulation, Model-ing and ProgrammModel-ing for Autonomous Robots (SIMPAR), p. to appear.
Musialski, P., Wonka, P., Aliaga, D. G., Wimmer, M., Gool, L. and Purgathofer, W., 2013. A survey of urban reconstruction.
Computer Graphics Forum.
Nguyen, V.-S., Bac, A. and Daniel, M., 2012. Boundary extrac-tion and simplificaextrac-tion of a surface defined by a sparse 3d vol-ume. In: Proceedings of the Third Symposium on Information and Communication Technology, SoICT ’12, ACM, New York, NY, USA, pp. 115–124.
Nguyen, V.-S., Bac, A. and Daniel, M., 2013. Simplification of 3D point clouds sampled from elevation surfaces. In: 21th International Conference on Computer Graphics, Visualization and Computer Vision, WSCG2013, ISBN 978-80-86943-75-6, Vol. 21number 2, Plenz, Czech Republic, pp. 60–69.
Nguyen, V. S., Ha, T. M. and Thanh, N. T., 2016. Filling holes on the surface of 3d point clouds based on tangent plane of hole boundary points. In: Proceedings of the Seventh Symposium on Information and Communication Technology, SoICT ’16, ACM, New York, NY, USA, pp. 331–338.
Nguyen, V. S., Trinh, T. H. and Tran, M. H., 2015. Hole bound-ary detection of a surface of 3d point clouds.2015 International Conference on Advanced Computing and Applications (ACOMP)
00, pp. 124–129.
Ni, H., Lin, X., Ning, X. and Zhang, J., 2016. Edge Detection and Feature Line Tracing in 3D-Point Clouds by Analyzing Geo-metric Properties of Neighborhoods. Remote Sensing8, pp. 710.
Nieves, H., 2013. Old Fashion Town: 3D Model. https://free3d.com/3d-model/old-fashion-town-88316.html. On-line; accessed 10-July-2017.
Priestnall, G., Jaafar, J. and Duncan, A., 2000. Extracting urban features from lidar digital surface models. Computers, Environ-ment and Urban Systems24(2), pp. 65 – 78.
Salvaggio, K. N. and Salvaggio, C., 2013. Automated identi-fication of voids in three-dimensional point clouds. Vol. 8866, pp. 88660H–88660H–12.
Wang, J. and Oliveira, M. M., 2007. Filling holes on locally smooth surfaces reconstructed from point clouds. Image and Vi-sion Computing25(1), pp. 103 – 113.{SIBGRAPI}.