MULTI ROTOR UAV AT DIFFERENT ALTITUDES FOR SLOPE MAPPING STUDIES
Khairul Nizam Tahar
Centre of Studies for Surveying Science and Geomatics, Faculty of Architecture, Planning and Surveying, Universiti Teknologi MARA, 40450 Shah Alam, Selangor Darul Ehsan, MALAYSIA.
ICWG I/Vb: UAV-g 2015
KEY WORDS: slope, environment, UAV, accuracy, contour
ABSTRACT:
Most of consultation work only involves a small area, especially for slope mapping studies. The objective of this study is to evaluate the accuracy of slope mapping results from different altitudes at semi-undulated area and undulated area. Multi-rotor UAV is used as an instrument for data acquisition for this study. The images of slope were captured from five different altitudes in the same study area. All images were processed using photogrammetric software to produce digital elevation models and digital orthophoto. In this study, slope map from all different altitudes were identified and recorded for analysis purposes. It was found that the accuracy of slope is increase when altitude is increase. In conclusion, the condition of slope such as semi-undulated and undulated area did have an influence on the slope accuracy.
1. INTRODUCTION
Unmanned aerial vehicle (UAV) has been developed a few decades ago and many studies on UAV were conducted based on many kinds of UAV systems. There are many different UAV systems available in the open market (Dunford et al., 2009; Schmale et al., 2008; Frank, 2009; Grenzdorffer et al., 2008). The examples of UAV components are on-board GPS, autonomous chipset, altimeter sensor, wind speed sensor, inertial navigation sensor and electronic speed controller (Mondragon et al., 2010). The price of UAV system is usually based on the component gadgets installed on the UAV main board. There are two types of UAV system available in the market, namely; fixed wing and rotary. Fixed wing has the same design concepts with manned aircraft, including main wing, elevator, rudder, flaps, and aileron for movement purposes. Rotary has almost the same design concepts with helicopter except it is designed with single rotor or multi rotors. A rotary UAV system with single rotor has the same structure with a manned helicopter while rotary with multi rotor has more than one motor (Lin et al., 2011; David et al., 2009; Zhang et al., 2012). Fixed wing UAV needs momentum energy to move from one point to the next point, while rotary UAV can lift up or hover, stay still in one position and landing on a computer or operator commands. Based on the previous studies, the advantage of fixed UAV is, it can fly up to thousand kilometres based on its specifications (Laliberte and Rango, 2009; Falkner and Morgan, 2002; Lo et al., 2010; Wolf and Dewitt, 2004).A fixed wing aircraft can be landed by computer or the operator, its advantages are it can stay a lot longer and cover more area than rotorcraft. The wind can impact operations for both fixed wing and rotorcraft (Adolf and Hirschmuller, 2011). Fixed wing can provide just as high resolution data as rotorcraft. Both systems can be adjusted to provide the desired overlap and side lap of imagery (Cesetti, et al., 2011; Tahar et al., 2012; Robert and Maxine, 2011). Nowadays, many researchers around the globe have tested different kinds of sensor that can be carried by UAV system (Nagai et al., 2009). This sensor includes a multispectral, SAR, thermal, hyperspectral and LiDAR. These sensors were produced by related companies where the size and weight of these sensors has been compacted and it is suitable for UAV payload. UAV system can be classified in term of size, weight, payload, endurance hour, range and altitude.
Slope mapping has been explored in many regions in the world. Slope instability has frequently occurred in humid tropical countries due to the weather and environmental condition. Slope failure can occur anywhere without prior alarm. Most of the slope failures occurred at man-made slopes and natural slopes depending on the slope gradient. Previously, many techniques have been applied in monitoring slope such as satellite images, Lidar data, GPS observation and aerial photogrammetry (Nagai et al., 2009; Tahar, 2013; Eisenbeiss, 2009; Lin, 2008). Slope failure always occurred at unstable ground because of the changes of ground movement speed in a short period. The development in an area has shifted a natural movement of the ground in the area. There are many factors that can cause slope failure. One of the main factors of slope failure is underground water that flows in the unstable ground. Many researches have been carried out to monitor this problem such as assessment of slope stability, mapping of a slope risk area and in situ measurement of the prone area (Tahar, 2012). Recently, UAV technology has become increasingly popular and useful to solve problem in many applications such as slope mapping (Andrea et al., 2011; Laliberte and Rango, 2009). UAV also promises rapid data acquisition with lower cost as well as lesser time and labour.
also covers the flat area, semi-undulated area and undulated area. The accuracy of the photogrammetric results wasassessed using root mean square error.
2. METHODOLOGY
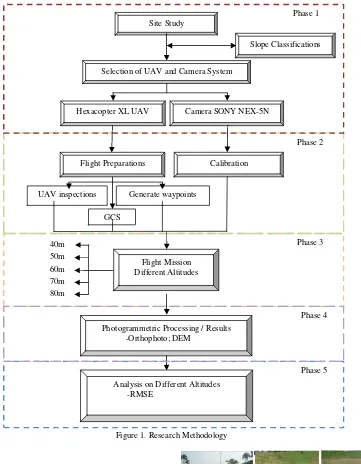
The methodology can be divided into five phases, namely phase 1, phase 2, phase 3, phase 4 and phase 5. Phase 1 is about
preparation stage which includes selection of the study area and selection of UAV and camera. Phase 2 is about UAV flight preparation which includes UAV and camera calibration while phase 3 is a data acquisition at five different altitudes using a multi-rotor. Phase 4 is the image processing and results and phase 5 is the analysis section. Figure 1 illustrates research methodology for this study.
Figure 1. Research Methodology
2.1 Site Study
The site of this study is located at latitude 1⁰ 33’ 39” and
longitude 103⁰ 39’ 13”. The size of the study area for Hexacopter study is about 200 metres by 400 metres. The study area is situated in the new development area. The reason of this study area was chosen because the study area has varied terrain. This location also is suitable for UAV studies because it has sufficient space for UAV launching and landing. Figure 2 shows the location of the study area.
Figure 2. Study Area
2.2 UAV system
Hexacopter XL UAV system is used as a tool for aerial image acquisition. Hexacopter XL UAV has six rotors where three rotors rotated in clockwise and three rotors rotated in Phase 5
Phase 3 Phase 2
Phase 1
Selection of UAV and Camera System
Camera SONY NEX-5N Hexacopter XL UAV
Flight Preparations
Flight Mission Different Altitudes 40m
Photogrammetric Processing / Results -Orthophoto; DEM
Analysis on Different Altitudes -RMSE
Site Study
Slope Classifications
UAV inspections Generate waypoints
GCS
50m 60m 70m 80m
Phase 4
clockwise. This UAV system is equipped with the autonomous system, GPS system, electronic speed controller and three axis accelerometer system. The Ground Control Station (GCS) is used to control the UAV while the transmitter simply is a relay of command between the GCS and the UAV during hovering and landing, to switch camera mount position, to trigger the camera on and off and to hold UAV altitude. An operator is responsible on each switch available on the transmitter. A digital camera is attached at the camera mount which islocated at the bottom of the UAV. The specification of Hexacopter and camera Sony NEX-5N are shown in Table 1 and Table 2 respectively.
Table 1. Hexacopter Specification (Tahar and Ahmad, 2012)
Features Hexacopter
Weight 2.2kg(XL)
Rotor 6 rotor
Endurance Up to 20 minutes with payload
Payload 1.5kg(XL)
Special function Automatically return to home location (1st point)
Stabilizer Inbuilt stabilizer to deal with wind correction
Capture data Using software to reached waypoints
Flight control Manual and autonomous Camera stand Flexible camera holder Ground Control
Resolution Effective Pixels :16.1 megapixels 4912 x 3264 Autonomous flight mission uses specific software to navigate the UAV based on a predefined set of waypoints. The Hexacopter XL UAV is using MK Tool software (HiSystem GmbH, 2008) for autonomous flight mission. Each UAV system has its own flight control software and it depends on the navigation chipset installed on the UAV system. In this case, Hexacopter XL UAV uses Mikrokopter navigation chipset and it is suitable for MK Tool Software. The communication between the GCS and the UAV were established using radio modem with a specific frequency.
2.3 Camera and UAV Calibration
This study was conducted self-calibration method for camera calibration. The camera was calibrated using a calibration plate which has a dimension of 0.4 metres x 0.4 metres. This plate consists of 36 screws with different heights and the screws were arranged in a matrix form of 6 x 6 units. Each of the screws was fitted with a retro-reflective target. A scale bar was also placed on the calibration plate to provide scale to the image in a acquisition was utilized and it requires a different angle of the camera position in capturing the calibration plate. It is important to ensure that the distance between the camera and calibration plate for every location of the camera is approximately the same. The angle of capturing image must be maintained at every camera position.
Bundle adjustment method processes the final value for all parameters of the camera. The camera calibration parameters include focal length (c), principal points (xp, yp), radial lens distortion (k1, k2, k3), tangential lens distortion (p1, p2), affinity (b1) and scale factor (b2) (Remondiono and Fraser, 2006). In this study, all parameters were used in the interior orientation processing. The camera calibration results are described in Table 3.
Hexacopter UAV is fully assembled with electronic board and sensor. These sensors should be calibrated before a flight mission to avoid any incident during the mission. The related sensors are gyro sensor, barometric sensor, compass / magnetic sensor. Gyro sensor is responsible in maintaining the stability of UAV during flight mission. Three axis accelerometer need to be calibrated namely automatic correct for yaw, pitch and roll movement. The detailed calibration for Hexacopter can be found at http://www.mikrokopter.us/media/?sa=item;in=866.
2.4 Data Acquisition: Flight Planning for Hexacopter UAV (Rotary-wing UAV)
is fit to fly. An operator operated the UAV (lift up) until it reached the required altitude. When the UAV reached the required altitude, the operator can change the UAV mode to autonomous. In the autonomous mode, Hexacopter UAV received input from laptop via radio modem. The UAV has
flown based on the starting waypoints until the end of waypoints. In this study, all missions were programmed for auto landing. However, an operator must be alert at all time to avoid any accident during the flight mission.
Figure 3. General Step for Data Acquisition Using Hexacopter UAV
2.5 Data Pre-Processing and Processing
In this study, Photomod software (Racurs, 2004) is used to process images from the Hexacopter UAV. In general, Hexacopter UAV is used to capture images from an altitude of 40 metres, 50 metres, 60 metres, 70 metres, 80 metres at the same study area. Aerial image acquisition of Hexacopter UAV was conducted on March 2012. In this study, Hexacopter UAV images were used to carry out three different processing to determine the effect of GCP that wasestablished from different RTK-GPS techniques. There were five different processing obtained for different altitude. Figure 4 illustrates the spatial location of 4 GCPs and 15 checkpoints (CPs) in the study area.
Figure 4. Spatial Location of GCPs and CPs
UAV raw images were downloaded into a computer after a flight mission is completed. Each image was saved as a JPEG file. The quality of images was checked before they were used in the processing stage. Some of the images might have some quality problems such as blurred image and colour balancing error which were caused during flight mission. These problems usually arisen from the attitude of the UAV during flight mission. However, in this study, all acquired images were of good quality and they were proceeded for the photogrammetric processing. As usual, all acquired images need to go through all photogrammetric operations such as interior orientation, exterior orientation, aerial triangulation and bundle adjustment.
GCP is used for the determination of exterior orientation parameters which include three spatial location of the camera position in space (Xo, Yo, Zo) and three rotational parameters (ω, Φ, κ). The GCP is also utilised to link the tie points to the reference coordinate system used. The GCPs are established using RTK-GPS, which required about 2 minutes observation if the satellite configuration is in good condition. CPs was used to check on the accuracy assessment of photogrammetric results of the study area. After both orientations are carried out, then
aerial triangulation process is executed. Aerial triangulation is responsible to link or establish a precise and accurate relationship between the individual models. Furthermore, aerial triangulation also coordinated points on the ground by using a series of overlapping aerial photographs. Accuracy assessment of aerial triangulation process can be defined by using root mean square error (RMSE). There are two main photogrammetric results produced in this study, namely DEM and digital orthophoto. These products are explained in the results and analysis chapter.
2.6 Data Analysis and Accuracy Assessment
Hexacopter UAV was used to obtain aerial images in the specific slope area which involved only a small area. The study area of Hexacopter UAV experimentation is limited to 400 metres by 200 metres. The experiment studied the effect of photogrammetric results acquired from different flying height, i.e. 40 metres, 50 metres, 60 metres, 70 metres and 80 metres. The accuracy assessments were conducted using root mean square error.
3. RESULTS AND ANALYSIS
The maximum flying height altitude is set based on the limitation of the Hexacopter UAV in which it allows to fly until 80 metres above the surface level due to the local regulatory issue. The minimum flying is set based on the slope condition in the selected study area where altitude 40 metres above surface level is the safe flying height for Hexacopter due to the building and facilities height at the study area. The analyses of photogrammetric results for each altitude were assessed in this study. Figure 5 illustrates the examples of orthophoto and DEM at thestudy area.
a b
Figure 5. Results (80m); (a) Orthophoto, (b) DEM Site Reconnaissance Search Images in
MKToolsMaps MKTool
Select Waypoints Sent to UAV Navigation
Control
Autonomous Fly to
waypoints Landing
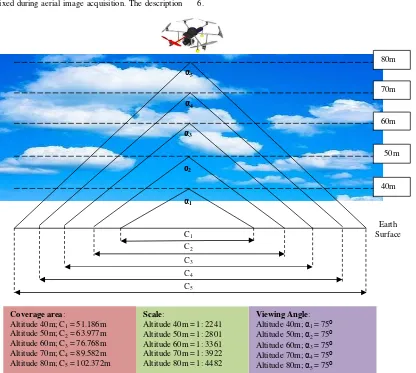
Angle view for each flying height is the same because the focal length is fixed during aerial image acquisition. The description
of angle view, scale and spatial coverage are described in Figure 6.
Figure 6. Description of UAV Images at Different Flying Height
Based on Table 4, the maximum RMSE value for ground control points X coordinate is +1.116m (50m) and the minimum RMSE value is +0.488m (80m). The maximum value for ground control points Y coordinates is +0.779m (50m) and the minimum RMSE value is +0.306m (70m). The maximum value for ground control points Z coordinates is +2.029 (50m) and the minimum RMSE value is +0.170m (80m). The maximum RMSE value for ground control points XY coordinates is +1.361m (50m) and the minimum RMSE value for XY coordinates is +0.679m (70m). The tabular data for ground control points are represented in the graph shown in Figure 7.
Table 4. RMSE Results for the Different Altitude
40m 50m 60m 70m 80m
GCPs X (m) 0.787 1.116 0.806 0.606 0.488 Y (m) 0.554 0.779 0.371 0.306 0.490 Z (m) 1.320 2.029 1.030 0.745 0.170 XY
(m)
0.963 1.361 0.888 0.679 0.691
CPs X (m) 0.312 0.738 0.435 0.311 0.400 Y (m) 0.758 1.015 0.462 0.480 0.450 Z (m) 5.468 5.276 4.148 3.064 2.490 XY
(m)
0.884 1.373 0.728 0.647 0.659
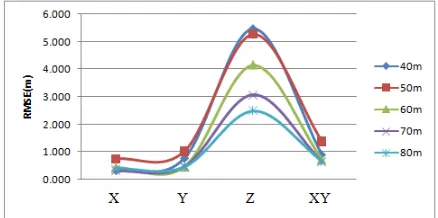
Figure 7. Graph of RMSE for Ground Control Points (Different Altitude)
Referring to Figure 7, the graph of RMSE for ground control points produced from UAV images are captured at different altitudes. This graph shows the RMSE results for X and Y coordinates are not significant, but Z coordinates display a huge range for different flying height. However, the difference between X and Y coordinates is about +0.6 metres while Z coordinate is about +1.7 metres. The maximum RMSE value for checkpoints X coordinate is +0.738m (50m) and the minimum RMSE value is +0.311m (70m). The maximum RMSE value for checkpoints Y coordinate is +1.105m (50m) and the minimum RMSE value is +0.450m (80m).
Viewing Angle: Altitude 40m; α1 = 75⁰
Altitude 50m; α2 = 75⁰
Altitude 60m; α3 = 75⁰
Altitude 70m; α4 = 75⁰
Altitude 80m; α5 = 75⁰
Scale:
Altitude 40m = 1: 2241 Altitude 50m = 1: 2801 Altitude 60m = 1: 3361 Altitude 70m= 1: 3922 Altitude 80m = 1: 4482 Coverage area:
Altitude 40m; C1 = 51.186m Altitude 50m; C2 = 63.977m Altitude 60m; C3 = 76.768m Altitude 70m; C4 = 89.582m Altitude 80m; C5 = 102.372m
α5
α4
α3
α2
α1
C5 C4 C3 C2 C1
80m
70m
60m
50m
Earth Surface
The maximum RMSE value for checkpoints Z coordinate is +5.468m (40m) and the minimum RMSE value is +2.490m (80m). The maximum RMSE value for checkpoints XY coordinates is +1.373m (50m) and the minimum RMSE value is +0.647m (70m). The tabular data for the checkpoints are represented in the graph shown in Figure 8. Five different altitudes and 15 checkpoints were used to assess the accuracy of photogrammetric results.
Figure 8. Graph of RMSE for Checkpoints (Different Altitude)
Figure 8 shows the graph of RMSE for checkpoints produced from UAV images captured at different altitudes. This graph
shows the same graph pattern for every altitude, but huge difference for Z coordinate. However, the difference between X and Y coordinates is about +0.2 metres while Z coordinate is about +2.9 metres. The results appear less accurate at larger scales (lower altitudes) due to the surface condition. The study area covers with the various slope angles which affect the results due to the lens limitation.
4. DISCUSSIONS
4.1 Qualitative Assessment of Contours
Figure 9 shows the contour lines pattern obtained from different altitudes; 40m, 50, 60, 70m and 80m. All contour lines have an interval of one metre and it has been automatically generated by using ArcGIS software. The main source of these contour lines was obtained from DEM for each altitude. It can be observed that contour lines for 40m and 50m are almost 95% same while at altitude 60 m and above, the contour line pattern started to change.
(a) (b) (c) (d) (e)
Figure 9. Contour Lines (Different Altitude); (a) 40m, (b) 50m, (c) 60m, (d) 70m, (e) 80m
4.2 Quantitative Assessment of Slope Attributes
In these experiments, the comparison of slope attribute at different altitudes was plotted in one graph. Figure 10 illustrates the slope attributes for different altitudes according to the slope class. Figure 10 shows that the slope attribute for different flying height is not significant, but it has the same pattern. The range percentage of slope attribute for ‘gentle slope’ class is about 22%, for ‘moderate slope’ class is about 4%, for ‘steep slope’ class is about 7% and for ‘very steep’ slope class is about 11%.
Figure 10. Slope Attributes at Different Altitude
In these experiments, slope attributes using the conventional method was used as a benchmark or reference for the slope attributes studies. The comparison of slope attributes at different
altitudes and slope attributes using the conventional method were plotted in Figure 11.
Based on Figure 11, slope attributes for the ‘gentle slope’ class recorded at 80m altitude, which is equal with the conventional method and the ‘very steep slope’ class recorded 40m and 50m altitude which is equal with the conventional method. A comparison of the slope attributes at different altitudes and slope attributes using the conventional method was plotted in Figure 11.
Figure 11. Slope Attributes at Different Altitude and Conventional Results (Total Station)
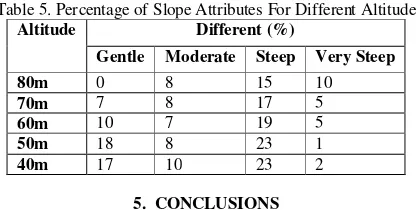
compared with the conventional land survey technique by using a total station. Therefore, results from the total station observation are parallel to the slope attributes benchmark. Table 5 describes the percentage of slope attributes for different altitude based on different slope class. So it can be concluded that ‘gentle’, ‘moderate’ and ‘very steep’ slope classes produced not much difference in the slope attributes aspect while steep slope class records huge difference for each flying height.
Table 5. Percentage of Slope Attributes For Different Altitude
Altitude Different (%)
Gentle Moderate Steep Very Steep
80m 0 8 15 10
Hexacopter UAV acquired aerial images from five different altitudes. This study proves that the micro UAV (weight less than 5kg) which comprise of Hexacopter UAV was successfully used to acquire digital aerial image of slope area. Moreover the UAV images were successfully processed to produce slope map of the real site study area with highly accurate results. In this study, the error distributions for each coordinate for slope mapping references have been identified. Easting and northing coordinates offer a better result compared to height coordinate. Therefore, it can be concluded that the UAV can be used for slope mapping studies, especially for acquiring slope data. It is recommended that, the comparison between LiDAR and Terrestrial Laser Scanner with UAV is explored to determine the cost, accuracy and time taken to complete a mapping project. This study has potential in slope mapping study, especially for developing area which requires frequently updated map. Finally, it can be concluded that the UAV could be used for large scale mapping as demonstrated in this study.
ACKNOWLEDGMENTS
Faculty of Architecture, Planning and Surveying Universiti Teknologi MARA (UiTM), Research Management Institute (RMi) and Ministry of Higher Education (MOHE) are greatly acknowledged because providing the fund RAGS 600-RMI/RAGS 5/3 (241/2014), RAGS/1/2014/TK09/UITM/3 to enable this study is carried out. Special thanks to who directly or indirectly involved in this study.
REFERENCES
Adolf F.M., Hirschmuller, H., 2011. Meshing and simplification of high resolution urban surface data for UAV path planning. Journal of intelligent and robotic system, 61, pp.169-180.
Andrea, C., Emanuele, F., Adriano, M., Andrea, A., Primo, Z., Sauro, L., 2011. A Visual Global Positioning System for Unmanned Aerial Vehicles Used In Photogrammetric Applications. Journal of Intelligent Robotic System, 61, pp. 157-168.
Baoping, L., Xinpu, S., Zhiyu, X., Chengwen, E., Bing, L., 2008. Actualize of Low Altitude Large Scale Aerophotography and Geodesic base on Fixed-wing Unmanned Aerial Vehicle Platform. The International Archived of the Photogrammetry,
Remote Sensing and Spatial Information Sciences, vol. XXXVII, Part B1, Beijing, pp. 643-646
Cesetti A., Frontoni E., Mancini A., Ascani A., Zingaretti P., Longhi S., 2011. A visual global positioning system for unmanned aerial vehicles used in photogrammetric applications. Journal of intelligent and robotic system, 61, pp. 157-168.
David, H.S., Jae-Sup, H., Hong-Tae, Y., 2009. A Development of Unmanned Helicopters for Industrial Applications. Journal Intelligent Robotic System, 54, pp. 407-421.
Dunford R., Michel K., Gagnage M., Piegay H., Tremelo M.L., 2009. Potential and constraints of unmanned aerial vehicle technology for the characterization of Mediterranean riparian forest. International journal of remote sensing, 30(9), pp. 4915-4935 Photography Shaped Digital Aerial Mapping. http://www.suite101.com/content/history-of-aerial-photography. (Accessed 23 January 2014)
Grenzdorffer, G.J., Engel, A., Teichert, B., 2008. The Photogrammetric Potential of Low Cost UAVs Forestry and Agricultural. The International Archived of the Photogrammetry, Remote Sensing and Spatial Information Sciences, XXXVII, Part B1, Beijing, pp. 1207-1214.
Hai, Y.C., Yong, C.C., Yang, Q.C., 2010. Autopilots for Small Unmanned Aerial Vehicles: A Survey. International Journal Control Automation, 8, 1, pp. 36-44.
HiSystem GmbH, 2008. Mikrokopter.de, Moormerland, Germany http://www.mikrokopter.de/en/home (12 Mar. 2015).
Laliberte A.S., Rango, A., 2009. Texture and Scale in Object-Based Analysis of Subdecimeter Resolution Unmanned Aerial Vehicle (UAV) Imagery. Geoscience and Remote Sensing, IEEE Transaction on, 47, 3, pp. 761-770.
Lin A.Y.M., Novo A., Har-Noy S., Ricklin N.D., Stamatiou K., 2011. IEEE Journal of selected topics in applied earth observation and remote sensing, 4(4), pp. 870-876.
Lin, Z., 2008. UAV for Mapping – Low Altitude Photogrammetric Survey. The International Archived of the Photogrammetry, Remote Sensing and Spatial Information Sciences, XXXVII, Part B1, Beijing, pp. 1183-1186.
Lo, C.Y., Chen, L.C., Chang, L.Y., Huang, C.M., 2010. Hazard Survey Using Multitemporal Satellite Imagery. International Archives of the Photogrammetry, Remote Sensing and Spatial Information Science, XXXVIII, Part 8, Kyoto, Japan, pp. 256-260.
Mondragon I.F., Olivares-Mendez M.A., Campoy P., Martinez C., Mejias L., 2010. Unmanned aerial vehicles UAVs attitude, height, motion estimation and control using visual systems. Autonomous robotic, 29, pp. 17-34.
Nagai M., Chen T., Shibasaki R., Kumagai H., Ahmed A., 2009. UAV-Borne 3-d mapping system by multisensory integration. IEEE transaction on geosciences and remote sensing, 47(3), pp. 701-708.
Photometrix, 2006. Australis Photometrix, Melbourne, Australia http://www.photometrix.com.au/australis/ (4 Feb. 2015).
Racurs, 2004. Photomod software, Moscow, Russia http://www.racurs.ru/ (5 Jan. 2015).
Remondiono, F., Fraser, C., 2006. Digital Camera Calibration Methods: Considerations and Comparisons. ISPRS Commission V Symposium Image Engineering and Vision Metrology, IAPRS, XXXVI, Part 5, pp. 266-272.
Robert, P.B., Maxine, E.D., 2011. Evaluation of Bare Ground on Rangelands using Unmanned Aerial Vehicles: A case study. GISCI Remote Sensing, 48, 1, pp. 74-85.
Tahar, K.N., Ahmad, A., 2011. UAV-Based Stereo Vision for Photogrammetric Survey in Aerial Terrain Mapping. International Conference on Computer Applications and Industrial Electronics, ICCAIE, Penang, Malaysia, pp. 443-447.
Tahar, K.N., Ahmad, A., 2012. A simulation study on the capabilities of rotor wing unmanned aerial vehicle in aerial terrain mapping. International Journal of Physical Science, 7, 8, pp. 1300 – 1306, doi: 10.5897/IJPS11.969
Tahar K.N., Ahmad A., Akib W.A.A.W.M., Mohd W.M.N.W. 2012. A new approach on production of slope map using autonomous unmanned aerial vehicle. International journal of physical sciences, 7(42), pp. 5678-5686.
Tahar, K.N., 2012. Aerial Terrain Mapping Using Unmanned Aerial Vehicle Approach. International Archives of the Photogrammetry, Remote Sensing and Spatial Information Sciences, Volume XXXIX-B7, 2012 XXII ISPRS Congress, Melbourne, Australia, pp. 493-498. Copernicus Publishing.
Tahar, K.N., 2013. An Evaluation on Different Number of Ground Control Points In Unmanned Aerial Vehicle Photogrammetric Block. International Archives of the Photogrammetry, Remote Sensing and Spatial Information Sciences, Volume XL-2/W2, ISPRS 8th 3DGeoInfo Conference & WG II/2 Workshop, Istanbul, Turkey, pp. 93-98. Copernicus Publishing.
Schmale D.G., Dingus, B.R., Reinholz, C., 2008. Development and Application Of An Autonomous Unmanned Aerial Vehicle For Precise Aerobiological Sampling Above Agricultural Fields. Journal Field Robotic, 25, 3, pp. 133-147.
Wolf, P.R., Dewitt, B.A., 2004. Elements of Photogrammetry with GIS application. International Edition, 3rd Ed. McGraw Hill, pp. 307-409.