A QUALITY ASSESSMENT METHOD FOR 3D ROAD POLYGON OBJECTS
Lipeng Gao a, b, Wenzhong Shi b, *, YiliangWan a, b
a School of Remote Sensing and Information Engineering, Wuhan University, Wuhan, China – [email protected], [email protected]
b Joint Spatial Information Research Laboratory, The Hong Kong Polytechnic University and Wuhan University, Hong Kong and Wuhan, China – [email protected]
Commission II, WG II/4
KEY WORDS: Quality Assessment; Quality Element; 3D Road Polygon; LiDAR
ABSTRACT:
With the development of the economy, the fast and accurate extraction of the city road is significant for GIS data collection and update, remote sensing images interpretation, mapping and spatial database updating etc. 3D GIS has attracted more and more attentions from academics, industries and governments with the increase of requirements for interoperability and integration of different sources of data. The quality of 3D geographic objects is very important for spatial analysis and decision-making. This paper presents a method for the quality assessment of the 3D road polygon objects which is created by integrating 2D Road Polygon data with LiDAR point cloud and other height information such as Spot Height data in Hong Kong Island. The quality of the created 3D road polygon data set is evaluated by the vertical accuracy, geometric and attribute accuracy, connectivity error, undulation error and completeness error and the final results are presented.
* Corresponding author
1. INTRODUCTION
Image based feature extraction starts from the end of 1980’s, the used data includes from gray imagery, colourful imagery, Laser mapping data to stereoscopic imagery, high resolution imagery and hyperspectral imagery (Noronha and Nevatia, 2001). During recent years, advancements in commercially available GPS and Inertial Measurement Unit (IMU) have made it possible to obtain an increasingly high degree of accuracy using LiDAR from moving features, such as aircraft. By using LiDAR, the higher resolution, the more detailed surfaces generated. In this respect, for instance, subtle changes in the landscape are able to be detected, because the post spacing is more intense than it is by traditional methods. Hence, compared with traditional surveying and mapping systems such as photogrammetric systems, LiDAR acts more directly, efficiently and accurately when measuring such instances (Shan and Aparajithan, 2005). The obtained measurements which behave as 3D point clouds and include terrain points for bare earth and off-terrain points for vegetation such as trees and objects such as buildings, bridges, power lines, and towers. Such measurements become a major source of digital terrain information (Raber et al., 2007) to the extent that LiDAR has even taken the place of traditional photogrammetric approaches and is extensively used to generate products like DEMs in many European countries (Elmqvist et al., 2001; Schickler and Thorpe, 2001; Vosselman, 2000). LiDAR has emerged as a robust technique for high accuracy in the survey of terrestrial landscapes (Bretar et al., 2003). Ground information can be quickly accessed through remote sensing images, especially with the emergence of high-resolution remote sensing images and airborne LiDAR data, making it an important data source for GIS database and map updates(Shi et al., 2001; Tian, 2009).
Many scholars have done a lot of work in this regard and proposed a number of algorithms and models to extract road information. In the area of road delineation, Wu used LiDAR data to get the normalized DSM (NDSM). The fusion image is generated by IHS transform and is used for image classification and three-dimensional city model establishment (Wu, 2009). Mumtaz et al. proposed a hierarchical extraction method that integrates utilizing LiDAR data and remote sensing images, the buildings are firstly extracted, then the vegetation is extracted combined with NDVI vegetation index, finally the road is separated out to complete road information extraction (Mumtaz and Mooney, 2008). Gong et al. proposed a clustering method to automatically extract road information from LiDAR data and remote sensing images. The method firstly uses a clustering algorithm to divide the LiDAR intensity data into two major categories of road and non-road according to the intensity value, then the intensity data is fused with colour information in the aerial remote sensing image. The fusion result contains both the location and intensity as well as the echo time information and spectral information, the experiment result shows that the fusion method could improve the extraction accuracy (Gong et al., 2010). Samadzadegan et al. proposed a road information extraction method from LiDAR data based on the fusion of multiple classifiers (MCS), the results show that the use of multi-classifier fusion method is better than using a single classifier (Samadzadegan et al., 2009). Zhan proposed a hierarchical object-based method about land cover research, which also applies to the road extraction from the remote sensing image (Zhan, 2003).
In the aspect of spatial quality assessment, the traditional 2D GIS focuses on the approaches of measuring positional error for points, lines, and polygons, modelling attribute, temporal uncertainties (Devillers et al., 2010) and other quality elements The International Archives of the Photogrammetry, Remote Sensing and Spatial Information Sciences, Volume XL-3/W3, 2015
including logical consistency, completeness, and semantic accuracy (Guptill and Morrison, 2013). Quality control aims to control the overall quality of spatial data, in order to reduce the spatial data error to a desired level (Shi, 2009; Shi et al., 2003). Considerable researchers have raised a lot of methods to control the quality of the spatial dataset. Shi et al. proposed to model the error of geometric features (Shi, 1998). Zhang and Goodchild discussed the variance and covariance propagation in a line’s length or a polygon’s areal extent based on positional error (Chrisman and Yandell, 1988; Zhang and Goodchild, 2002). Moreover, many other methodologies for the quality assessment on spatial data were developed on the applications such as digital city, land surveying, navigation data production, etc.
In this paper, we will introduce a quality assessment method for 3D road polygon objects. In section 2, a framework of 3D road polygon creation method with 2D Road Polygon and LiDAR point cloud dataset is presented. Then 6 quality components for 3D road polygon quality control are defined in section 3. In section 4, experiment results with two test areas in Hong Kong Island will be given and the quantitative statistics of results and analysis will be presented. Finally, a conclusion is presented in section 5.
2. METHODOLOGY OF THE 3D ROAD POLYGON
CREATION
schema Completeness Connectivity error Absolute
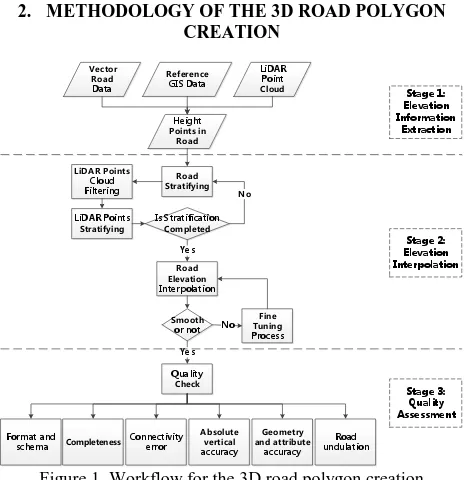
Figure 1. Workflow for the 3D road polygon creation
The workflow includes three main steps: elevation information extraction, road elevation interpolation, and quality assessment.
Stage 1: Road area points are extracted from the point cloud.
Accurate vector GIS road edges are used as geometric constraints for the point extraction. The point on the road kerb sides is excluded to eliminate the noise of road surfaces. The point cloud within the road boundary is extracted for use in later steps.
Stage 2: Automatic stratifying process is carried out for the
road polygons. The purpose of this process is to label the level of each road polygon, with its “level” attribute value in the attribute table. There are two major criteria for the stratifying. The first is the road height, which is reflected by median elevation of LiDAR data points within the road polygon, as well
as the elevation attribute value of the polygon. The second criterion is the road type: a general assumption is that the level of road bridges should be no less than 2, while the level of roads in other types should be 0 or 1. The two criteria are considered together to determine the level of each road polygon and the level value is recorded in the “level” attribute field of the polygon.
Second, interpolation techniques are used to restore the road sections which are under overpasses and three-dimensional roads are reconstructed. According to different road situations in the real world, two different interpolation techniques are used. For hilly areas and flat ground areas, the DTM LiDAR data is used for the interpolation. For the viaduct polygons, the DSM LiDAR data is used for the interpolation. After the interpolation, if the constructed road is not smooth enough, a road fine tuning operation is applied to refine the elevation of the road.
Stage 3: QA/QC methods are applied to the interpolation result.
Interpolated roads with quality problems could be identified and corrected by the software or manually.
3. QUALITY CONTROL AND ASSURANCE
METHODOLOGY
3.1 QA/QC on format and schema
The file format is ensured to be the same as 2D road polygon. Number of features and schema of each feature classes in 3D Road Polygon Dataset are examined against 2D road polygon and ensured to be identical with the original 2D road polygon dataset.
3.2 QA/QC on completeness
Completeness of the data set is measured by the commission error and the omission error. The commission error indicates the excess data present in the dataset, the omission error indicates the data absent from the dataset.
2
N is the number of excess road polygons in 3D road polygon dataset; omission error could be calculated.
3.3 QA/QC on connectivity
For connected 3D road polygons, points with the same (x, y) coordinates shall have the same height values. The connectivity error is formulated as
2
= PE 100%
D
N connectivity error
N
(4)
where
PE
N is the number of polygons with same (x, y) coordinates but different height values;
2D
N is the number of polygons in 2D road polygon dataset;
All the vertices within the Road Polygons, Junction Polygons and Road Asset polygons are examined. Those vertices, in the same layer and with the same (x, y) coordinates but different z values, would be identified as inconsistent vertices.
3.4 QA/QC on absolute vertical accuracy
The absolute vertical accuracy is measured by the root mean square error (RMSE) of the heights of individual 3D road polygons. According to the contract document, the threshold of the RMSE is ±0.4m.
The vertical accuracy of the generated 3D road is assessed against the Spot Height points with higher elevation accuracy. The vertical coordinates of the Spot Height points are perceived as reference values. The following method is used to calculate the vertical data error:
[
]
1
m
n
(5)where
is the vertical coordinate difference between a Spot Height point and z value of a point with the same (x, y) coordinates in the 3D road polygon;n is the number of reference points
3.5 QA/QC of geometric and attribute accuracy
The (x, y) coordinates, number of vertices, feature shape, feature size and attribute information for each 3D road polygon shall be identical to those for the original 2D road polygon.
The geometric inspection is conducted. Firstly, the total numbers of vertices in original 2D and constructed 3D road polygons are calculated by the software independently and then are compared. Then the numbers of vertices and (x, y) coordinates of corresponding vertices in the 2D and 3D roads are computed and compared by the computer. The attribute accuracy assessment is conducted by a comparison between attribute tables of the 2D and 3D roads, including the inspection on numbers of fields, attribute names, and whether any attribute value is missing or wrong.
3.6 QA/QC on road undulation
To avoid undulating road surface situations, a road undulation checking algorithm has been developed to inspect road segments with excessive inclination values. The road undulation check is conducted automatically by an undulation check algorithm. For each edge in a road polygon along the direction of the road, its slope is computed by coordinates of its end vertices. If the difference between two slope values of adjacent edges exceeds the threshold of ±0.15, an undulation is regarded to occur. Then the relevant vertices are marked and corrected later using a smoothing algorithm or manual editing.
The smoothing algorithm works as follows. Firstly, the undulation vertices are recognised by the undulation check
algorithm and elevation values of all undulation vertices are cleared. Then new elevation values of these undulation vertices would be interpolated by nearby vertices without the undulation error using linear interpolation method (Figure 2).
Fitting curve Candidate interpolation
points
Road nodes profile
Figure 2. Diagram of the smoothing algorithm. The blue line is the road nodes profile, the green points is the candidate
interpolation points, the green line is the fitting curve
4. EXPERIMENT
4.1 Data source
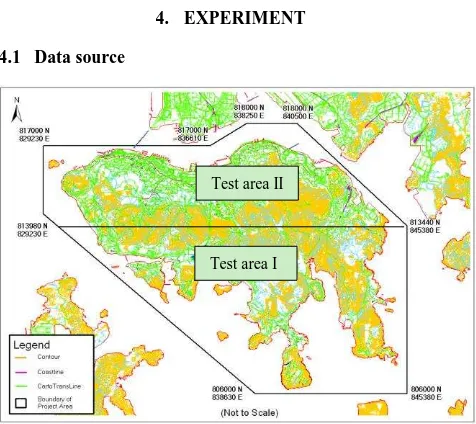
Figure 3. Boundary of the research area. The test area I is located in the south of Hong Kong Island, the test area II is
located in the north of Hong Kong Island.
The 2D Road Polygon Dataset is converted from road features in Hong Kong B1000 map series with a scale of 1:1000. The 2D Road Polygon Dataset includes three feature classes: Road Polygon, Junction Polygon, and Road Asset Polygon. The currency of 2D Road Polygon Dataset is at September 2011. The approximated numbers of 2D Road Polygon features within the test area is about 11500 and the approximate road length is 770 km.
The LiDAR data was acquired by using Optech Gemini ALTM LiDAR sensor in 2010. The horizontal position is referenced to Hong Kong 1980 Grid System and the vertical position is referenced to Hong Kong Principle Datum. The maximum point spacing of LiDAR data is 0.5m. The vertical accuracy and horizontal accuracy of LiDAR data are around 0.1m and 0.3m at 95% confidence interval respectively.
4.2 Experiment result
The 3D Road Polygon data is created by integrating 2D Road Polygon data with LiDAR point cloud and other height information such as Spot Height data in the project area. The final 3D Road Polygon data results include comprehensive height information for all designated data sets. The quality of
Test area II
Test area I
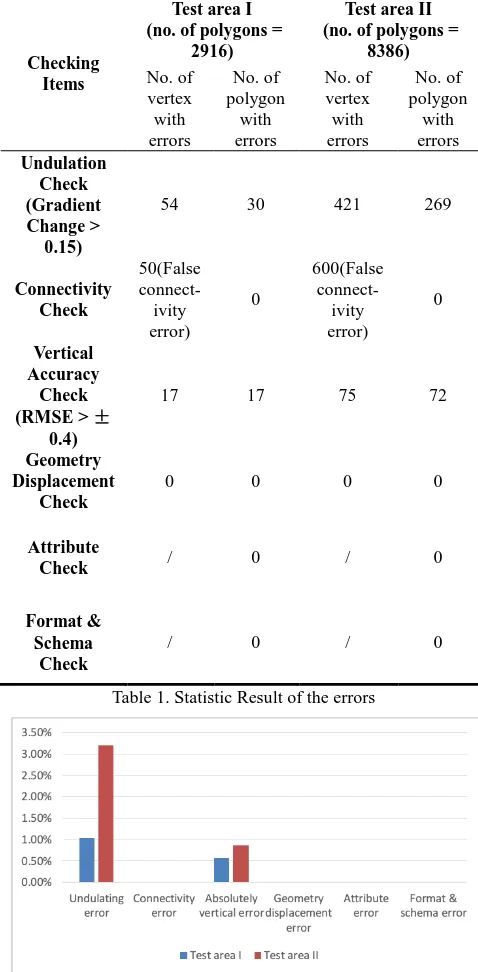
the created data set, reflected mainly by the vertical accuracy, connectivity, undulation and completeness, the statistic results of QA/QC of created 3D road polygons are shown in the Table 1.
Table 1. Statistic Result of the errors
Figure 4. Statistic error of each quality element. The blue color is for the Test area I, and the red color is for the Test area II.
4.3 Discussion
As the 3D road polygons are constructed based on the 2D road polygons and the attribute fields and value could be inherited well, it can be found that the format and schema error, the attribute error and the geometry displacement error is zero.
Moreover, the undulating error and the absolute vertical error refer to the fluctuation of Z values of nearby points on the road along the road direction. The slope of a road in the study area is generally not over
0.15. Therefore, the undulation can be defined based on slope difference between road segments with common vertices. However, in the actual data, at the joint of two road segments, common vertices in the two segments belonged to different entities respectively, which make the inspection of the undulation problem between adjacent roads very difficult.The undulation problem is mainly caused by the interpolation algorithm and the LiDAR point filtering algorithm since only the linear interpolation algorithm is applied and the interpolation error exists in the filtering algorithm. Moreover, the LiDAR point cloud contains noise points which do not represent real elevations can affect the interpolation result, too.
The connectivity problem is caused by the process of the road interpolation. In the interpolation process, each road polygon is interpolated individually. Therefore, elevation values of common nodes on two roads at their junction are interpolated using different LiDAR points. This led to inconsistent interpolated elevations of the common points. In Figure 4, it can be found that the connectivity error of each test area is zero. This is because an automatic check by the computer algorithm would lead to over detection of the error. In other words, some unconnected roads in reality are falsely reported as connectivity error by the automatic inspection algorithm.
It can be also found that the Test Area II leads to more errors than Test Area I, it is because that there are 8386 road objects in Test Area II, however only 2916 road objects in Test Area I. So the road object number in Test Area II is nearly 3 times than Test Area I. Moreover, from the aspects of road complexity, the Test Area II is more complicated than the Test Area I because there are more viaducts in the Test Area II. So this leads to more difficulty in the automatic processing of the roads in Test Area II.
5. CONCLUSION
In this paper, we addressed the issue of QA/QC of the 3D road polygons which are constructed by 3D point cloud and 2D road polygons. As main focus of our work, we presented 6 quality elements that could be used in the QA/QC process: the format & schema error, the undulating error, the absolutely vertical error, the connectivity error, the geometric displacement error and the attribute error, etc.
We were able to present preliminary results achieved by the modules already implemented in two test area in Hong Kong Island. These preliminary results show the high potential of the quality assessment method for the 3D road polygon objects.
ACKNOWLEDGEMENTS
The experimental data were provided by the Survey and Mapping Office (SMO) of Lands Department (LandsD) of Hong Kong. We especially thank Mr. TONG Yau-chuen and Mrs. Tse Oi Chi (Rebecca) very much for our discussion in the technology of LiDAR data processing and development of system as well as for their kind helps in LiDAR data check and delivery.
References
Bretar, F., Pierrot-Deseilligny, M. and Roux, M., 2003. Estimating intrinsic accuracy of airborne laser data with local 3d-offsets. In: International Archives of Photogrammetry and Remote Sensing, Dresden, Germany, Vol. XXXIV, pp. 20-26.
Chrisman, N.R. and Yandell, B.S., 1988. Effects of point error on area calculations: A statistical model. Surveying and Mapping, 48(4), pp. 241-246.
Devillers, R., Stein, A., Bedard, Y. and Al, E., 2010. Thirty Years of Research on Spatial Data Quality - Achievements, Failures, and Opportunities. Transactions in GIS, 14(4), pp. 387-400.
Elmqvist, M., Jungert, E., Lantz, F., Persson, A. and Soderman, U., 2001. Terrain modelling and analysis using laser scanner data. International Archives of Photogrammetry Remote Sensing and Spatial Information Sciences, 34(3/W4), pp. 219-226.
Gong, L., Zhang, Y., Li, Z. and Bao, Q., 2010. Automated road extraction from LiDAR data based on intensity and aerial photo. In: Image and Signal Processing (CISP), 2010 3rd International Congress, Yantai, China, Vol. 5, pp. 2130-2133.
Guptill, S.C. and Morrison, J.L., 2013. Elements of spatial data quality. Elsevier.
Mumtaz, S.A. and Mooney, K., 2008. Fusion of high resolution lidar and aerial images for object extraction, IEEE, pp. 137-142.
Noronha, S. and Nevatia, R., 2001. Detection and modeling of buildings from multiple aerial images. Pattern Analysis and Machine Intelligence, IEEE Transactions on, 23(5), pp. 501-518.
Raber, G.T. et al., 2007. Impact of lidar nominal post-spacing on DEM accuracy and flood zone delineation. PHOTOGRAMMETRIC ENGINEERING AND REMOTE SENSING, 73(7), pp. 793-804.
Samadzadegan, F., Hahn, M. and Bigdeli, B., 2009. Automatic road extraction from LIDAR data based on classifier fusion, IEEE, pp. 1-6.
Schickler, W. and Thorpe, A., 2001. Surface estimation based on LIDAR. In: Proceedings of the ASPRS Annual Conference, St. Louis, Missouri, pp. 23-27.
Shan, J. and Aparajithan, S., 2005. Urban DEM generation from raw lidar data. Photogrammetric Engineering & Remote Sensing, 71(2), pp. 217-226.
Shi, W., 1998. A generic statistical approach for modelling error of geometric features in GIS. International Journal of Geographical Information Science, 12(2), pp. 131-143.
Shi, W., 2009. Principles of modeling uncertainties in spatial data and spatial analyses. CRC Press, Boca Raton.
Shi, W., Fisher, P. and Goodchild, M.F., 2003. Spatial data quality. CRC Press, London.
Shi, W.Z., Zhu, C.Q. and Wang, Y., 2001. Road feature extraction from remotely sensed image: review and prospects. Acta geodaetica et cartographica sinica, 30(3), pp. 257-361.
Tian, Z., 2009. Research on Road Segmentation and Extraction's Algorithms of High-resolution Remote Sensing Images. Thesis, Xi'an University of Science and Technology, Xi'an, China.
Vosselman, G., 2000. Slope based filtering of laser altimetry data. International Archives of Photogrammetry and Remote Sensing, 33(B3/2; PART 3), pp. 935-942.
Wu, J., 2009. A method for detecting objects by fusing lidar data and images. Journal of Capital Normal University (Natural Science Edition), 4, pp. 003.
Zhan, Q., 2003. A hierarchical object-based approach for urban land-use classification from remote sensing data. Thesis, Wageningen University, Enschede, Netherlands.
Zhang, J. and Goodchild, M.F., 2002. Uncertainty in geographical information. CRC press, Boca Raton.