CHAPTER III
RESEARCH METHOD
This chapter describes the procedure used to answer the research questions in
chapter one. It covers research design of the study, data collection, and data analysis.
The data collection explained the process of how the data were gained, and
elaborated. While data analysis was justifying of how the data were analyzed in the
frame of the theories accounted in the previous chapter.
3.1 Research Design
This research was directed to employ quasi-experimental. Quasi experimental,
in this study, will be used to identify, test, observe and analyze the data. Johnson
(1999) states that quasi-experimental design is an adaptation of true experimental
design where one of three elements such as manipulation, randomization, and control
group is missing. Besides, Hatch and Farhady (1982) say that quasi-experimental
designs are practical compromise between true experimental and the nature of human
language behavior, which is used to investigate. Thus, it can be used to provide the
completeness of the elements of true experimental. The design of the study described
as follows:
Table 3.1
The Quasi-Experimental Design
Group Pre-test Treatment Post-test
Experimental Xa1 T Xa2
Where:
Xa1: Pre-test for experimental group
Xb1: Pre-test for control group
T: Treatment
O: Non-Edmodo treatment
Xa2: Post-test for experimental group
Xb2: Post-test for control group
From the table above, there were two groups of the students. Those were
experimental group and control group. The both of groups were given a pre-test in
order to know their competence before giving the treatment. The difference came
from the experimental group. This group was given a treatment of edmodo which is
the writing assignment during the learning and giving of feedback. However, the
control group did not use edmodo in terms of giving writing task or receiving
feedback. The control group used paper as a medium in case of doing the writing
assignment and receiving the feedback. After conducting the treatment to the
experimental group, both of the groups were given a post-test to see whether the
treatment works well or not.
3.2 Research Hypothesis
Hypothesis is a tentative statement about the outcome of the research (Hatch
& Farhady, 1982). In this study, there are two types of hypotheses, namely null
hypothesis and alternative hypothesis. The null hypothesis is accepted as there is no
significant difference between the score of students in the experimental and control
groups. Meanwhile, the alternative hypothesis is accepted when there is a significant
different from both groups. Therefore, according to Coolidge (2000) and Krander &
Moursund (1999), the null hypothesis and the alternative hypothesis for this study are
Ho = there is no significant difference between the students’ post test scores of the experimental group and the students’ post test scores of the control
group.
HA = there is significant difference between the students’ post test scores of
the experimental group and the students’ post test scores of the control group.
3.3 Research Site and Participants
This research was conducted in one of the Senior High Schools in Bandung.
The participants were from two different classes of tenth grade, which are for
experimental group and control group. According to Kothari (2004: 59) this kind of
sample is called as non-probability sampling since they are chosen by the researcher.
Besides, they were chosen since it was found out that the students had an awareness
of using technology and its application. In the research, all of the students from
experimental group were given edmodo technique as a form of assignment in English
class.
3.4 Data collection
In collecting the data, this study employed two techniques, those were
questionnaire and edmodo. Yildirim & Simsek (2008, cited in Çankaya, Durak &
Yünkül, 2013) state that using more than one data collection technique supports the
validity and reliability of the study. Each technique of data collection were described
below.
3.4.1 Research Instruments
Before applying the real instrument (questionnaire) to the real sample of
group, the value of validity and readability were sought first. In doing so, the
designed questionnaire consisting of the statements was tested to another class in
items of the questionnaire were selected to be a real questionnaire that was given to
the real sample of group in pre and post test. The purpose of the pretest was to
measure the students’ writing motivation before the treatment, and post test was used
to measure the students’ writing motivation after the treatment using edmodo.
Technique of data collection was described as follows:
3.4.2 Teaching Material
In this study, the teaching materials used are recount text about experience. It
is chosen because it was appropriate to the standard competence of syllabus released
by the National Education Ministry of grade X of Senior High School.
In conducting this, several preparations need to take into account. First is the
preparation of all the materials and teaching procedure that will be used. Second is
preparing the medium which is edmodo. Edmodo is prepared to be introduced and
used by the students.
Furthermore, all the teaching materials and the procedures are prepared in
experimental group that is completely related to the use of edmodo in teaching
recount text. However, in the control group, the conventional method is used where
the medium and the teacher feedback used is conducted through paper, not edmodo.
3.4.3 Questionnaire
This research used the questionnaire in the form of rating scales. Rating scales
questionnaire is very useful for the researcher for its effectiveness in building degree
of sensitivity of response which will generate numbers (Cohen et al, 2007, p.325).
The advantage in using questionnaire in the research was the respondents were free to
The purpose of the research in using questionnaire was to find out how the
edmodo can help motivate the students to write and how the students’ responses
towards the use of edmodo.
3.4.3.1 Pre Test and Post Test
Pre-test is one of the research instruments. It was implemented to firstly know
and find out the initial differences between experimental group and control group. It
was used to measure student’s capability before the treatment is given. Meanwhile
post-test will be used to find out the improvement of students’ motivation in writing
(Frankel and Wallen, 1993). The procedure of both instruments was actually the
same. Both the pre-test and post-test were questionnaire form and consisted of ten
items. The questionnaire was then distributed to experimental group only. It was
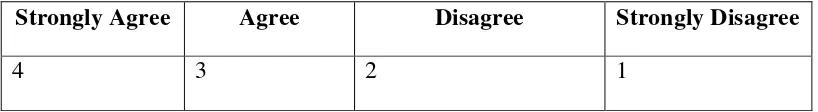
designed as close-ended questionnaire with four optional answers based on
Likert-Scale questionnaire, those are:
Table 3.2
The Likert-Scale in the Questionnaires
Strongly Agree Agree Disagree Strongly Disagree
4 3 2 1
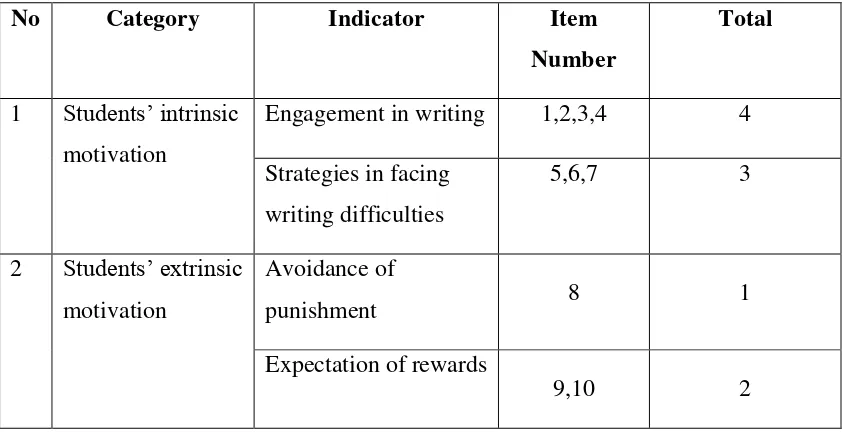
The questionnaire was aimed to gain specific data that were needed to analyze
the students’ writing motivation. The questionnaire was designed based on the
existing theoretical frameworks such as Self-Determination theory by Ryan and Deci
(1985), supported by Vallerand (et al., 1992, cited in Blais, 1995) namely dividing
motivation into two categories: intrinsic and extrinsic motivation.
The Framework of Students’ Writing Motivation Questionnaire
Engagement in writing 1,2,3,4 4
Strategies in facing
In addition, more another questionnaire was distributed to examine students’
responses to the use of edmodo as described below:
Table 3.4
The Aspects of Students’ Responses to the Edmodo Activity Questionnaire
2 Benefits from edmodo
activity
Students’ improvements on
writing skill 3 1
Students’ improvement on
self-expression 5 1
Students’ improvement on
critical thinking 6 1
Students’ improvement on self
-reflection 7,9 2
Students’ improvement on self
-confidence 8 1
Students’ improvement on
writing motivation 11 1
3.4.3.2 Research Procedure
This research conducted following research procedure as follows.
1. Administering the pilot questionnaire instrument
Cohen & Manion (1994) say that this kind of implementation aims to gain the
validity, level difficulty, discrimination, and reliability of the instrument. This
will be administered to different class, which is not the sample in this research. It
2. Administering pre test
The first questionnaire administered to the real sample will be
pre-questionnaire which is to find out the initial ability of the students (Freankel &
Waleen, 1993). The students will be required to fill in the first questionnaire
about their writing motivation.
3. Conducting the edmodotreatment to the experimental group
The step, first, is to introduce the edmodo to the students. The researcher will
lead the students into the understanding of the Edmodo by directly showing the
Edmodo application, give them a guide, introduced all the stuff in Edmodo, ask
them to create account in Edmodo, and explain the interface and function of
every single component in this learning platform. The researcher will ensure the
students will understand the use of Edmodo. The treatment will be conducted for
three weeks in a month. During the treatment of using Edmodo, students will be
told that they will start writing on edmodo as form of assignment. In doing the
task on edmodo, they will have to write in a form of minimum 200 words
compositions in recount text concerning their experience.
The treatment will be administered in two sections; those are first in a
classroom where the students are taught about the material by giving them
examples through edmodo. The second section is online teaching, which is they
have to access edmodo website to do their homework and submit it. The
treatment will be given by using blended learning approach. In the class students
will be taught first about recount text, more specifically about the generic
structure or organization of recount text. Then during the experiment, the
students will be asked to make three drafts until final draft. During the process of
doing the draft, the students will also be given feedback from the teacher in case
feedback to the students twice. In doing the drafts, the students will be asked to
make recount text related to their experience. They will be asked to submit or
post it on edmodo feature which is assignment feature, then teacher will check
whether the generic structure of their writing is correct or not. If there are some
mistakes on the generic structure, teacher will give indirect feedback by posting
it on “comment” feature so that the students can revise it again. Both teacher and
students will use those features. After they accept the teacher feedback, they have
to revise it as a second draft of their writing based on the feedback teacher gives.
Then for the second time, teacher re-checks their writing, focusing on the generic
structure and if there are still mistakes on it, teacher will give feedback again and
post it to the students’ account. Then students who accept it have to revise it
again as a final draft until it is appropriately correct. Then they have to resubmit
it again on edmodo for the last time.
4. Conducting treatment to the control group
The treatment that will be given to the control group is conventional
technique. The students in this group will use paper as the medium. They will
write the essay and receive the teacher feedback through paper only, not edmodo.
However, they will receive exact material like experimental group from the
teacher. After final draft, teacher will distribute the post test to the control group
to see and find out the difference of results between experimental group and
control group concerning their motivation in writing after using edmodo
treatment.
4. Administering Post-test
After the students finish using edmodo, they also have to fill in the same
questionnaire as the first one, which will be distributed to find out their
5. Distributing Response Questionnaire
The response questionnaire in this study will only be given to the
experimental group. It aims to find out the responses of the students toward the
implementation of Edmodo in enhancing students’ motivation in writing.
Purposely, this questionnaire is used to answer the third research question of the
study.
3.5 Data Analysis
3.5.1 Reliability
Reliability is the extent that a test is produced in constant result when
administered under similar condition (Hatch & Farhady, 1982). The formula that was
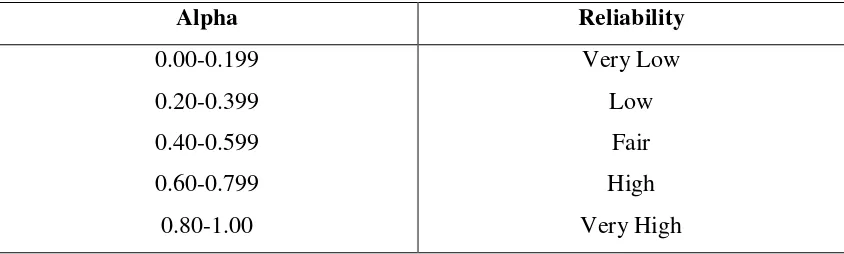
used to measure the reliabilty is Cronbach’s formula in SPSS 20.00 for windows. The
result was interpreted by using the following criteria :
Table 3.5
r Coefficient Correlation
Alpha Reliability
0.00-0.199
0.20-0.399
0.40-0.599
0.60-0.799
0.80-1.00
Very Low
Low
Fair
High
Very High
3.5.2.1 The Normal Distribution Test
Pre-test was administered in the very beginning of the study before the
treatment is given to the experimental group. This test was applied to both of the
group. In order to investigate the normal distribution of thhe set of data, the
Kolmogrov-Smirnov test was employed. Therefore, this test is appropriate to be used
because the sample of this research took two classes of tenth grade students where
each of the class has 25 students. The test employed SPSS 20 for windows.
There were several steps in using Kolmogrov-Smirnov test. The first step was
stating the hypothesis and setting the alpha level. The second was analyzing the
groups’ scores by employing Kolmogrov-Smirnov through SPSS 20 for windows.
In the first step, 0.05 (two-tailed) is set as the alpha level. Thus, hypotheses
are as follow:
Ho = the score of the experimental and control groups are normally
distributed
HA = the score of the experimental and the control groups are not normally
distributed.
Finally, the data were analyzed by using Kolmogrov-Smirnov through SPSS 20
for windows. The output data were interpreted by these ways: If Asymp.sig > 0.05,
the null hypothesis is accepted. Meaning that data distribution is normal. If
Asymp.sig <0.05, the hypothesis is rejected, meaning the data is not normal (Field,
2005).
3.5.2.2 Homogeneity of Variance Test
The formula that was used to in this test is called Levena’s formula in SPSS
Stating the Hypothesis and setting the alpha level at 0.05
H0 = the variance of experimental and control groups are homogenous.
H1 = the variance of experimental and control groups are not homogenous
Analyzing the variance homogeneity by using SPSS 20.00 for windows
Comparing the significant value with significant level for testing the hypothesis. If
Levine’s test is significant at p ≤ .05, it can be concluded that the variances are significantly different. If Levine’s test is significant at p>.05 means that the
variances are approximately equal (Field, 2005).
3.5.2.3 The Independent t-Test
Hatch & Farhady (1982:155) said that independent t-test was applied to
investigate the significant differences between the means of the two groups. Coolidge
(2000:143) stated that there are several requirements for conducting t-test; first, the
data should be measured in form of interval or ratio. Second, the data should be
homogenous. Third, the data should have normal distribution. The procedures of the
analysis can be seen as follow:
Stating the Hypothesis and setting the alpha level at 0.05 (two-tailed test)
H0 = there is no difference of pre-test and post-test between both of groups
H1 = there is significant difference of pre-test and post-test between both of
groups
Calculating the t value by using independent sample test computation in SPSS
20.00 for windows.
Comparing tobt and tcrit at p=0.05 and df*= 58 to examine the hypothesis. If tobt>
tcrit means that the hypothesis is rejected, meaning that there is significant
that the hypothesis is accepted, meaning that there is no significant difference of
means between experimental and control group (Coolidge, 2000).
3.5.2.4 The Dependent t-test
Hatch and Farhady (1982) stated that the pre-test and post-test score were analyzed
by using dependent t-test to investigate whether the difference of the pre-test and
post-test is significant or not. Look at the following procedures:
Stating the Hypothesis and setting the alpha level at 0.05 (two-tailed test)
H0 = there is no significant difference of pre-test and post-test score
H1 = there is significant difference of pre-test and post-test score
Calculating the t value by using dependent sample test computation in SPSS
20.00 for windows.
Comparing tobt and tcrit at p=0.05 and df*= 29 to examine the hypothesis. If
tobt> tcrit means that the hypothesis is rejected, meaning that there is significant
difference of means between experimental and control group. If tobt< tcrit means
that the hypothesis is accepted, meaning that there is no significant difference of
means between experimental and control group (Coolidge, 2000)
3.5.2.5 The Calculation of Effect Size
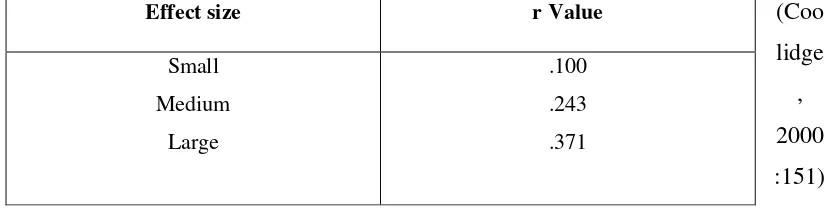
Coolidge (2000) said that it is important to administer the calculation of effect
in order to determine the effect of the influence of independent variable upon the
dependent variable. If the treatment works well, there will be a large effect. The
formula and the steps for calculating the effect size could be seen as follow:
√
r: Effect size
t: tobt or tcrit value from the calculation of independent t-test
df: N1+N2-2
After the r was round, the score was interpreted by using the following table:
Table 3.6
3.5.3 Data Analysis on Students’ Responses
The data obtained from questionnaire became meaningless until it is
classified, organized and interpreted (Alwasilah, 2000). The data from questionnaire
were used as quantitative data.
The data gained from the pre- and post- treatment questionnaire were
tabulated and presented through some stages, as follows:
1. Examining the data gained from the questionnaire
2. Selecting and classifying the data derived from the questionnaire into categories to
simplify the tabulation and interpretation
3. The calculation for the data will be measured by using the following formula:
Where:
P = Number of percentage
F = Frequency of strategies or procedures
N = Number of whole samples
The data analyzed from questionnaire showed the actual use of Edmodo in
enhancing students’ writing motivation. The data of either students’ writing
motivation or responses questionnaire were interpreted through descriptive
explanation. The data from this source is expected to bring about general themes
found in this research. The result of this analysis was then discussed in chapter 4 of
this research.
3.6 Concluding Remark
This chapter has presented the research method of the study. This chapter has
covered research design, research site and participants, research hypothesis, data
collection, research procedure, data analysis, and the clarification of terms. This
research aims to investigate the use of Edmodo in motivating students’ writing