CHAPTER III
RESEARCH METHODOLOGY
This chapter presents a discussion on the methodology employed in conducting this research. The description and account below involve; research design, research subject, research instrument, research procedures, and data analysis.
3.1 Research Design
This research deals with improving students’ speaking skill using picture
series in communicating in English since it is often considering being one of some difficult aspects of language learning for the teacher to help the students with their difficulties.
In conducting the research, the writer applied quantitative research design as the research methodology. Quantitative method is a method that is dealing with statistical analysis of the data in the form of scores and numbers (Creswell, 2012, p. 19). Furthermore, this research is used quantitative experimental design which is analyzed by using t-test. The data is taken in 2 groups to identify the differences of using experimental group and control group. It is assessed by two teachers. According to Creswell (2012, p.295), experiment is testing an idea to determine whether it influences an outcomes or dependent variables. Whereas, the independent variable of this research was retelling story through picture series and
the dependent variable of this research was improvement of students’ speaking
M O1
X O2 MO1 C O2
Where: M: Matched subject
O1 : Students’ speaking score in pretest O2 : Students’ speaking score in posttest X : Treatment using picture series in retelling story
C : No treatment
(Adopted from Fraenkel et al, 2012, p.275)
3.1.1 Variables
According to Fraenkel et al (2012, p.77), variables can be classified in two ways, quantitative variables and categorical variables. In this research, the variable dealt with quantitative method. It was because the research used experimental research. In addition, Creswell (2012) states that variable can be measured by researchers who have different values among different individuals or organizations (p. 112). It is divided into two variables, independent variables and dependent variables (Fraenkel et al, 2012, p. 80). According to those explanations, this research classified the variables into dependent and independent variables as follows:
a. The independent variable
The independent variable is variable of the study which researchers choose to assess the possible affects one or more than one variable (Fraenkel et al, 2012, p.80). The independent variable of this research used picture series. b. The dependent variable
The dependent variable is variable which researchers observe to determine the effect of the independent variables presumed (Fraenkel et al, 2012, p.80), and the dependent variable of this research was the improvement
3.1.2 Research Hypotheses
Considering the problem mentioned above, the hypotheses were made related to this subject. As this research used quantitative method, the hypotheses were aimed at answering research question temporarily. The research that formulates hypothesis is the research in which use quantitative method, it is the prediction about what researcher expects to find (Creswell, 2012, p.125). In line with this, Fraenkel et al (2012) simply adds that hypothesis is the prediction about the possible outcomes of the research (p. 83).
The hypotheses formulated in the research are:
Ho : There is no significant difference between students speaking score in retelling story through picture series and retelling story through one sample picture: it means the technique is not effective to improve
students’ speaking skill.
H1 : There is significant difference between students speaking score between
retelling story through picture series and retelling story through one
sample picture: it means the technique is effective to improve students’
speaking skill.
3.2 Research Subject
3.2.1 Populations
Fraenkel, J. R. et al (2012, p. 92) explain that,
In educational research, the population of interest is usually a group of persons (students, teachers, or other individuals) who possess certain characteristics. In some cases, however, the population may be defined as a group of classrooms, schools, or even facilities.
(p.142). Considering about these explanation, the population of this research was the eight grade students of junior high school in Bandung. Based on curriculum 2006, narrative text is taught in the eight grade of junior high school.
3.2.2 Samples
Fraenkelet al (2012, p. 91) describes sample as the small group of the population on the research. In line with Cresswel (2012), he adds that sample is subgroup of the target population and selected from the individuals who represent the whole population that the researcher place to study for generalizing the target population (p. 142).
Based on the explanation above, this research took two classes as the sample population. The first class was the experimental group and the second class was the control group. A sample is a part of the population from which it was drawn (From http://www.audiencedialogue.net/kya2a.html), it is based on the sampling, which involves getting information from only some members of the population. Each class consisted of 35 students and the researcher took only 20 students as the sample.
3.3 Research Instrument
In this research, some instruments were used to collect the data. According to Fraenkel et al (2012, p.111), the whole process of preparing to collect data is called instrument. It means that some device such as paper and pictures can be used as instrument. Therefore, the instrument used in this research was picture series. Picture series was used as the instrument to helped students in retelling story.
series and the control group was given the treatment by retelling story using one sample picture. At the beginning the students were given the pre-test to measure their initial ability in speaking. After that, the students in control group got a sample picture in retelling story, while experimental group got picture series in retelling story.
3.4 Research Procedures
3.4.1 Preparing the Lesson Plan
The lesson plan was designed to be implemented during treatment session. It was designed for five meetings. The second and the last meeting were allocated to conduct the pre-test and post-test, while the other meetings were allocated to implement the treatment by using picture series in retelling story.
3.4.2 Conducting the Pilot Test
Pilot test was conducted to find out the use of the instrument. In this research, pilot test was conducted to the students in another class. The class got the same instruction as the control group. There were 10 students as the sample population.
.
3.4.3 Conducting the Pre-test
Pretest was administered to the experimental and the control groups in the beginning of the research before giving the treatment. This activity was conducted
to measure students’ speaking skill using one picture in retelling story and to see
3.4.4 Treatment
According to Cresswell (2012), “in an experiment, the researcher
physically manipulates with interventions in one or more condition so that individuals experience something different in the experimental conditions than in
the control conditions” (p.301). The treatment was conducted to the experimental
group after the pre-test done. For the control group, students got one picture in order to know the story, and then the teacher told the story while the students listened. In the end, students were supposed to retell the story based on their knowledge they got already. Nevertheless, for the experimental group, the teacher used picture series to toldthe story, and then students could retell the story based on what they had listened and what the picture series explained.
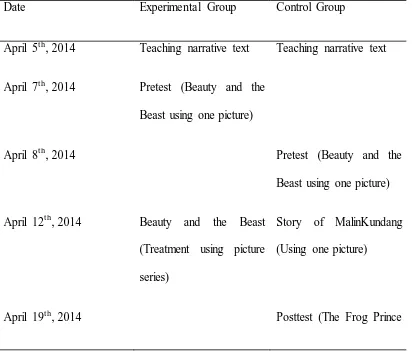
Table 3.1 Time Schedule of the research
Date Experimental Group Control Group
April 5th, 2014 Teaching narrative text Teaching narrative text
April 7th, 2014 Pretest (Beauty and the Beast using one picture)
April 8th, 2014 Pretest (Beauty and the
Beast using one picture)
April 12th, 2014 Beauty and the Beast (Treatment using picture series)
Story of MalinKundang (Using one picture)
using one picture)
April 21st, 2014 Story of MalinKundang (Treatment using picture series)
April 22nd, Posttest (The Frog Prince using picture series)
3.4.5 Conducting Post-test
Post-test was conducted after the whole treatments that the teacher gave to students were finished. The purpose of the post-test was to find out whether or not
retelling story through picture series could improve students’ speaking skill by
comparing two groups (experimental and control groups). In addition, there were 20 students in each group and the same students that already get the test in pretest as the sample to find out the result of posttest.
3.5 Data Analysis
The data were analyzed using quantitative analysis. In other words, the data analysis was conducted to interpret data from the test and post-test: the pre-test purposed to measure the initial score of speaking ability, and the post-pre-test
grammar, vocabulary, fluency, and comprehension. Meanwhile the tests were assessed by two teachers. Second, the score were calculated by applying the statistical analysis of t-test to examine the differences of pre-test and post-test from both control and experimental groups. In addition, the significance of the test was analyzed by using computer programmed of Statistical Product and Service Solution (SPSS) 20.
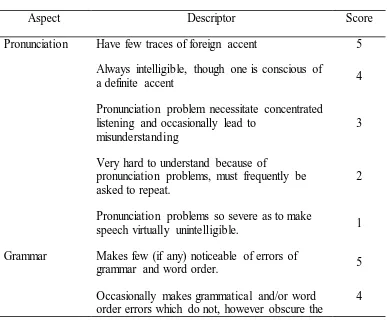
3.5.1 Scoring Technique
The scoring system, according to Haris (testing English as a second language, 1969, cited from Rizqon, 2011),represents about some criteria of speaking score. They are pronunciation, grammar, vocabulary, fluency, and comprehension. It can be described as follows:
Table 3.2 Scoring system of speaking test
Aspect Descriptor Score
Pronunciation Have few traces of foreign accent 5 Always intelligible, though one is conscious of
a definite accent 4
Pronunciation problem necessitate concentrated listening and occasionally lead to
misunderstanding
3
Very hard to understand because of
pronunciation problems, must frequently be asked to repeat.
2
Pronunciation problems so severe as to make
speech virtually unintelligible. 1
Grammar Makes few (if any) noticeable of errors of
grammar and word order. 5
Occasionally makes grammatical and/or word order errors which do not, however obscure the
meaning.
Make frequent errors of grammar and word
order which occasionally obscure meaning. 3 Grammar and word order errors make
comprehension difficult. Must often rephrase sentences and/or restrict him self to basic patterns.
2
Errors in grammar and word order so severe as
to make speech virtually unintelligible. 1 Vocabulary Use vocabulary and idioms to virtually that of
native speaker. 5
Sometime uses inappropriate terms and/or must
rephrase the idea because of lexical inadequate. 4 Frequently uses the wrong words; conversation
somewhat limited because of inadequate vocabulary.
3
Misuse of word and very limited vocabulary
make comprehension quite difficult 2 Vocabulary limitation so extreme as to make
conversation virtually impossible 1
Fluency Speed as fluent and effortless as that of native
speaker. 5
Speed of the speech seems to be slightly
affected by language problems. 4
Speed and fluency are rather strongly affected
by language problems. 3
Usually hesitant; often forced into silent by
language limitations. 2
Speech is so halting and fragmentary as to
make conversation virtually impossible. 1 Comprehension Appears to understand everything without
Understand nearly everything at normal speed, although occasional repetition may be
necessary.
4
Understand most of what is said at slower than
normal speed with repetition. 3
Has great difficulty following what is said. Can
comprehend only “social conversation” spoken
slowly with frequently repetition
2
Can not be said to understand even simple
conversation virtually impossible. 1 (Adopted from Haris, 1969, cited in Rizqon, 2011)
3.5.2 PilotTest Data Analysis
The test which was given before conducting pre-test was called pilot test. This test was conducted to find out the use of the instrument. The pilot test was administered to the same grade out of the sample in this research. Moreover, speaking performance test was the instrument in this research. This test was administered to call VIIIC to find out whether the instrument of this study was valid and reliable or not. This test was conducted on April 5th, 2014. If the students were able to complete the test and could retell the story based on the instruction, then it could be concluded that the instrument could be used as pre-test and post-pre-test.
3.5.3 Pre-test and Post-test Data Analysis
The same instruction of the pre-test and post-test were given to the experimental and control groups. The difference was using one picture and picture
series. In this research, the alpha setting was started at the level 0.05 (α = 0.05).
The data collected from the pre-test and post-test was computed using IBM SPSS Statistics 20 for Windows. The result was to examine the use of retelling story
through picture series in improving students’ speaking skill.
3.5.4 Normality of Distribution Test
Normality distribution test was calculated in order to investigate whether or not the distribution of pre-test scores in groups was normally distributed. Because the samples are 20 students, Kolmogorov-Smirnov test formula in IBM SPSS Statistics 20 for Windows was used to find out normality distribution.
1. Stating the hypothesis and setting the alpha level at 0.05 (two tailed). H0 = The scores of the experimental group and control group are normally
distributed.
H1 = The scores of the experimental group and control group are not
normally distributed.
2. Analyzing the normality distribution using Kolmogorov-Smirnov test formula in IBM SPSS Statistics 20 for Windows.
3. Comparing the Asymp Sig. (probability) with the level of significance to test the hypothesis. If the Asymp Sig. is more than the level of significance (0.05), the null hypothesis is accepted, so the test normally distributed.
3.5.5 Variance Homogeneity Test
Variance homogeneity was conducted to examine whether or not the scores of the research was homogeneous. The statistical calculation of variance
Levene’s test formula in IBM SPSS Statistics 20 for Windows was used. The
steps were:
H0 = The variance of the experimental group and control group are
homogeneous.
H1 = The variance of the experimental group and control group are not
homogeneous.
2. Analyzing the normality distribution using Levene’s test formula in IBM SPSS Statistics 20 for Windows.
3. Comparing the Asymp Sig. (probability) with the level of significance to test the hypothesis. If the Asymp Sig. is more than the level of significance (0.05), the null hypothesis is accepted, so the variance of the groups is homogeneous.
3.5.6 Independent t Test
After collecting the data, the research was analyzed by using statistical analysis. According to Kranzler and Moursund (1999, p.91), they state that to differentiate whether the students in control group and experimental group is significant or not, the formula of the data was used independent t-test. In this research, to calculate the data, it was measured by using IBM SPSS Statistics 20 for Windows as follows:
1. Stating the hypothesis and setting the alpha level at 0.05 (two tailed). H0 = There is no significant difference between experimental groups’
scores and control groups’ scores.
H1 = There is significant difference between experimental groups’ scores and control groups’ scores.
2. Analyzing the t test score using IBM SPSS Statistics 20 for Windows. 3. Comparing t-obtained and t-critical. If t-obtained > t-critical, it means
3.5.7 Paired Sample t Test
Paired t-test was used to find tout he differences between pretest on posttest in experimental and control groups. In this research, the paired sample t-test was analyzed using computation IBM SPSS statistics 20. The steps are as follows:
1. Stating the hypothesis and setting alpha level at 0.05 (two tailed)
H0 = There is no significant difference between students’ speaking
score in pretest and posttest.
H1 = There is significant difference between students’ speaking score
in pretest and posttest.
2. Analyzing the t test score using IBM SPSS Statistics 20 for Windows. 3. Comparing t-obtained and t-critical. If t-obtained > t-critical, it means