CHAPTER 3
RESEARCH METHODOLOGY
This chapter elaborates the method employed for the research and it covers the
research design, the statement of the problems, the participants, the research
procedures, the research instruments and the data analysis.
3.1Statement of the Problems
The study is aimed to answer the following formulated questions:
1. How much will the implementation of personalised learning help
students to improve their listening ability?
2. What are students‟ perceptions of the implementation of personalised
learning?
3. How is personalised learning implemented in teaching listening skills?
3.2Research Design
To answer the questions in this study, the researcher chose to employ a
method that was commonly called as mixed method. Mixed method is a
method that mixes both qualitative and quantitative method in one study
(Creswell, 2003). It focuses on research questions that call for real-life
contextual understandings, multi-level perspectives, and cultural influences
(Creswell, Klassen, Clark & Smith, 2011).
Mixed method needs to be used when the problems in the study fit with
the method itself, when a qualitative or a quantitative study only will not
suitable enough for answering the problems (Creswell et al., 2011). This
method allows the researcher to choose the methods that are best suited for the
study (Kumar, 2014). Moreover he adds, when a study uses two different
quantitative or qualitative methods, it can be said to be using a mixed method
method approach, the research does not necessarily need to employ both
qualitative and quantitative method at the same time. Because using multiple
methods for data collection will qualify a study to be classified as mixed
methods (Kumar, 2014).
This study was conducted to find out how personalised learning is
implemented in the classroom, the students‟ perspectives towards it, as well as
if it could help students improve their listening skill. Clearly, this study had
three questions that comprised of two questions that needed to be analysed
qualitatively, and one question which should be answered by using numbers
and statistical methods, where a pre-test and a post-test would be given to the
participants. Thus a mixed method study was chosen to solve the questions.
Moreover, this method was chosen because the researcher would have more
freedom in choosing what instruments that she needed to use to answer the
questions.
Many limitations made a true experimental research design difficult if not
impossible to be arranged. Kowalczyk (n.d) explained that in a true
experimental research, the researcher needed to assign people in a random
group and everyone had the same chance to be in the experimental group.
Hatch and Farhady (1982) agrees to Kowalczyk‟s statement by saying that in
a true experimental research, the students are randomly selected and assigned
to either the control group or experimental group. Meanwhile in a
quasi-experimental study, people will not be assigned randomly. They further add
that since in a research we are also dealing with the most complex human‟s
nature, quasi experimental designs are practical compromises between true
experimental designs and the nature of human behaviour.
There are also some things that make the researcher cannot assign people
randomly to the groups. For example when we want to ask the director of
courses to assign students to different groups for the benefit of our research
(Hatch & Farhady, 1982). Thinking of several aspects, such as the fact that
the participants had already belonged to a certain class and the limited time
quasi-experimental research design with a pre-test, a post-test and a control group to
be employed for the study (Hatch & Farhady, 1982).
Two groups were involved in this study which one was assigned to be the
control group and the other one was chosen to be the experimental group.
First, both groups were given a listening test to check if their English initial
proficiency was equal or nearly equal. After the pre-test was conducted, the
experimental group was given a series of treatments of personalised learning
before a post-test was finally conducted. The control group, on the other hand,
was only given some lessons without special treatments as what the
experimental group had.
The following represented the design of the study:
notes A1 : Students‟ score in listening pre-test
A2 : Students‟ score in listening post-test
X : Treatments
3.3Population and Sample
This study was conducted at a university in Bandung. Two classes of first
year English students were taken as population. Each class consisted of about
25 students or about 50 students in total, but only 48 were taken as samples to
anticipate students‟ absence. First year students were taken as samples
because they were considered to have just received listening exercises to
prepare them for the national examination (UN) from their previous English
teacher in 12th grade.
3.4Data Collection
3.4.1 Research Instruments
The instruments used to collect the data for this study were questionnaires,
a post-test, a pre-test and written documents (video transcriptions, field
notes, and students‟ PLPs). Those instruments were aimed to help the researcher to collect the data needed during the study.
The following were the instruments of this study.
a. Pre-test and post-test
The pre-test and post-test were conducted to measure students‟
initial listening skill in both control group and experimental group if
they are equal or nearly equal and the students‟ skills after treatments.
While the treatments were only given to the experimental group in
order to find out if the implementation of personalised learning could
make any difference to students‟ listening score in the post-test.
b. Questionnaire
The questionnaire was given to both the control group and the
experimental group after all of the treatments were done. The aim of
the questionnaire was to know students‟ opinions towards
personalised learning.
The distributed questionnaire was using close-ended questions.
This was chosen because it was easier for the students to answer than
if open-ended questions were used. The questionnaire had 14
questions and based on the framework DfES has proposed in 2004.
Table 3.1
Questionnaire Framework
NO MAIN POINTS NUMBER OF
STATEMENTS TOTAL
1 Assessment for Learning
(AfL). 1-8 7
2 Effective teaching and
learning. 9-14 7
TOTAL QUESTIONS 14
A Likert Scale was used to score the questionnaire. However
instead of providing five different answers, this scale only provided
four different responses for each statement. The “uncertain” response
was eliminated to avoid students from choosing neutral responses.
Thus, there were only four responses: strongly agree (SA), agree (A),
disagree (D), and strongly disagree (SD) in the questionnaire.
c. Written Documents
The written documents (video transcriptions, field notes, and
students‟ PLPs) were used to gather data to answer the research
questions. Videos from in all of the meetings were taped,
transcribed and then analysed. The video tapings were done to
record the natural interaction in the classroom which lasted for
about 90 minutes for each meeting. The video taping itself were
done five times in each class during the study.
In this study, a classroom observation was used to collect the
data related to the implementation steps of personalised learning in
the classroom. An observer would be present at the time the
researcher was implementing the method. The observer was there
to help the researcher to observe the classroom. The one who
observed the students‟ learning process was given some briefings about the method to make sure that the observer understood
personalised learning better. Since the researcher was not involved
at all in the observational process, the type of observation done was
a non-participant observation.
The non-participant observation is the process of enabling the
researcher to stay as an outsider and let the researcher watch the
natural interaction as well as describing the practices of the
everyday life (Fitzpatrick & Boulton, 1994). The reason why the
neutrality and objectivity of the interaction and judgement
(Choudhury, n.d) and to avoid what was called as the Hawthrone
effect.
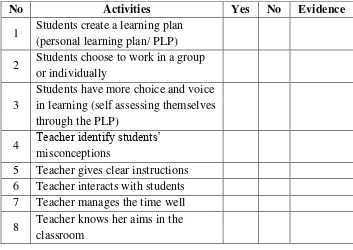
The following checklist was used as a guideline for the teacher
when she was doing the classroom observation.
Table 3.2
Observation Checklist Guidelines
Adapted from Coe, et.al (2014), Bray and McClaskey (2015)
The classroom observation guideline itself was adapted from
Bray and McClaskey (2015) and Coe, et.al (2014). Mainly, the
observed activities in the classroom were related to students and
teacher‟s activities when personalised learning was implemented
during the lesson. These field notes were described and narrated
later in the research findings.
No Activities Yes No Evidence
1 Students create a learning plan (personal learning plan/ PLP)
2 Students choose to work in a group or individually
3
Students have more choice and voice in learning (self assessing themselves through the PLP)
4 Teacher identify students‟ misconceptions
5 Teacher gives clear instructions 6 Teacher interacts with students 7 Teacher manages the time well
3.4.1 Research Procedure
The research procedures included administering pre-test and post-test,
conducting treatments, and distributing questionnaires. After all of the
steps were done, the collected data were analysed and described for a
further explanation.
3.4.1.1Administering a pre-test
A pre-test was administered to find out the students‟ initial listening
ability. It was given at the first meeting before any treatments were done.
The students were asked to listen to a recording played by the teacher and
answer a couple of questions based on the video. The recording was a
compilation of six different recordings which was played only twice
during the pre-test.
3.4.1.2Conducting treatments
During the treatments, the researcher acted as the teacher. Before the
teacher did the first treatment, the teacher was instructed to give the
students materials related to recount text by the real lecturer. In order to
meet this, the teacher sorted and chose some videos about past events,
such as videos about holiday and „draw my life‟ of popular artists. The next thing the teacher did was uploading the videos to an online storage so
the students may choose and download the videos that they want to use in
the first meeting. To deal with some students who had no internet at home,
the teacher had given the videos to the chairman of the class so he could
distribute the videos to his classmates as well as putting all of the videos
into a flash disk.
Firstly, in the first meeting, the teacher gave the students a personal
learning plan (PLP) sheet. In the PLP sheet, the students could write the
difficulties they had as well as their plans to solve the problems. After that,
the teacher asked the students to think of the difficulties they usually had
when they were doing a listening exercise. The teacher also gave them
speech speed and background noises. Next, the teacher asked the students
to write down their own difficulties in their own personal learning plan
sheet as well as their plans to solve them. Then, the students were
instructed to watch a video that they had chosen before while anticipating
the difficulties they usually had and doing an exercise based on the video.
Most of the students used their own phone, laptop or tablet to play the
videos. Some of them also shared their devices with their friends so
everyone could watch the video in the classroom.
In the next meetings, the students were mostly still instructed to do the
same thing as in the first meeting. They were also always reminded to do
their plans whenever or wherever they like.
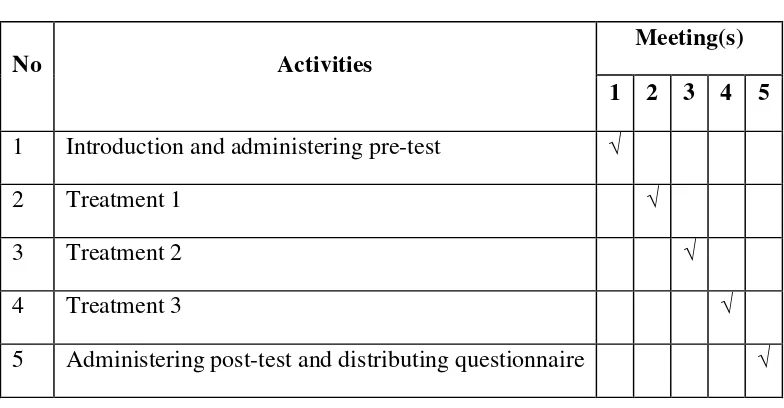
The following table shows the research timetable for this study.
Table 3.3
The Research Timetable
No Activities
Meeting(s)
1 2 3 4 5
1 Introduction and administering pre-test √
2 Treatment 1 √
3 Treatment 2 √
4 Treatment 3 √
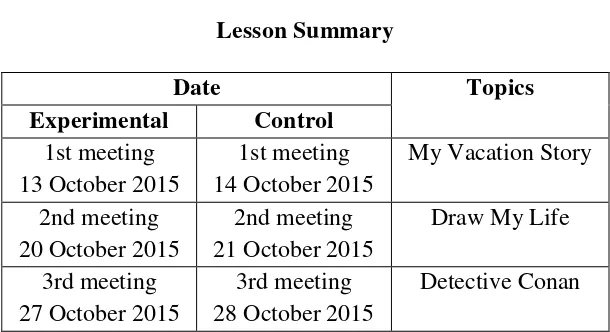
The following is the summary of the topics given in both classes during
The aim of this was to evaluate students‟ listening ability after they
were given the treatments. The post test was conducted after all of the
treatments were given. The form of the post-test was similar to the one
conducted in the pre-test. The students were asked to listen to a
compilation of six different recordings and answer 30 multiple choice
questions. The recording was only played twice and the post-test scores
would not only be a part of the researcher‟s data but also would be used as
their middle test scores.
3.4.1.4Distributing questionnaire
Distributing the questionnaire was aimed to discover students‟
perceptions of personalised learning. The questionnaire was given right
after the post-test was done in both classes. The questionnaire was written
in Indonesian to make the students easier when they are giving their
opinion for each statement. The questionnaire itself had 14 statements and
the students only had to put a check in one of the boxes according to their
3.4.2 Data Analysis
Pre-test and post-test results were the main instruments to collect
the quantitative data. These data were analysed using SPSS application for
Windows 7 and presented in the form of a graph. The data gained from the
questionnaire were analysed using SPSS 19.0 as well.
The gathered pre-test and post-test data would be analysed using
either parametric or non parametric test. The data showed normal
distribution, thus a parametric test would be used.
Meanwhile the questionnaire and written documents were used to
gather the data related to the qualitative part of this research. Alwasilah
(2000) explained that to interpret the raw data, the data were analyzed in
three steps: coding, categorization, and interpreting the data. Thus, the data
gathered from the questionnaire and written documents were presented in
the form of descriptive explanation to fulfil this requirement.
3.4.2.1Homogeneity of Variance Test
When the pre-test and post-test results were collected, the
homogeneity of variance needed to be tested. This was tested by using
Levene Test Formula in SPSS 19.0. The procedures were as follows.
Firstly, the researcher stated the hypothesis between the two groups
where Ho meant the data between both of the group were homogenous.
Secondly, the homogeneity of the data were calculated using a Levene‟s
test. Lastly, the probability (Asymp. Sig) for testing the hypothesis were
compared. If the significance value exceeds the level of significance which
was 0.05, the findings, then Ho would be accepted. However, Ho would be
3.4.2.2Normality Distribution Test
The aim of this test was to measure the normality of score
distribution of pre-test and post-test. Kolgomorov-Smirnov‟s statistic
calculation was used to test the normality as explained below.
First, the hypothesis was set, where Ho means the normal
distribution between the experimental and the control group and the level
of significance was also set at 0.05. Next, the data distribution was
analysed using a Kolgomorov-Smirnov test. After that, the data were
compared. If the probability was greater than 0.05, then the null
hypotheses were accepted. However if the probability was less than 0.05
then the null hypotheses were rejected.
3.4.2.3Independent T-test
An independent t-test was used to find out the differences between
the pre-test and the post-test scores. The test itself was calculated by using
SPSS 19.0 for windows. The steps for conducting the test were as follows.
First, the hypothesis was set. For this test, the hypothesis was Ho:
there is no significance difference between the pre-test and post-test scores.
Next, the significance level was set at 0,05 and then the data were
3.4.2.4Effect Size
Effect size was calculated manually to see how far the treatments
could make any difference between both classes, especially about how far
they could impact the experimental group‟s scores. The larger the value of
the effect size, the better the impact of the treatments were. The formula
that was used to count it was
√ notes : r = effect size
t = the obtained t from the t-test
df = degree of freedom [(N1+N2) – 2]
The following table gives a better explanation of effect size
categorisation based on Coolidge (2012).
Table 3.5
Effect Size Classifications
Effect Size r Value
Small 0,100
Medium 0,243
Large 0,371
Based on Coolidge (2012)
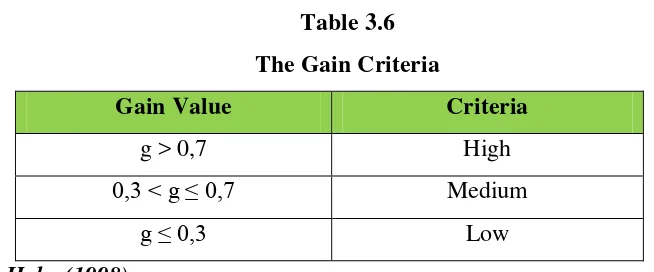
3.4.2.5Gain Test
As the name, gain test is used to see how much gain the students
get after a treatment was conducted. It is used to have a rough analysis of
the effectiveness of course in promoting a conceptual understanding (Hake,
1998). A gain test can be calculated by using the following formula.
Note : G = post-test score – pre-test score
Table 3.6
The Gain Criteria
Gain Value Criteria
g > 0,7 High
0,3 < g ≤ 0,7 Medium
g ≤ 0,3 Low
Hake (1998)
3.4.2.6Analysis of Written Documents
The analysis of the written documents was needed to achieve a
deeper understanding of this study. Moreover, the data gained from this
instrument could support some of the findings for this study.
Additionally, the students‟ personal learning plans, the teacher‟s
field notes and video recordings were also analysed to give the researcher
an evaluation of the implementation of the research. The transcribed
videos were marked and compared to teacher‟s notes. The teacher‟s talk was marked as T, while student‟s talk was signed as S.
The data gathered from these instruments are very beneficial to
help the researcher to elaborate the findings of this study and this could
benefit the researcher when writing the next chapter of this study.
3.4.2.6 Analysis of Classroom Observation
The data were gained from the recorded videos. The recorded
videos were transcribed and labelled T for teacher talk and S for students
talk. The videos were very beneficial for the researcher to find out more
about the students‟ and teacher‟s behaviour during the sessions. They
would be played again as well to be compared to the teacher‟s observation