• Tidak ada hasil yang ditemukan

Directory UMM :Data Elmu:jurnal:E:Environmental and Experimental Botany:Vol44.Issue2.Oct2000:

N/A
N/A
Protected

Academic year: 2017

Membagikan "Directory UMM :Data Elmu:jurnal:E:Environmental and Experimental Botany:Vol44.Issue2.Oct2000:"

Copied!
3
0
0

Teks penuh

(1)

Environmental and Experimental Botany 44 (2000) 165 – 167

Erratum

Erratum to ‘Diversity of cell lengths in terminal portions of

roots: implications to cell proliferation’

[Environ. Exp. Bot. 43 (2000) 239 – 251]

Lance S. Evans

Laboratory of Plant Morphology

,

Biological Sciences Research Laboratories

,

Manhattan College

,

The Bronx

,

New York

,

NY

10471

,

USA

Received 12 July 2000

www.elsevier.com/locate/envexpbot

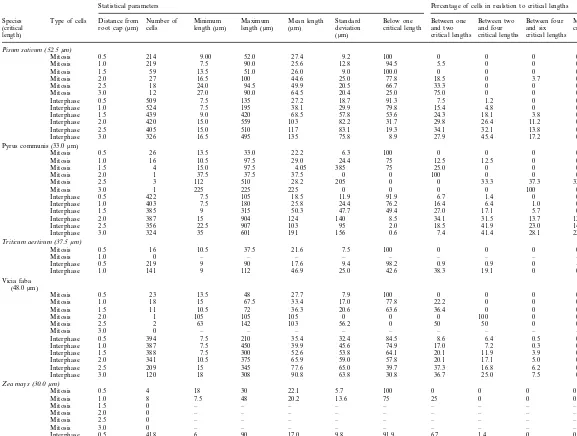
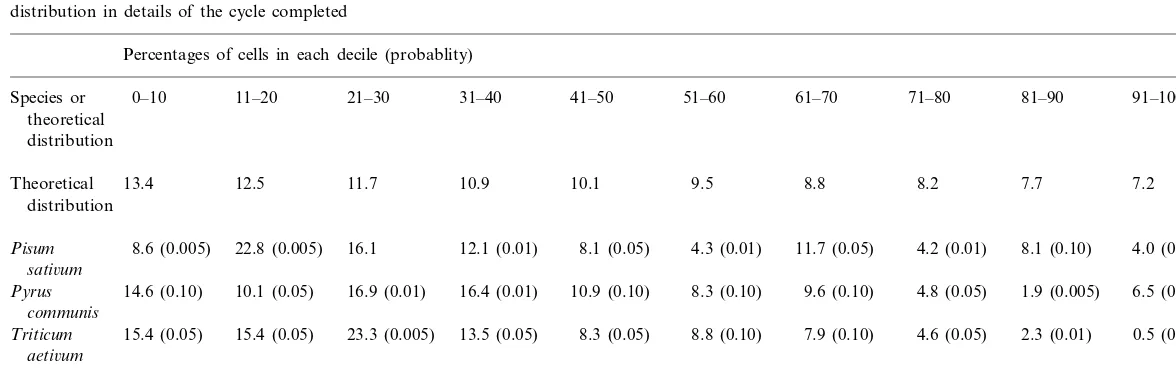
The publisher regrets that an error occurred in Table 1 and Table 2 of the above paper. The correct

tables appear overleaf.

.

PII of original article: S 0 0 9 8 - 8 4 7 2 ( 0 0 ) 0 0 0 4 6 - 0.

E

-

mail address

:

levans@manhatten.edu (L.S. Evans).

(2)

Erratum

166

Table 1

Cell length characteristics in various segments in roots of five plant species

Statistical parameters Percentage of cells in realstion to critical lengths

Type of cells Distance from Number of Minimum Maximum Mean length Standard Below one Between one Between two Between four More than six Species

cells deviation

(critical root cap (mm) length (mm) length (mm) (mm) critical length and two and four and six critical lengths

critical lengths

Interphase 91.3 7.5 1.2 0 0

Interphase 1.0 524 7.5 195 38.1 29.9 79.8 15.4 4.8 0 0

1.5 439 9.0 420 68.5 57.8

Interphase 53.6 24.3 18.1 3.8 0.2

Interphase 2.0 420 15.0 559 103 82.2 31.7 29.8 26.4 11.2 0.9

2.5 405

Interphase 15.0 510 117 83.1 19.3 34.1 32.1 13.8 0.7

3.0 326 16.5 495 135 75.8

Interphase 8.9 27.9 45.4 17.2 0.6

Pyrus communis (33.0mm)

0.5 26 13.5 33.0 22.2 6.3

Mitosis 0 0 33.3 37.3 33.3

3.0 1 225 225 225 0 0

Mitosis 0 0 100 0

0.5 422 7.5 105 18.5 11.9

Interphase 91.9 6.7 1.4 0 0

1.0 403 7.5 180 25.8 24.4 76.2

Interphase 16.4 6.4 1.0 0

1.5 385 9 315 50.3 47.7

Interphase 49.4 27.0 17.1 5.7 0.8

2.0

Interphase 387 15 904 124 140 8.5 34.1 31.5 13.7 12.2

2.5 356 22.5 907 103 95

Interphase 2.0 18.5 41.9 23.0 14.6

3.0

Interphase 324 35 601 191 156 0.6 7.4 41.4 28.1 22.5

Triticum aesti6um(37.5mm)

Interphase 0.9 0.9 0 –

1.0 141 9 112 46.9 25.0

Interphase 42.6 38.3 19.1 0 0

Vicia faba

Interphase 84.5 8.6 6.4 0.5 0

Interphase 1.0 387 7.5 450 39.9 45.6 74.9 17.0 7.2 0.3 0.6

1.5 388 7.5 300 52.6 53.8

Interphase 64.1 20.1 11.9 3.9 0

Interphase 2.0 341 10.5 375 65.9 59.0 57.8 20.1 17.1 5.0 0

2.5

Interphase 209 15 345 77.6 65.0 39.7 37.3 16.8 6.2 0

3.0 120 18 308 90.8 63.8

Interphase 30.8 36.7 25.0 7.5 0

Zea mays(30.0mm)

Interphase 91.9 6.7 1.4 0 0

1.0 411 6 150 24.3 20.7 73.0

Interphase 20.2 5.8 1.0 0

1.5 311 6 450 54.9 61.0

Interphase 36.0 32.2 22.8 6.4 2.6

2.0

Interphase 161 15 450 106 88.0 8.1 27.3 31.1 24.2 9.3

2.5 148 12 480 131 101

Interphase 5.4 20.3 29.0 30.4 14.9

3.0

(3)

Erratum

167

Table 2

Results of a Chi-square analysis of percentage of cells based upon cell lengths in individual roots compared with percentages based upon an exponential cell-age

distribution in details of the cycle completed

Percentages of cells in each decile (probablity)

Species or

0–10

11–20

21–30

31–40

41–50

51–60

61–70

71–80

81–90

91–100

theoretical

distribution

7.2

13.4

12.5

11.7

Theoretical

10.9

10.1

9.5

8.8

8.2

7.7

distribution

8.6 (0.005)

22.8 (0.005)

Pisum

16.1

12.1 (0.01)

8.1 (0.05)

4.3 (0.01)

11.7 (0.05)

4.2 (0.01)

8.1 (0.10)

4.0 (0.01)

sati

6

um

14.6 (0.10)

10.1 (0.05)

16.9 (0.01)

16.4 (0.01)

10.9 (0.10)

Pyrus

8.3 (0.10)

9.6 (0.10)

4.8 (0.05)

1.9 (0.005)

6.5 (0.10)

communis

Triticum

15.4 (0.05)

15.4 (0.05)

23.3 (0.005)

13.5 (0.05)

8.3 (0.05)

8.8 (0.10)

7.9 (0.10)

4.6 (0.05)

2.3 (0.01)

0.5 (0.005)

aeti

6

um

16.7 (0.01)

Vicia faba

14.0 (0.05)

8.7 (0.05)

17.6 (0.01)

10.4 (0.10)

16.1 (0.005)

6.3 (0.05)

4.8 (0.05)

1.5 (0.005)

3.9 (0.01)

8.5 (0.01)

9.2 (0.05)

11.8 (0.10)

26.5 (0.005)

13.2 (0.05)

5.2 (0.01)

8.8 (0.005)

8.0 (0.10)

Gambar

Table 1
Table 2

Referensi

Dokumen terkait

Dalam pengumpulan data, penulis menggunakan teknik dokumentasi, yaitu mengumpulkan data yang berasal dari sumbernya. Adapun dalam penelitian ini, dokumen yang dimaksud

LSM BAPEKA selaku pemohon belum sampai kepada tahapan Pengajuan Keberatan karena banyak mekanisme permohonan informasi yang salah alamat/ tidak sesuai dan tidak diperbaiki

Ringkasan/ Rekapitulasi Rencana Kerja Anggaran OPD yang memuat: (1) nama program dan kegiatan (2) target program (3) jadwal pelaksanaan Program/ kegiatan

Penambahan probiotik starbio (0 gram/kg - 4,5 gram/kg) dalam pakan ayam mampu meningkatkan bobot potong, dengan penambahan 4,5 gram/kg menghasilkan bobot potong dan

melaksanakan penelitian ini, saya juga mengucapkan terima kasih yang setulusnya. Sembah sujud dan rasa syukur saya persembahkan kepada yang tercinta kedua orang

Persiapan pakan itik (Analisis kandungan nutrien bahan pakan (Tabel 2), kebutuhan nutrien (Tabel 1), penyediaan bahan pakan dan penyusunan pakan), metode dan rancangan

[r]

Kadar laktat dinilai pada kedua kelompok pada waktu setelah pemberian 30ml/ KgBB, setelah MAP tercapai target 65 mmHg dengan pemberian norepinefrin, dan 6 jam