← →
International Review of Economics and Finance 8 (1999) 199–212
Purchasing power parity and dynamic error correction
Evidence from Asia Pacific economies
Daniel Y. Lee*
Department of Economics, Shippensburg University, Shippensburg, PA 17257, USA Received 13 September 1996; accepted 28 October 1997
Abstract
This study investigates the validity of purchasing power parity (PPP) hypothesis as a long run equilibrium condition for thirteen Asia Pacific economies using a generalized error correction model. The results of the generalized dynamic specification appear to support PPP for more countries than do standard tests for unit roots. Out of the thirteen bilateral exchange rates, evidence of PPP is found for only one (the Mexican peso/U.S. dollar rate) under traditional tests for unit roots, while seven of them support PPP under the generalized dynamic error correction model. It appears that one of the factors that lead standard tests for unit roots to fail to detect evidence of PPP may be the undue restrictions imposed on the model specification. Published by Elsevier Science Inc.
Keywords:Purchasing power parity; PPP; Exchange rates; Dynamic error correction
1. Introduction
The purchasing power parity (PPP) theory states that the equilibrium value of an exchange rate is determined by the changes in the relative national price levels. For example, if the U.S. price level rises by 5% over a year while Japan’s price level rises by 3%, then relative PPP predicts that the dollar will depreciate against the yen by 2%. The dollar’s 2% depreciation against the yen just cancels the differential in the inflation rates, leaving the relative domestic and foreign purchasing powers of both currencies unchanged. The theory recognizes national price levels and their interac-tions with exchange rates as a key factor in understanding why exchange rates can change dramatically over periods of several years.
The PPP theory has been tested for several countries using various statistical
meth-* Corresponding author. Tel.: 717-477-1556; fax: 717-477-4015. E-mail address: [email protected] (D.Y. Lee)
200 D.Y. Lee / International Review of Economics and Finance 8 (1999) 199–212
ods, sample periods and frequency of data. Some empirical studies find evidence of a tendency toward PPP in the long run, especially during high inflation periods, while others reject the hypothesis that there exists a long run relationship between exchange
rate and price ratio.1For example, Adler and Lehmann (1983), Ballie and McMahon
(1989), Cochran and DeFina (1995), Corbae and Ouliaris (1988), Fisher and Park (1991), and Meese and Rogoff (1988) find little support for the hypothesis, while Abuaf and Jorion (1990), Glen (1992), Kim (1990), Pippenger (1993) and Whitt (1992) find some evidence of PPP. This mixed nature of empirical findings has inspired further studies in search of answers to the puzzle. Some researchers attempt to explain failure of PPP by looking at the assumptions behind the theory such as trade impedi-ments, transportation costs, non-traded goods, productivity growth differentials be-tween countries, and so on. When these assumptions are relaxed, PPP is more likely to receive empirical support. For example, Bahmani-Oskooee (1992) finds that produc-tivity differential between countries is one of the major factors contributing to the deviation of PPP from the equilibrium exchange rate. Other empirical studies have focused on refining statistical methods in search of the PPP evidence leading to, most notably, testing for unit roots in recent years. Although testing for unit roots has been applied extensively in the PPP literature, there remain some methodological issues associated with the statistical procedure. In particular, as discussed in the following section, traditional tests for unit roots often impose undue restrictions on several variables. Failure to support PPP in many of previous empirical studies may be attributable to these restrictions.
The main purpose of this paper is to test the validity of PPP using a model that relaxes the restrictions implicit in traditional tests for unit roots. Following Steigerwald (1996), a dynamic error correction procedure of Phillips and Loretan (1991) is applied to overcome the statistical problems implied in traditional tests for unit roots. For a comparison purpose, the results from both standard testing for unit roots and the dynamic error correction model will be reported.
Recently, it has been suggested that nonstationarity of the real exchange rate may be due to some structural shifts. If that is true, PPP may be supported when allowances are made for changes in the mean of the real exchange rates. For example, using the cases of U.S./Finland and U.S./U.K. exchange rates, Perron and Vogelsang (1992) find evidence of PPP by allowing a one-time change in the mean of the exchange rates, which contradicts their results from a standard Dickey-Fuller test. This paper will consider the issue of potential structural shifts by separately testing PPP for the entire sample and the sample from the floating exchange rate period for each country. Furthermore, this paper will empirically investigate the PPP proposition using data from thirteen Asia Pacific countries, including several newly industrialized economies. Most previous empirical studies used data from developed countries only; PPP studies
on developing economies have been rather limited.2To close this gap, we include in
our study Australia, Canada, Chile, Hong Kong, Indonesia, Japan, Malaysia, Mexico, the Philippines, Singapore, South Korea, Taiwan, and Thailand. The bilateral exchange rates between these countries and the United States will be used to examine the
← →
D.Y. Lee / International Review of Economics and Finance 8 (1999) 199–212 201
The remaining part of this paper is organized as follows: Section 2 describes the PPP theory to be tested and the statistical issues associated with traditional tests for unit roots. The empirical results are presented in Section 3. The results of standard tests for unit roots and those of the dynamic error correction model are compared. The final section provides a summary and concluding remarks.
2. The model and methodology
The theory of PPP implies the following relationship between the exchange rate and the relative price ratio:
st5b01b1pt1 ut (1)
where st and pt denote the nominal exchange rate (measured in, for example, local
currency per U.S. dollar) and the ratio of price indices (e.g., consumer price index
(CPI) for a country divided by U.S. CPI), respectively, and utrepresents a random
disturbance term. Depending on the specification of the error termut, Eq. (1) could
represent a situation where PPP holds continuously over time except for a white noise
error. Tests of PPP often take the form of testing the null hypothesis ofb151.
Alternatively, empirical tests of PPP can be based on testing for a unit root in the real exchange rate. Such tests typically involve augmented Dickey-Fuller tests based on regression
Drt5 a 1 φrt211
o
m
i51
ciDrt2i1 et (2)
whereD denotes the first difference operator, rtis the real exchange rate measured
in natural logarithm, and et is a random disturbance term which is assumed to be
white noise. Ifφ,0, then thertseries does not have a unit root, which implies that
PPP is confirmed. On the other hand, if the estimated value of φ is statistically not
different from zero, then a unit root is present inrt, which indicates lack of evidence
of PPP.
since, by definition, rt 5 st - pt (all measured in natural logarithms). This equation
shows that whenφ,0, any deviation from PPP in the previous period (St212Pt21.0)
would reduce the growth rate of the exchange rate in the current period (Drt); in
other words, there is a tendency for the exchange rate to return to equilibrium rate
over time. However, whenφ50, there is no correction mechanism in the system that
indicates a tendency toward PPP.
Eq. (3) reveals at least two conceptual problems present in traditional testing for
unit roots for PPP (Steigerwald, 1996). First, the coefficient of Dpt equals unity by
construction. This restriction amounts to assuming the short-run elasticity ofDpt to
202 D.Y. Lee / International Review of Economics and Finance 8 (1999) 199–212
are restricted to be the same and opposite in sign. These restrictions imply that testing for unit roots using Eq. (2) is equivalent to testing three things at the same time: the
PPP hypothesis (φ coefficient), the unity of the coefficient of Dpt, and the equality
(and difference in sign) of the coefficients ofDst2iand Dpt2i.
These restrictions can be relaxed by allowing the coefficient ofDptto be estimated
instead of forcing it to be 1, and the two lagged terms,Dst2iandDpt2i, to have separate
coefficients, not necessarily equal to each other. Steigerwald (1996) also notes that
the two terms st and pt are both endogenous and thus their estimators are biased.
Following Phillips and Loretan (1991), leads of the differenced regressor (Dpt1i) as
well as lag terms will be included in our model to overcome such bias. Our tests of PPP are based on regression of:
Again, if the φcoefficient is less than zero and statistically significant, we conclude
that there is a tendency toward PPP. A negativeφcoefficient indicates an error correction
mechanism that any deviation of PPP in the previous period (St212 Pt21.0) would
reduce the divergence in the next period so that the exchange rate tends to return to
equilibrium rate in the long run. On the other hand, theφcoefficient that is statistically
different from zero would indicate failure to find evidence of PPP.
3. Empirical results
The data used in this study are monthly observations of exchange rates and price indexes with the sample ranging from 1957 to 1994 with variations for some countries for lack of complete data. The exchange rates for all countries except Taiwan were
obtained from the IMF’sInternational Financial StatisticsCD-ROM data disk
(Interna-tional Monetary Fund, 1995). All rates represent the figures for the period average
(seriesrf in IMF code). The ratios of price indices were computed using consumer
prices (CPI) and wholesale prices (WPI), also obtained from the IMF disk (line 64
and 63, respectively, in IMF code; 19905100). The data for Taiwan’s exchange rate
and CPI series were taken fromTaiwan Statistical Data Book(Council for Economic
Planning and Development, Taiwan, 1996). All bilateral exchange rates and price ratios represent the rates between each Asia Pacific country and the United States.
In testing for PPP, consumer price indexes or wholesale price indexes are usually used as proxies for national price levels. The CPI is the primary choice for this study since it is considered to be a reasonable choice by many researchers and is more readily available. For a comparison purpose, WPI series will be also used in this study for the countries for which data are available.
To show that both the log of nominal exchange rates (st) and the ratio of price
indices (pt) are appropriate for our study, tests for unit roots were performed on the
bilateral exchange rates and the price ratios (both CPI and WPI). Unlike traditional tests for unit roots in the real exchange rates, the dynamic error correction model in
←
→
D.Y.
Lee
/
International
Review
of
Economics
and
Finance
8
(1999)
199–212
203
Table 1
Tests for unit roots in the logarithms of nominal spot exchange rates and price ratios
Spot rate Spot rate CPI ratio CPI ratio WPI ratio WPI ratio Country Sample period level first difference level first difference Sample period level first difference
Australia 57.01–94.08 21.65 214.44** — — 57.01–94.08 22.40 214.16** Canada 57.01–94.08 21.59 217.34** 21.83 219.66** 57.01–94.08 21.47 221.46** Chile 57.01–94.08 20.75 221.08** 20.47 214.53** 60.01–94.08 20.44 214.04** Hong Kong 69.03–94.08 22.20 217.61** 20.46 219.16** — — — Indonesia 67.01–94.07 22.01 213.49** 22.24 220.58** 71.01–94.04 21.90 218.65** Japan 57.01–94.08 21.99 215.98** 20.12 220.03** 57.01–94.08 21.36 216.14** Korea 70.01–94.08 21.32 212.74** 21.27 211.53** 70.01–94.08 20.96 213.12** Malaysia 57.01–94.08 21.72 215.76** 22.11 217.36** 86.01–91.10 21.90 27.99** Mexico 57.01–94.08 21.25 218.85** 20.79 29.31** 57.01–94.08 20.95 210.76** Philippines 57.01–94.08 22.57 215.52** 22.30 213.77** 57.01–94.08 22.02 216.82** Singapore 68.01–94.08 22.01 212.51** 21.70 215.82** 68.01–94.08 23.30 211.83** Taiwan 61.01–94.08 21.98 216.95** 21.96 216.49** — — — Thailand 65.01–94.03 22.07 215.15** 22.01 215.70** 65.01–93.11 23.15 216.30**
Reported values are the Phillips–Perron unit root adjusted t-statistics. The test is based on the equation:Xt5a01a1(t) 1a2Xt1et. The truncation lag is 5 for the reported results, but the conclusions are in general the same for other values. The lag for Malaysian WPI ratio is 3.
204 D.Y. Lee / International Review of Economics and Finance 8 (1999) 199–212
Table 2
Tests for unit roots in the logarithms of real exchange rates
Country Sample period with CPI Sample period with WPI
Australia — — 57.01–94.08 21.84
Canada 57.01–94.08 21.12 57.01–94.08 22.01
Chile 57.01–94.08 20.77 60.01–94.08 23.02*
Hong Kong 69.03–94.08 1.31 — —
Indonesia 67.01–94.07 20.72 71.01–94.04 21.51
Japan 57.01–94.08 20.45 57.01–94.08 20.66
Korea 70.01–94.08 21.56 70.01–94.08 22.20
Malaysia 57.01–94.08 21.38 86.01–91.10 22.59
Mexico 57.01–94.08 23.28* 57.01–94.08 23.17*
Philippines 57.01–94.08 22.54 57.01–94.08 22.70
Singapore 68.01–94.08 21.61 68.01–94.08 21.17
Taiwan 61.01–94.08 20.73 — —
Thailand 65.01–94.03 21.49 65.01–93.11 22.31
Reported values are the Phillips–Perron unit root adjusted t-statistics for real bilateral exchange rates between the U.S. dollar and currencies for the countries listed. The real exchange rates are obtained using CPI and WPI, respectively. The test is based on the equation:Xt5a01a1Xt1et. The truncation
lag is 5 for the reported results, but the conclusions are in general the same for other values. The lag for Malaysia is 3 for the rate computed using WPI.
* Rejection of a unit root occurs at the 5% level.
Table 3
Tests for unit roots in the logarithms of real exchange rates: Floating exchange rate period
Country Sample period with CPI Sample period with WPI
Australia — — 74.01–94.08 21.57
Canada 74.01–94.08 21.00 74.01–94.08 21.54
Chile 83.01–94.08 22.76 83.01–94.08 21.92
Hong Kong 74.01–94.08 2.14 — —
Indonesia 79.01–94.07 20.99 79.01–94.04 20.71
Japan 74.01–94.08 21.09 74.01–94.08 21.08
Korea 80.01–94.08 21.85 80.01–94.08 22.28
Malaysia 74.01–94.08 21.38 86.01–91.10 22.59
Mexico 77.01–94.08 21.24 77.01–94.08 21.07
Philippines 74.01–94.08 21.57 74.01–94.08 22.47
Singapore 74.01–94.08 21.68 74.01–94.08 22.17
Taiwan 80.01–94.08 20.83 — —
Thailand 85.01–94.03 21.23 85.01–94.03 21.78
Reported values are the Phillips–Perron unit root adjusted t-statistics for real bilateral exchange rates between the U.S. dollar and currencies for the countries listed. The real exchange rates are obtained using CPI and WPI, respectively. The test is based on the equation:Xt5a01a1Xt1et. The truncation
← →
D.Y. Lee / International Review of Economics and Finance 8 (1999) 199–212 205
are known to contain two unit roots while there is little such evidence for nominal exchange rates. Thus, it is important to ascertain that the two variables are integrated in the same order. The Phillips-Perron (1988) unit-root adjusted t-statistics for the time series are reported in Table 1. No rejection of a unit root occurs at the 5% level of significance for all series in their levels. Without exception, a unit root is rejected at the 1% level of significance for all first-differenced series, both the exchange rates and the price ratios. The results indicate that each series is an I(1) process.
The Phillips-Perron tests for the real exchange rates (rt) using CPIs and WPIs are
presented in Table 2. The results indicate that a unit root is rejected for only Mexican peso/dollar rate at the 5% level of significance when the real exchange rate is computed using CPI. All other real exchange rates are shown to contain a unit root (i.e., the test fails to find evidence of PPP). These results roughly remain the same when wholesale price indices are used to derive the real exchange rates. As shown in the table, the real exchange rates for only Mexico and Chile are stationary at the 5% level of significance. These results are consistent with the earlier findings of, for example, Kim and Enders (1991) who test for stationarity of the real exchange rates for the U.S., Germany, Japan, the Philippines, India, Thailand and Korea using IMF-published exchange rates and WPIs.
To allow the possibility of a structural change, we tested for unit roots for the real exchange rates using the data from the floating exchange rate period only. The most prominent structural shift for most countries coincided with the realignment of interna-tional monetary system that occurred in 1973. However, some developing economies maintained rigid exchange rate regimes well past Bretton Woods. Except for these countries, we used the data from the 1974–94 period as the sub-sample. The results of our tests for unit roots are reported in Table 3. Using the sample from only the floating exchange rate period does not change the earlier results significantly. The hypothesis of a unit root in the real exchange rate cannot be rejected for all countries at the 5% level of significance. The results indicate that there is no evidence of PPP for the flexible exchange rate period. This is true even for Mexico.
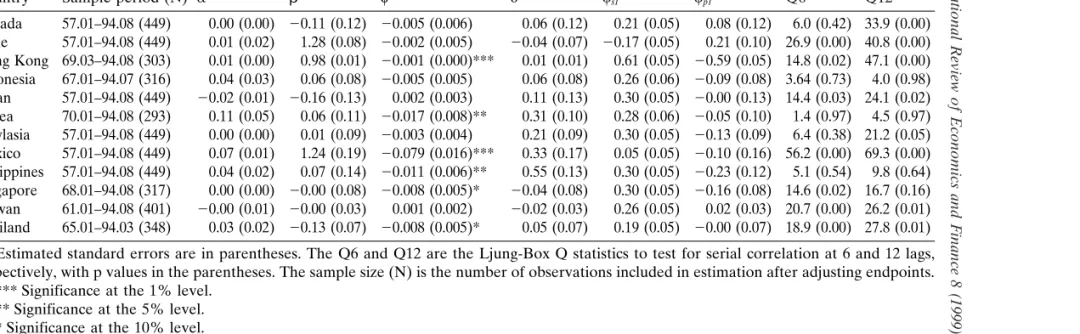
The results of PPP test based on the more generalized model [Eq. (4)] with one
lead and one lag are presented in Table 4. The coefficientsφfor all countries are less
than zero except for Japan and Taiwan. Again, when the φ coefficient is less than
zero and statistically significant, there is a tendency for the exchange rate to return to long run equilibrium PPP. Since the regression is based on ordinary least squares
and since PPP is supported whenφ,0, a one-tail t-test is appropriate. As in the case
of testing for unit roots in the real exchange rate, we find evidence of PPP for Mexico.
Itsφcoefficient of20.079 is statistically significant at the 1% level of significance. In
addition, the results show evidence of PPP for five other countries: Hong Kong, Korea,
the Philippines, Singapore, and Thailand. Theφcoefficients are significantly less than
zero at the 1% level of significance for Hong Kong, at the 5% level for Korea and the Philippines, and at the 10% level of significance for Singapore and Thailand. These results seem to indicate that PPP is supported for more countries when the stringent restrictions implicit in traditional tests for unit roots are relaxed.
→
Lee
/
International
Review
of
Economics
and
Finance
8
(1999)
199–212
Table 4
Tests of PPP using generalized model for log of exchange rates and price ratios (CPI)
Dst5 a 1 bDpt1φ(st212pt21)1 dDpt111 cs1Dst211 cp1Dpt211 et
Country Sample period (N) a b φ d cs1 cp1 Q6 Q12
Canada 57.01–94.08 (449) 0.00 (0.00) 20.11 (0.12) 20.005 (0.006) 0.06 (0.12) 0.21 (0.05) 0.08 (0.12) 6.0 (0.42) 33.9 (0.00) Chile 57.01–94.08 (449) 0.01 (0.02) 1.28 (0.08) 20.002 (0.005) 20.04 (0.07) 20.17 (0.05) 0.21 (0.10) 26.9 (0.00) 40.8 (0.00) Hong Kong 69.03–94.08 (303) 0.01 (0.00) 0.98 (0.01) 20.001 (0.000)*** 0.01 (0.01) 0.61 (0.05) 20.59 (0.05) 14.8 (0.02) 47.1 (0.00) Indonesia 67.01–94.07 (316) 0.04 (0.03) 0.06 (0.08) 20.005 (0.005) 0.06 (0.08) 0.26 (0.06) 20.09 (0.08) 3.64 (0.73) 4.0 (0.98) Japan 57.01–94.08 (449) 20.02 (0.01) 20.16 (0.13) 0.002 (0.003) 0.11 (0.13) 0.30 (0.05) 20.00 (0.13) 14.4 (0.03) 24.1 (0.02) Korea 70.01–94.08 (293) 0.11 (0.05) 0.06 (0.11) 20.017 (0.008)** 0.31 (0.10) 0.28 (0.06) 20.05 (0.10) 1.4 (0.97) 4.5 (0.97) Maylasia 57.01–94.08 (449) 0.00 (0.00) 0.01 (0.09) 20.003 (0.004) 0.21 (0.09) 0.30 (0.05) 20.13 (0.09) 6.4 (0.38) 21.2 (0.05) Mexico 57.01–94.08 (449) 0.07 (0.01) 1.24 (0.19) 20.079 (0.016)*** 0.33 (0.17) 0.05 (0.05) 20.10 (0.16) 56.2 (0.00) 69.3 (0.00) Philippines 57.01–94.08 (449) 0.04 (0.02) 0.07 (0.14) 20.011 (0.006)** 0.55 (0.13) 0.30 (0.05) 20.23 (0.12) 5.1 (0.54) 9.8 (0.64) Singapore 68.01–94.08 (317) 0.00 (0.00) 20.00 (0.08) 20.008 (0.005)* 20.04 (0.08) 0.30 (0.05) 20.16 (0.08) 14.6 (0.02) 16.7 (0.16) Taiwan 61.01–94.08 (401) 20.00 (0.01) 20.00 (0.03) 0.001 (0.002) 20.02 (0.03) 0.26 (0.05) 0.02 (0.03) 20.7 (0.00) 26.2 (0.01) Thailand 65.01–94.03 (348) 0.03 (0.02) 20.13 (0.07) 20.008 (0.005)* 0.05 (0.07) 0.19 (0.05) 20.00 (0.07) 18.9 (0.00) 27.8 (0.01)
Estimated standard errors are in parentheses. The Q6 and Q12 are the Ljung-Box Q statistics to test for serial correlation at 6 and 12 lags, respectively, with p values in the parentheses. The sample size (N) is the number of observations included in estimation after adjusting endpoints.
←
→
D.Y.
Lee
/
International
Review
of
Economics
and
Finance
8
(1999)
199–212
207
Table 5
Tests of PPP using generalized model for log of exchange rates and price ratios (CPI) (with sufficient leads and lags to correct autocorrelation)
Dst5 a 1 bDpt1φ(st212pt21)1
o
mi51
diDpt1i1
o
mi51
(csiDst2i1 cpiDpt2i)1 et
Country Sample period (N) m φ dm csm cpm Q6 Q12
Chile 57.01–94.08 (447) 4 0.001 (0.004) 0.70 (0.07) 0.24 (0.05) 20.79 (0.09) 4.62 (0.76) 15.0 (0.24) Hong Kong 69.03–94.08 (301) 2 20.001 (0.000)*** 20.01 (0.01) 0.20 (0.06) 20.20 (0.06) 3.77 (0.71) 26.1 (0.01) Japan 57.01–94.08 (447) 2 0.002 (0.003) 0.01 (0.13) 20.09 (0.05) 20.00 (0.13) 8.0 (0.24) 16.3 (0.18) Mexico 57.01–94.08 (447) 5 20.057 (0.016)*** 0.45 (0.16) 0.22 (0.05) 20.29 (0.15) 8.0 (0.24) 13.1 (0.36) Singapore 68.01–94.08 (315) 2 20.008 (0.005)* 0.01 (0.08) 20.09 (0.06) 0.01 (0.08) 9.0 (0.17) 11.7 (0.47) Taiwan 61.01–94.08 (399) 2 0.000 (0.002) 0.02 (0.03) 0.13 (0.05) 0.04 (0.03) 11.4 (0.08) 16.0 (0.19) Thailand 65.01–94.03 (344) 3 20.009 (0.005)** 0.08 (0.07) 0.14 (0.05) 0.01 (0.07) 9.3 (0.16) 14.6 (0.27)
Estimated standard errors are in parentheses. The Q6 and Q12 are the Ljung-Box Q statistics to test for serial correlation at 6 and 12 lags, respectively, with p values in the parentheses. The sample size (N) is the number of observations included in estimation after adjusting endpoints.
→
Lee
/
International
Review
of
Economics
and
Finance
8
(1999)
199–212
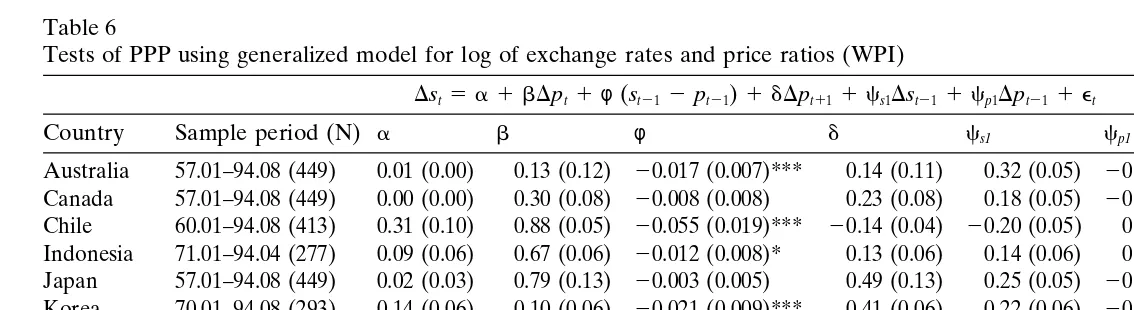
Table 6
Tests of PPP using generalized model for log of exchange rates and price ratios (WPI)
Dst5 a 1 bDpt1φ(st212pt21)1 dDpt111 cs1Dst211 cp1Dpt211 et
Country Sample period (N) a b φ d cs1 cp1 Q6 Q12
Australia 57.01–94.08 (449) 0.01 (0.00) 0.13 (0.12) 20.017 (0.007)*** 0.14 (0.11) 0.32 (0.05) 20.04 (0.11) 8.8 (0.18) 21.7 (0.04) Canada 57.01–94.08 (449) 0.00 (0.00) 0.30 (0.08) 20.008 (0.008) 0.23 (0.08) 0.18 (0.05) 20.10 (0.08) 5.6 (0.47) 32.7 (0.00) Chile 60.01–94.08 (413) 0.31 (0.10) 0.88 (0.05) 20.055 (0.019)*** 20.14 (0.04) 20.20 (0.05) 0.05 (0.06) 11.5 (0.08) 24.9 (0.02) Indonesia 71.01–94.04 (277) 0.09 (0.06) 0.67 (0.06) 20.012 (0.008)* 0.13 (0.06) 0.14 (0.06) 0.12 (0.07) 2.4 (0.88) 3.9 (0.99) Japan 57.01–94.08 (449) 0.02 (0.03) 0.79 (0.13) 20.003 (0.005) 0.49 (0.13) 0.25 (0.05) 20.29 (0.14) 9.9 (0.13) 18.7 (0.10) Korea 70.01–94.08 (293) 0.14 (0.06) 0.10 (0.06) 20.021 (0.009)*** 0.41 (0.06) 0.22 (0.06) 20.08 (0.06) 6.3 (0.40) 10.2 (0.59) Maylasia 86.01–91.10 (67) 0.07 (0.03) 0.13 (0.13) 20.074 (0.032)*** 20.12 (0.14) 0.31 (0.12) 20.08 (0.14) 12.5 (0.05) 18.1 (0.11) Mexico 57.01–94.08 (449) 0.07 (0.02) 0.92 (0.12) 20.072 (0.017)*** 0.39 (0.11) 0.04 (0.05) 20.04 (0.11) 66.8 (0.00) 76.9 (0.00) Philippines 57.01–94.08 (449) 0.06 (0.03) 0.55 (0.08) 20.018 (0.008)*** 0.21 (0.08) 0.30 (0.05) 20.26 (0.08) 5.3 (0.50) 11.7 (0.47) Singapore 74.01–94.08 (245) 0.01 (0.00) 0.04 (0.06) 20.013 (0.007)** 0.01 (0.06) 0.30 (0.06) 20.08 (0.06) 6.6 (0.36) 9.2 (0.69) Thailand 65.01–93.11 (344) 0.02 (0.02) 20.04 (0.04) 20.006 (0.006) 0.05 (0.04) 0.20 (0.05) 0.00 (0.04) 17.9 (0.01) 26.9 (0.01)
Estimated standard errors are in parentheses. The Q6 and Q12 are the Ljung-Box Q statistics to test for serial correlation at 6 and 12 lags, respectively, with p values in the parentheses. The sample size (N) is the number of observations included in estimation after adjusting endpoints.
← →
D.Y. Lee / International Review of Economics and Finance 8 (1999) 199–212 209
in the error, we performed an autocorrelation test on the residuals. As the regression includes lagged dependent variable, a more general test than the Durbin-Watson statistics is required. We use the Ljung-Box Q statistics to test the hypothesis that the autocorrelations are zero; in other words, the series is white noise. The Q statistics reported in Table 4 indicate that the residuals for several countries are indeed serially correlated. To remedy the problem, additional leads and lags were included in the subsequent estimation until we do not reject the null hypothesis of no autocorrelation at the 5% level of significance. The results are reported in Table 5. As shown in the table, the corrected estimation does not alter the earlier results significantly. Of the seven countries in question, Mexico, Hong Kong, Singapore and Thailand show evidence of PPP as before, while Chile, Japan and Taiwan do not.
When wholesale prices are used to obtain the log of price ratios, the results become even more robust. As shown in Table 6, out of eleven countries for which data are available, eight are found to support long run PPP under the generalized error
correc-tion model. Theφcoefficients are less than zero and statistically significant at the 1%
level of significance for Australia, Chile, Korea, Malaysia, Mexico, and the Philippines, and at the 5% level of significance, Singapore, and also marginally significant for Indonesia at the 10% level. These results confirm the conventional notion that WPIs tend to favor evidence of PPP.
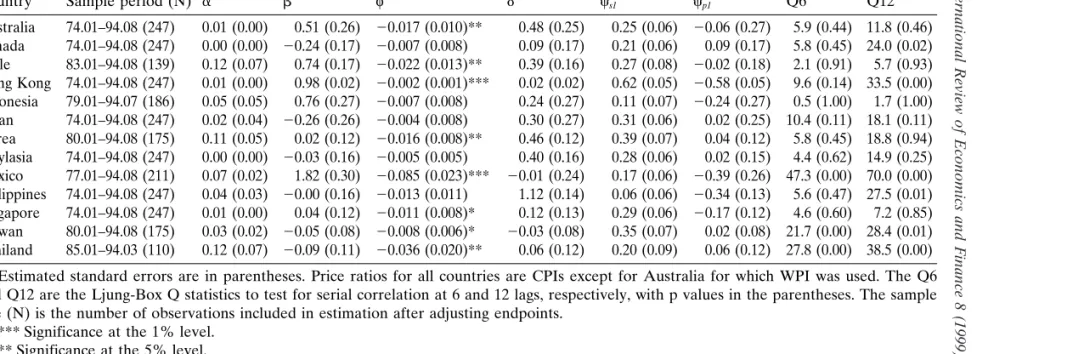
Table 7 shows the empirical results of the generalized dynamic model for the floating
exchange rate periods. The φ coefficients are less than zero for all countries. They
are statistically significant at the 1% level for Hong Kong and Mexico. Theφ
coeffi-cients are also significant at the 5% level for Australia (using WPI), Chile, Korea, and Thailand, and at the 10% level for Singapore and Taiwan. The only real change
from the long sample is that theφcoefficients are now significantly less than zero for
Chile at the 5% level of significance and for Taiwan at the 10% level, while that of
the Philippines is now not significant (its p value is 0.12). Relaxing the restrictions
implicit in standard tests for unit roots appears to lead non-rejection of PPP, while using data from the floating exchange rate periods yields mixed results.
Finally, the results of our generalized model do not seem to confirm the two restrictions that are implicit in the specification of traditional tests for unit roots in
the real exchange rates. The coefficients ofDptare not in general close to unity. The
coefficients of Dst2i and Dpt2i appear to be opposite in sign in most cases, but they
rarely are equal in magnitude. Our results seem to cast a shadow of doubt on the practice of imposing such restrictions.
4. Concluding remarks
→
Lee
/
International
Review
of
Economics
and
Finance
8
(1999)
199–212
Table 7
Tests of PPP using generalized model for floating exchange rate periods
Dst5 a 1 bDpt1φ(st212pt21)1 dDpt111 cs1Dst211 cp1Dpt211 et
Country Sample period (N) a b φ d cs1 cp1 Q6 Q12
Australia 74.01–94.08 (247) 0.01 (0.00) 0.51 (0.26) 20.017 (0.010)** 0.48 (0.25) 0.25 (0.06) 20.06 (0.27) 5.9 (0.44) 11.8 (0.46) Canada 74.01–94.08 (247) 0.00 (0.00) 20.24 (0.17) 20.007 (0.008) 0.09 (0.17) 0.21 (0.06) 0.09 (0.17) 5.8 (0.45) 24.0 (0.02) Chile 83.01–94.08 (139) 0.12 (0.07) 0.74 (0.17) 20.022 (0.013)** 0.39 (0.16) 0.27 (0.08) 20.02 (0.18) 2.1 (0.91) 5.7 (0.93) Hong Kong 74.01–94.08 (247) 0.01 (0.00) 0.98 (0.02) 20.002 (0.001)*** 0.02 (0.02) 0.62 (0.05) 20.58 (0.05) 9.6 (0.14) 33.5 (0.00) Indonesia 79.01–94.07 (186) 0.05 (0.05) 0.76 (0.27) 20.007 (0.008) 0.24 (0.27) 0.11 (0.07) 20.24 (0.27) 0.5 (1.00) 1.7 (1.00) Japan 74.01–94.08 (247) 0.02 (0.04) 20.26 (0.26) 20.004 (0.008) 0.30 (0.27) 0.31 (0.06) 0.02 (0.25) 10.4 (0.11) 18.1 (0.11) Korea 80.01–94.08 (175) 0.11 (0.05) 0.02 (0.12) 20.016 (0.008)** 0.46 (0.12) 0.39 (0.07) 0.04 (0.12) 5.8 (0.45) 18.8 (0.94) Maylasia 74.01–94.08 (247) 0.00 (0.00) 20.03 (0.16) 20.005 (0.005) 0.40 (0.16) 0.28 (0.06) 0.02 (0.15) 4.4 (0.62) 14.9 (0.25) Mexico 77.01–94.08 (211) 0.07 (0.02) 1.82 (0.30) 20.085 (0.023)*** 20.01 (0.24) 0.17 (0.06) 20.39 (0.26) 47.3 (0.00) 70.0 (0.00) Philippines 74.01–94.08 (247) 0.04 (0.03) 20.00 (0.16) 20.013 (0.011) 1.12 (0.14) 0.06 (0.06) 20.34 (0.13) 5.6 (0.47) 27.5 (0.01) Singapore 74.01–94.08 (247) 0.01 (0.00) 0.04 (0.12) 20.011 (0.008)* 0.12 (0.13) 0.29 (0.06) 20.17 (0.12) 4.6 (0.60) 7.2 (0.85) Taiwan 80.01–94.08 (175) 0.03 (0.02) 20.05 (0.08) 20.008 (0.006)* 20.03 (0.08) 0.35 (0.07) 0.02 (0.08) 21.7 (0.00) 28.4 (0.01) Thailand 85.01–94.03 (110) 0.12 (0.07) 20.09 (0.11) 20.036 (0.020)** 0.06 (0.12) 0.20 (0.09) 0.06 (0.12) 27.8 (0.00) 38.5 (0.00)
Estimated standard errors are in parentheses. Price ratios for all countries are CPIs except for Australia for which WPI was used. The Q6 and Q12 are the Ljung-Box Q statistics to test for serial correlation at 6 and 12 lags, respectively, with p values in the parentheses. The sample size (N) is the number of observations included in estimation after adjusting endpoints.
← →
D.Y. Lee / International Review of Economics and Finance 8 (1999) 199–212 211
traditional tests for unit roots. As expected, our standard tests for unit roots in the real exchange rate confirm earlier empirical studies that there is little support for a long run relationship between exchange rate and price ratio. The hypothesis of a unit root can be rejected only for Mexico for the long sample period. This is true regardless of using CPI or WPI to generate the log of price ratios. In addition, there is little evidence of PPP even when only the data from the floating exchange rate period are considered.
On the other hand, the empirical results reveal that the generalized dynamic model tends to support PPP for more countries than do the standard tests for unit roots. Out of the twelve exchange rates, six of them support long-run PPP under our generalized dynamic error correction model when CPIs were used. With WPIs, eight out of eleven exchange rates are found to follow PPP. The results are similar for the data from the floating exchange rate periods. It appears that one of the factors that lead traditional tests for unit roots to fail to detect evidence of PPP may be the undue restrictions imposed on the model specification.
Acknowledgments
I am grateful to three anonymous referees and Ming-Shiun Pan for their helpful suggestions. I also thank Shippensburg University Foundation for partial financial support.
Notes
1. For a survey of recent developments in the PPP literature, see Rogoff (1995). Officer (1976) provides a review of early history of PPP study.
2. See, for example, Kim and Enders (1991); Phylaktis and Kassimatis (1994); and Liu, Pan, and Chiou (1994) for PPP studies for some Pacific Basin countries. 3. All of these countries are the members of APEC (Asia Pacific Economic
Cooper-ation). The other member nations, Brunei, China, New Zealand, and Papua New Guinea, are excluded in this study due to lack of data. Trade among APEC countries accounted for over 46% of world trade in 1993.
References
Abuaf, N., & Jorion, P. (1990). Purchasing power parity in the long run.Journal of Finance 45, 157–174. Adler, M., & Lehmann, B. (1983). Deviations from purchasing power parity in the long run.Journal of
Finance 38, 1471–1487.
Baillie, R. T., & McMahon, P. C. (1989). The Foreign Exchange Market: Theory and Econometric Evidence.Cambridge: Cambridge University Press.
Bahmani-Oskooee, M. (1992). A time series approach to test the productivity bias hypothesis in purchasing power parity.Kyklos 45, 227–237.
212 D.Y. Lee / International Review of Economics and Finance 8 (1999) 199–212
Corbae, D., & Ouliaris, S. (1988). Cointegration and tests of purchasing power parity.Review of Economics and Statistics 70, 508–511.
Council for Economic Planning and Development, Taiwan. (1996).Taiwan Statistical Data Book. Fisher, E., & Park, J. (1991). Testing purchasing power parity under the null hypothesis of cointegration.
Economic Journal 101, 1476–1484.
Glen, J. (1992). Real exchange rates in the short, medium, and long run.Journal of International Economics 33, 147–166.
International Monetary Fund. (1995).International Financial Statistics. CD-ROM.
Kim, Y. (1990). Purchasing power parity in the long run: a cointegration approach.Journal of Money, Credit, and Banking 22, 491–503.
Kim, J., & Enders, W. (1991). Real and monetary causes of real exchange rate movements in the Pacific Rim.Southern Economic Journal 57, 1061–1070.
Liu, Y. A., Pan, M., & Chiou, J. (1994). The random walk behavior of foreign exchange rates: an examination of nine Pacific-Basin countries.Journal of Financial Studies 2, 1–16.
Meese, R. A., & Rogoff, K. (1988). Was it real? The exchange rate-interest differential relation over the modern floating-rate period.Journal of Finance 43, 933–948.
Officer, L. H. (1976). The purchasing-power-parity theory of exchange rates: A review article. Interna-tional Monetary Funds Staff Papers 23, 1–61.
Perron, P., & Vogelsang, T. J. (1992). Nonstationarity and level shifts with an application to purchasing power parity.Journal of Business & Economic Statistics 10, 301–320.
Phillips, P. C., & Perron, P. (1988). Testing for a unit root in time series regression.Biometrika 75, 335–346.
Phillips, P. C. B., & Loretan, M. (1991). Estimating long run economic equilibria.Review of Economic Studies 58, 407–436.
Phylaktis, K., & Kassimatis, Y. (1994). Does the real exchange rate follow a random walk? The Pacific Basin perspective.Journal of International Money and Finance 13, 476–495.
Pippenger, M. K. (1993). Cointegration tests of purchasing power parity: the case of the Swiss exchange rate.Journal of International Money and Finance 12, 46–61.
Rogoff, K. (1995). What remains of purchasing power parity?Economic Research Reports 95-07.New York: C.V. Starr Center for Applied Economics, New York University.
Steigerwald, D. G. (1996). Purchasing power parity, unit roots, and dynamic structure.Journal of Emprical Finance 2, 343–357.