The Development of Reproducible and Selective Uric Acid Biosensor
by Using Electrodeposited Polytyramine as Matrix Polymer
Manihar Situmorang
1,*and Isnaini Nurwahyuni
21Department of Chemistry, Faculty of Mathematics and Natural Science, Universitas Negeri Medan, Jl. Willem Iskandar Psr V, Medan 20221, North Sumatera, Indonesia
2Department of Biology, Faculty of Mathematics and Natural Sciences, Universitas Sumatra Utara, Jl. Bioteknologi No 1 Kampus USU Padang Bulan, Medan 20155, North Sumatera, Indonesia
Received June 11, 2017; Accepted August 16, 2017
ABSTRACT
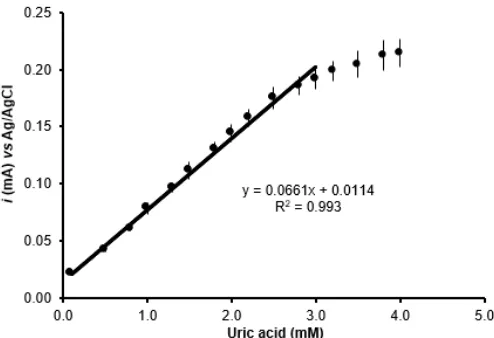
A versatile method for the construction of reproducible and high selective uric acid biosensor is explained. Electrodeposited polytyramine is used as biosensor matrixes due to its compatibility to immobilize enzyme uric oxidase in the membrane electrode. The precise control over the charge passed during deposition of polytyramine allows concomitant control over the thickness of the deposited enzyme layers onto the surface of the electrode. The uric acid biosensor showed a sensitive response to uric acid with a linear calibration curve lies in the concentration range of 0.1–2.5 mM, slope 0.066 µA mM-1, and the limit detection was 0.01 mM uric acid (S/N = 3). The biosensor
shown excellent reproducibility, the variation between response curves for uric acid lies between RSD 1% at low concentrations and up to RSD 6% at saturation concentration. Uric acid biosensor is free from normal interference. The biosensor showed good stability and to be applicable to determine uric acid in real samples. Analysis of uric acid in the reference standard serum samples by the biosensor method are all agreed with the real value from supplier. Standard samples were also analyzed independently by two methods: the present biosensor method and the standard UV-Vis spectrophotometry method, gave a correlation coefficient of 0.994. This result confirms that the biosensor method meets the rigid demands expected for uric acid in real samples.
Keywords:uric acid biosensor; electrodeposited polytyramine; polymer matrix; reproducible; selective
ABSTRAK
Penelitian ini menjelaskan metode pembuatan biosensor asam urat yang memiliki keterulangan tinggi dan sangat selektif terhadap asam urat. Biosensor dibuat menggunakan matriks polytyramine sebagai matrix polymer karena membran sangat sesuai untuk mengimobilasi enzim uric oxidase. Teknik elektropolymerisasi dipergunakan untuk mendeposit polytyramine sehingga ketebalan lapisan membran dan enzim pada permukaan elektroda dapat dikontrol. Biosensor asam urat memberikan respon yang sensitif terhadap asam urat, kurva kalibrasi larutan standar linier pada skala konsentrasi 0,1–2,5 mM asam urat, slope 0,066 µA mM-1, dan batas deteksi 0,01 mM asam urat
(S/N = 3). Biosensor asam urat memiliki keterulangan sangat baik, koefisien variasi berada pada RSD 1% untuk konsentrasi asam urat sangat rendah dan RSD 6% pada konsentrasi asam urat sangat tinggi. Biosensor asam urat bebas dari senyawa pengganggu pada konsentrasi normal. Stabilitas biosensor sangat baik dan dapat diaplikasikan untuk penentuan asam urat di dalam sampel. Hasil analisis asam urat yang terkandung di dalam sampel serum referensi menggunakan biosensor sama dengan konsentrasi asam urat yang diberikan oleh pabrik. Sampel referensi standar juga dianalisis secara terpisah menggunakan metode biosensor dan UV-Vis spectrophotometry, kedua metode analisis memberikan koeffisien korelasi 0,994. Hasil ini meyakinkan bahwa biosensor asam urat telah memenuhi kriteria instrumen analisis yang diperlukan untuk penentuan asam urat di dalam sampel.
Kata Kunci:biosensor asam urat; electrodeposisi polytyramine; matriks polymer; keterulangan tinggi; selektif
INTRODUCTION
The development of biosensor for uric acid determination is very interesting to obtain a fast, selective, sensitive, reliable and accurate method to be used as standard analytical tools in analytical chemistry.
related disease [3]. Uric acid is known as the final product of purine degradation has been shown to be increased in hypoxic states such as chronic heart failure and cardiovascular diseases [4]. Epidemiological and clinical studies have demonstrated a strong positive correlation between the total uric acid in human blood serum and the incident of atherosclerosis [5]. The normal level of uric acid in the blood is 200-430 µM L-1 [6]. The diet with high concentration of purine is known to be contributed to increase the level of uric acid in body fluid [7]. As awareness of the importance of uric acid levels has increased in persons with sensitive to uric acid, it needs to control the uric acid in their serum as well as the consumption of food products that increase the uric acid in body fluid. Therefore, it requires a very sensitive and selective method for uric acid determination in clinic samples.
Various analytical methods have been used for uric acid assays, including colorimetric, optoelectronic sensor [8], fluorometric-enzymatic method, luminol chemiluminescence, high-performance liquid chromatography, and biosensor with electrochemical methods [9-13], where enzymatic procedures are mainly employed, due to their rapid, selective, sensitive nature and the great accuracy obtained in the measurements. Electrochemical detection systems on the biosensor for uric acid assay are frequently based on the monitoring the consumption of oxygen or the rate production of hydrogen peroxide [14] by an enzymatic catalytic reaction. However, the presence of electroactive compounds in the matrix samples interferes the electrochemical method that resulted in low accuracy of measurement. Attempts have been made to enhance the selectivity of uric acid biosensor by coating the electrode surface with membrane film using of electrodeposited polymer [15].
The construction of the reproducible biosensor by using electrodeposited polymer is promising in the simplicity of the fabrication of the sensor, however, the stability of the enzyme in the matrix polymer was very low [16]. Various types of polymers have been used to construct biosensors [17]. Most of the polymer films used to immobilize active materials are conducting polymers such as polypyrrole, polyacetylene, polythyophene, polyaniline, and polyindole. With a conducting polymer, the thickness of the polymer can be varied from thin to thick due to its conductivity. Conducting polymer-based membranes lack permselectivity toward electroactive interferences such as ascorbic acid and paracetamol that can be directly oxidized at the electrode surfaces. Modification of the electrode by building a permselective membrane using non-conducting polymer is effective in improving the selectivity of enzyme electrodes to interferences. Furthermore, reproducible membrane films can be made by using non-conducting polymers because the film is
thin as the growth is self-limiting, and thus allows the construction of reproducible sensors [18]. Various non-conducting polymers have been used for enzyme electrodes including overoxidized polypyrrole, polyphenols, polyphenylenediamine, polydichlorophenolindo-phenol and polytyramine where the majority of the approaches have been mainly focused on the electropolymerization of hetero-atom substituted aromatic compounds.
Electropolymerization has been widely applied for the fabrication of polymer films in biosensors construction. The method allows the production of homogenous thin films and thicker ones even on non-flat substrates, and can be used to localize the deposition of the matrix very close to the transducing surface. Electropolymerization is also important for the construction of microelectrodes as immobilization of active materials can proceed on the very small area of the sensing apparatus such as a working electrode. Electrodeposited polymers serve in sensors as convenient matrix for the immobilization of sensing materials such as enzymes and chemically active materials. Good detectability and fast response are provided by redox reaction of the substrate catalyzed by an enzyme in the bulk of the polymer layer. Electropolymerized films can be categorized as conducting or non-conducting polymers. Conducting films are widely used to enhance electron transfer, while non-conducting polymers are important for their permselective characteristics. With the aim of developing novel passivating films to be used as permselective and thin membranes that are compatible as a matrix polymer for enzyme immobilization, the use of electrodeposited polytyramine has attracted attention in biosensor construction and chemical sensor [19-20]. In this respect, electrodeposited polytyramine is an ideal polymer for the fabrication of enzyme electrodes as it contains an amine group to covalently attach the biorecognition molecule via a peptide linkage. Investigations of the potential applications of polytyramine films for chemical sensor applications have been studied [21]. The versatility of polytyramine as an immobilization matrix for active materials produces highly reproducible sensing device, which have good long-term stability, are excellent at screening out interfering substances, and provide considerable control over the response of the sensor. The presence of free amine groups on the polymer has been demonstrated to be an ideal for the covalent attachment of enzymes via the formation of a peptide bond that allowed the immobilization of the enzyme onto the surface of the polymer and immobilized throughout the polymer layer.
biosensor for uric acid is a main concern. The detection system for uric acid is conducted based upon a successful for electrochemical biosensors described in previous studies [22]. Determination of uric acid by this system is based on enzymatic catalytic reaction:
UOx
Uric acid is enzymatically oxidise to produce allantoin and hydrogen peroxide (H2O2) in the presence of immobilised enzyme uric oxidase (UOx) in the polytyramine film. The hydrogen peroxide released is then monitored amperometrically via its oxidation at a constant potential of 0.6 V vs Ag/AgCl on the modified enzyme electrode sensing devices of uric acid biosensor. The measuring current obtained from the biosensor (as shown from equation 1-2) is stoichiometrically equivalent to the concentration of the uric acid in the sample.
The purpose of this paper is to present our result on the development of a reproducible, sensitive and selective biosensor for determination of uric acid. The technique explains a method for constructing the enzyme electrode as a uric acid biosensor sensing device by using matrix polytyramine film to immobilize enzyme UOx into the surface of the platinised glassy carbon electrode. The performance of the biosensor is assessed based on its rapid response, sensitivity, reproducibility, stability, and selectivity to uric acid. Analysis of uric acid in the reference standard serum samples have been conducted with the developed uric acid biosensor and the measurements accuracy are compared with the assigned value of uric acid given by supplier. The determination of uric acid in the reference samples has also been compared with the result obtained by the standard UV-Vis spectrophotometry method to confirm that the biosensor method has meet the expected uric acid value in the samples.
EXPERIMENTAL SECTION
Materials
Uric acid oxidase (UOx) 50 unit/mg (E.C 1.7.3.3), peroxidase (POx) 179 units/mg (E.C.1.11.1.7.2) from horse radish, tyramine (4-hydroxyphenethylamine), N-hydroxysuccinimide (NHS)1-ethyl-3 (3 dimethy lamino-propyl) carbodiimide hydrochloride (EDC), uric acid, trisma-HCl, glucose, fructose, glutamine, and uric acid in reference standard serums were obtained from Sigma Chem. Co. Reagent grades of potassium hexachloroplatinate(IV), Na2SO3, K2HPO4, KH2PO4, KCl, K3Fe(CN)6, HCl, CH3COONa, Li2CO3, ascorbic acid, methanol, and ethanol were purchased from Aldrich
Chem. Co. All reagents were used without purification and deionised water was used for all solutions.
Uric acid standard solution was prepared by dissolving uric acid in 4% lithium carbonate (Li2CO3). Buffer solution of 0.05 M phosphate buffer containing of 0.05 M KCl supporting electrolyte was prepared from KH2PO4 and the pH (pH 5.5–7.0) was adjusted with K2HPO4 solution. The same procedures were conducted to prepare acetate buffer (pH 4.0–5.0) from the mixture of CH3COONa with CH3COOH, and trisma buffer (pH 7.5–8.0) from trisma-base with HCl or trisma-HCl with NaOH, where the concentration of each buffer solution was 0.05 M containing of 0.05 M KCl. The solution containing 0.015 M EDC and 0.03 M NHS was prepared in phosphate buffer (0.05 M, pH 5.5), and were freshly prepared prior to coupling reaction between the enzyme and the polytyramine.
Instrumentation
Amperometric measurements, electropolymerization, and cyclic voltammetry were performed in a three electrode cell using a BAS 100B (Bioanalytical System Inc. Lafayette) potentiostat. A glassy carbon disk electrode (BAS), area of 0.070 cm2 was used as working electrode, the reference Ag/AgCl electrode was from BAS and a home-made platinum wire electrode (1 cm, 0.5 mm diameter) was used as the auxiliary electrode. A Spectrophotometer UV-Vis (Perkin Elmer, Lamda 25) was used for spectrophotometric measurements.
Procedure
Preparation of enzyme electrode
enzyme electrode was then rinsed with phosphate buffer solution under a constant stirring to remove loosely bounded enzyme and to clean the electrode surface from excess of adsorbed EDC and NHS. The enzyme electrode was then stored dry overnight at 4 °C, and was conditioned for 5 min in phosphate buffer solution (pH 6.0) before use. To keep the activity of the enzyme remains constant for a longer time of uses, the electrode is stored dry in the fridge (4 °C) when not in use.
Uric acid measurement
Amperometric determination of uric acid was performed by applying a constant potential of 0.6 V vs.
Ag/AgCl. The background current was allowed to settle to a constant baseline, and a series of uric acid standard solutions (from a stock solution of 0.1 M uric acid) was then added into 10 mL (0.05 M, pH 6.0) phosphate buffer solution, with stirring for five seconds after the addition. The enzymatic reaction was monitored continuously until steady state values were reached via the oxidation of the hydrogen peroxide produced at the electrode surface. The same procedures are also carried out for uric acid determination by using bare GC/Pt and modified GC/Pt/Pty electrodes. Preparation of reference standard serum samples of uric acid assays are carried out followed the procedures given by supplier (Sigma Chem. Co.). Determination of uric acid in the reference samples was conducted without pretreatment, except dilution of the samples in 4% Li2CO3 solution. The aliquot (100 µL) were injected into 10 mL phosphate buffer solution containing of 4% Li2CO3(0.05 M, pH 6.0) and the steady current responses were measured. The hydrogen peroxide produced by the catalytic reaction of the UOx enzyme was oxidized at the electrode by applying a constant potential of 0.6 V vs. Ag/AgCl. The current produced is related to the concentration of the uric acid in the sample. Prior to addition of the analyte, the background current was allowed to settle to a constant baseline in phosphate buffer solution (0.05 M, pH 6.0). Additions of analyte were then made from a stock solution. After each addition, the solution was gently stirred for five seconds. The current was monitored continuously and further analyses were made once the current reached a steady signal. Determination of uric acid in the reference samples were also conducted by using standard UV-vis spectrophotometry method with modification of the procedure for uric acid [23]. The samples were reacted with enzyme uric oxidase, followed by addition ofo-dianisidine (5 mM) into the mixture and catalysed by peroxidase, and finally
determied at λ 520.
Optimization procedures
Optimization procedures to obtain the best current signal for the biosensor have been conducted by using
uric acid standard solution. The best condition for one parameter was kept to optimize other experimental parameters [24]. Various types of buffer solutions such as acetate, phosphate, and trisma buffer have been investigated to obtain the best solution for uric acid biosensor. The concentration range (0.1–100 mM) at different pH (5.0–7.5) of buffer solutions have been investigated. The influence of solubilising agents of (1– 10%) Li2CO3has also been evaluated.
Interference studies
To evaluate the capability of polytyramine membrane film to reject the response from interfering agents, the response currents of 1 mM uric acid was measured separately in solutions containing each of potential interfering agents of (1 mM) ascorbic acid, amino acid, glucose, fructose, cholesterol, nitrite, and phosphate. The responses current of interfering agents alone and the mixture solutions of uric acid and interference were monitored by using of the electrodes constructed at 5 sweep cycles.
RESULT AND DISCUSSION
Electropolymerization of Polytyramine and the Effect of Membrane Film
Electropolymerization of polytyramine from aqueous tyramine solution containing enzyme produced thin and transparent membrane film that was strongly attached onto the electrode surface similar to those observed with other biosensor [25]. The voltammogram of the cyclic voltammetry (CV) for the electrodeposition of polytyramine from tyramine solution contains UOx is presented in Fig. 1. As the number of cycles increased, electrodeposition current decreased due to the poor conductivity of the polytyramine films deposited in the electrode surface. After several cycles, the electrode was sufficiently blocked such that only very low oxidation currents were observed. The amount of polytyramine deposited at each voltammetric cycle was calculated from the charge passed during electropolymerization as summarized in Table 1.
Fig 1. Cyclic voltammograms for electrodeposition of polytyramine on to platinized glassy carbon electrode at a scan rate of 0.5 V s-1 vs Ag/AgClin 0.1 M tyramine dissolved in 0.05 M phosphate buffer, pH 6.0 containing uric oxidase. The numbers on the curves indicate the cycle number
Fig 2. Calibration plots for uric acid biosensors as a function of the number of voltammetric cycles for which the polytyramine films were grown on the surface of electrodes. Electropolymerization were conducted at
(▲) one sweep cycle (O) 3 Sweep cycles, () 5 sweep cycles, () 7 sweep cycles and (Ж) 10 sweep cycles. Other parameters are shown in Fig. 1
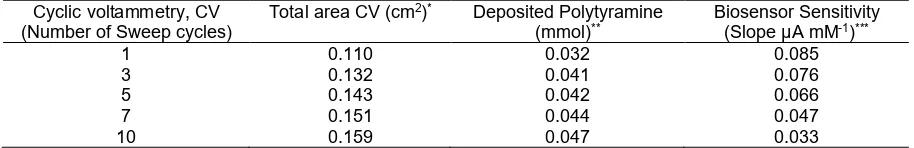
Table 1.Properties of enzyme electrodes and their sensitivity when using electrodeposited polytyramine at different thickness of membrane layers with increasing voltammetry cycles
Cyclic voltammetry, CV (Number of Sweep cycles)
Total area CV (cm2)* Deposited Polytyramine
(mmol)**
Biosensor Sensitivity (Slope µA mM-1)***
1 0.110 0.032 0.085
3 0.132 0.041 0.076
5 0.143 0.042 0.066
7 0.151 0.044 0.047
10 0.159 0.047 0.033
*Area was calculated by using hydrodynamic method with rotating disc electrode (RDE) **Calculated based on the current needeed during electropolymerization
***Sensitivity was calculated from calibration curve of uric acid standard solution
decreased as increasing the number of sweep cycle in the deposition of the polytyramine, and the slope of the uric acid responses of enzyme electrode was also decreased as the amount of the polytyramine film increased in the electrode surface. A lower current response observed at the thicker membrane film might be results from the ability of nonconducting polytyramine to exclude the uric acid from direct oxidation in the electrode surface, and the sensitivity only results from the detection of hydrogen peroxide produced on enzymatic oxidation of the uric acid. Examine further on enzyme electrode constructed at higher sweep cycles shown decrease in current sensitivity for 0.1 mM uric acid successively to 91%, 83%, 57%, and 40% at the biosensor constructed at 3, 5, 7 and 10 sweep cycles. The results have shown that electrode prepared at one sweep cycle gave the most sensitive response, followed by the thicker films with less sensitive response. However, since it is known that uric acid is oxidized on platinized electrode, then it is compulsory to protect direct oxidation of uric acid on the electrode surface by
using a thicker polytyramine membrane film. This strategy is also valuable to prevent the electrode from oxidation of other electroactive compounds in the electrode surface, but allowed the oxidation of hydrogen peroxide produced by the enzyme-catalyzed oxidation at the electrode [26]. Choosing a thicker membrane film with reasonable response sensitivity has to be compromised for the construction of uric acid biosensor. Therefore, with consideration of the sensitivity and the selectivity of the biosensor for uric acid, it is then the electrode constructed at five sweep cycles was then to be chosen for biosensor application for uric acid determination.
Uric Acid Biosensor Signal and Reproducibility of the Biosensor
Fig 3. Typical current-time curve of steady state current measurement for: (A) bare GC/Pt electrode, (B) modified coated GC/Pt/Pty electrode, and (C) an enzyme electrode GC/Pt/Pty/UOx, as a function of uric acid concentration for successive injection of (a) 0.0 mM, (b) 0.1 mM, (c) 0.5 mM, (d) 0.8 mM, (e) 1.0 mM, (f) 1.3 mM, (g) 1.5 mM, (h) 1.8 mM, (i) 2.0 mM, (j) 2.2 mM, and (k) 2.5 mM uric acid into phosphate buffer solution (0.05 M, pH 6.0) containing 4% Li2CO3. The membrane was coated five cycles in a solution of 0.1 M tyramine. Amperometric determination was performed at a constant potential of 0.6 VvsAg/AgCl. Other parameters are shown in Fig. 1
Fig 4.Calibration plots for uric acid biosensors obtained from the average of five enzyme electrodes made in the same way but on different days with different batches of reagents. Experimental parameters for the biosensor were shown in Fig. 3
Fig. 3. Low current from direct oxidation of uric acid on bare GC/Pt electrode surface was detected to increase when increasing the concentration of uric acid in phosphate buffer solution (0.05 M, pH 6.0) containing
4% Li2CO3(Fig. 3A). However, the current signal of uric acid standard solution was not observed in a modified electrode GC/Pt/Pty because polytyramine film excluded a uric acid from oxidation in the electrode surface (Fig. 3B). The ability of modified coated GC/Pt/Pty electrode to suppress the direct oxidation of uric acid is demonstrated. The current signal to the change in uric acid concentration was observed on the GC/Pt/Pty/UOx electrode is based on the formation of hydrogen peroxide results from enzymatic catalytic oxidation of uric acid (Fig. 3C). The results represent that the polytyramine film prevent direct oxidation of uric acid on the surface of electrode and allows the detection of the hydrogen peroxide to be preceded through the polytyramine membrane film [26]. Steady state currents from the oxidation of hydrogen peroxide that was produced from enzymatic catalytic reaction of uric acid were obtained within two minutes after injection of uric acid into electrochemical cell. The current response for the injection of uric acid increased linearly in proportional to the concentration of uric acid. The signal increased sharply 30 sec after the injection of uric acid sample, followed by a decrease in current peak until a steady state current for the oxidation of hydrogen peroxide were obtained within less than three minutes of the addition of uric acid.
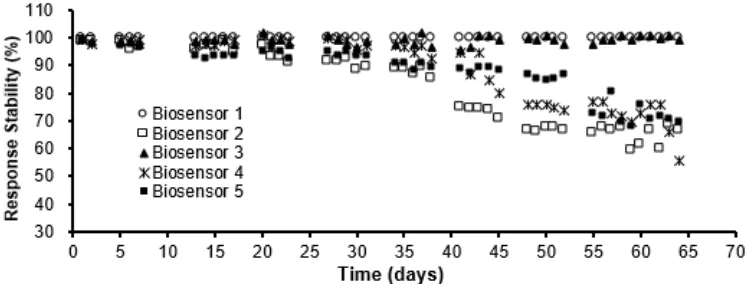
Fig 5. The stability of the uric acid biosensors for repeated measurements of uric acid standard solution, where
between measurements the biosensor was stored differently: (o) Biosensor 1 stored dry at room temperature, (□) Biosensor 2 stored in phosphate buffer pH 6.0 at room temperature, (▲) Biosensor 3 stored dry at 4 °C, (ӿ) Biosensor 4 stored in phosphate buffer pH 6.0 at 4 °C, (■) Biosensor 5 stored randomly in dry and wet condition at
room temperature and in the fridge at 4 °C. Other experimental parameters are as in Fig. 3
Optimization of Uric Acid Biosensor
Some experimental parameters that were affecting the biosensor performance were optimized such type of buffer solutions, the pH's, ionic strength, and solubilizing Li2CO3. The effect of pH on the biosensor has been investigated as the pH is known to be a critical parameter of enzymatic activity and stability in the biosensor application. The best current response was observed by using phosphate buffer solution (0.05 M, pH 6.0). The procedures for the preparation of uric acid standard solutions have been studied since uric acid is insoluble in water. Lithium carbonate (Li2CO3) is found to be an effective solubilizing agent for uric acid in aqueous solution. However, the ratio of the Li2CO3 has to be compromise between solubilizing the uric acid and interference to the enzyme activity in a basic condition at high concentration of Li2CO3. A concentration of 4% of Li2CO3 was chosen to be used in the experiment as it is not effected the activity of immobilized enzyme in the electrode. The best current response for uric acid determination accompanied by stable enzyme was obtained by using phosphate buffer solution (0.05 M, pH 6.0) containing 4% Li2CO3.
Stability of the Enzyme Biosensor
The stability of uric acid biosensor has been investigated to make sure that the biosensor is ready for commercialization purposes. It has been tested to store the electrode under various conditions, they are stored dry at room temperature and cold condition in the fridge at 4 °C, stored in buffer solution at room temperature and at 4 °C, and alters the stored conditions randomly in dry and wet condition at room temperature and cold conditions. The electrodes have been used to measure 0.1 mM uric acid standard solution repeatedly once a
day for long periods of time. The electrode is found stable with showed negligible loss of activity when store under the dry storage condition in the fridge (4 °C) for up to 3 months. The stability of the biosensor for repeated uses for long period of time under different storage system for fresh electrode is shown in Fig. 5. The stability of the biosensor vary depends on the storage system been applied to preserve the electrode in between measurements. Dry condition is the best condition to store uric acid biosensor. The activity of enzyme electrode was remain constant when the electrode was used to determine uric acid once a day and between measurements the biosensor stored at dry and room temperature conditions (Biosensor 1 and 3 in Fig. 5). These biosensors showed negligible loss of sensitivity after 45 days of storage, compared with a 1 day old biosensor. It showed decrease in response sensitivity about 3% compare to the sensitivity of a fresh enzyme electrode was observed after storing the electrode 65 days. The activity of enzyme electrode was loss rapidly when the electrode is stored at wet conditions (see illustration for Biosensor 2, 4 and 5 in Fig. 5).
Selectivity of Uric Acid Biosensor
Table2.Response of the uric acid biosensor to 1 mM uric acid mixed with 1 mM potential interfering agents for the electrodes constructed at 5 sweep cycles. Other experimental parameters are as in Fig. 3
No Potential Interfering agents (1 mM)
Current response of uric acid biosensor (mA)
Interference alone (1 mM) Mixture of 1 mM uric acid and 1 mM interference Δi(mA)*
1 Uric acid 0.083 0.083 0.000
2 Ascorbic acid 0.021 0.084 0.001
2 Amino acid 0.001 0.083 0.000
3 Glucosa 0.000 0.083 0.000
4 Fructosa 0.000 0.083 0,000
5 Cholesterol 0.000 0.083 0.000
6 Nitrit (NO2-) 0.001 0.083 0.000
7 Phosphate (PO43-) 0.001 0.083 0.000
*Current valuei(mA) form the mixture of uric acid and interferencei(mA) uric acid standard solution
Table 3. The analysis of uric acid in reference serum control solutions and uric acid standard solutions by two methods, the uric acid biosensor and the standard UV-Vis spectrophotometry method, and compared with the uric acid values from factory. The values are the averages from three measurements
Reference Standard Sample (Sigma Co.)
Uric acid (mM) Recovery (%)****
Label* Spectrophotometry UV-Vis** Biosensor*** Standard method Biosensor
Accutrol Serum Normal 0.0327 0.0315±0.0008 0.0333±0.0001 96 102
Accutrol Serum Elevated 0.0518 0.0490±0.0007 0.0520±0.0004 95 100
Uric acid standard 1 0.0291 0.0291±0.0008 0.0296±0.0003 100 102
Uric acid standard 2 0.0333 0.0316±0.0031 0.0339±0.0001 95 102
Uric acid standard 3 0.0345 0.0339±0.0017 0.0349±0.0003 98 101
Uric acid standard 4 0.0327 0.0320±0.0023 0.0335±0.0001 98 102
*The content of uric acid obtained from supplier (Sigma Chem.Co.)
**Spectrophotometry method was conducted by usingo-dianisidine at λ520 nm ***Biosensor was conducted at a constant potential E = 0.60 mVvs.Ag/AgCl ****Calculated by comparing the results with the assigned value
interfering agents in 1 mM uric acid did not interfered current response of the uric acid. The selectivity of the biosensor was enhanced by the use of polytyramine matrix. Polytyramine membrane film was able to exclude electroactive species not to be oxidized in the electrode surface and thus improve measurement accuracy. The results has showed that the biosensor free from interference, and believed that the response current are mainly obtained from hydrogen peroxide resulted from enzymatic catalytic reaction of uric acid.
Accuracy of Uric Acid Biosensor
The accuracy of uric acid biosensor was evaluated by comparing the measured uric acid concentration resulted from the biosensor with the assigned values in reference serum control solutions and uric acid standard solutions. The concentrations of uric acid in the reference control serum and uric acid standard solutions determined by the biosensor were lies within the range of the assigned values given by supplier (Table 3). The amount of uric acid in reference standard samples was also determined by using the biosensor and the standard UV-Vis spectrophotometry method, and it gave very good correlation (r = 0.994). The result reveals a close agreement between the developed biosensor and the standard spectrophotometry method. The results are
also demonstrated that uric acid concentration that are provided by the biosensor method and the standard UV-Vis spectrophotometry are all agreed with the real uric acid value contained in the reference standard samples. It confirms that the biosensor method meets the rigid demands expected for uric acid in the samples. The recovery of the biosensor and standard spectrophotometry method were compared, where the recovery with the biosensor are all higher than that the standard method (Table 3). Higher recovery obtained by the biosensor are believed due to the accuracy of the measurements since the biosensor are free from interference, while the assigned value given by the supplier are obtained by using standard spectrophotometric method that is subjected to interference.
CONCLUSION
compatible in the production of reproducible biosensor due to ability control of the charge passed during electrodeposition to precisely govern the thickness of the film grown on the electrode surface. The biosensor showed a sensitive response to uric acid with a linear calibration curve lies in the concentration range of 0.1– 2.5 mM, slope 0.066 µA mM-1, and the limit detection was 0.01 mM uric acid (S/N = 3). The biosensor has good stability for repeated measurements when it stored at dry condition. Uric acid biosensor free from normal interference due to capability of the polytyramine membrane film to exclude electroactive species and interfering agents to be oxidized in the electrode surface. The biosensor has been confirmed to be accurate where the concentration of uric acid in reference serum control solutions and uric acid standard solutions were similar to the assigned value given by the factory. The amounts of uric acid in the reference samples obtained by the biosensor are in agreement with the values obtained by the standard UV-Vis spectrophotometric method with correlation coefficient of 0.994.
ACKNOWLEDGEMENT
This work was supported by Directorate Research and Community Service, Directorate General Strengthen Research and Development, Ministry of Research, Technology and Higher Education of the Republic of Indonesia, UnderPenelitian Tim Pascasarjana, Contract No.045A/UN33.8/LL/2017.
REFERENCES
[1] Jin, M., Yang, F., Yang, I., Yin, Y., Luo, J.J., Wang, H., and Yang, X.F., 2012, Uric acid, hyperuricemia and vascular diseases,Front. Biosci., 17, 656–669. [2] Rock, K.L., Kataoka, H., and Lai, J.J., 2013, Uric
acid as a danger signal in gout and its comorbidities,Nat. Rev. Rheumatol., 9 (1), 13–23. [3] Johnson, R.J., Nakagawa, T., Jalal, D.,
Sánchez-Lozada, L.G., Kang, D.H., and Ritz, E., 2013, Uric acid and chronic kidney disease: which is chasing which?, Nephrol. Dial. Transplant., 28 (9), 2221– 2228.
[4] Mehta, T., Nuccio, E., McFann, K., Madero, M., Sarnak, M.J., and Jalal, D., 2015, Association of Uric Acid with vascular stiffness in the Framingham Heart Study,Am. J. Hypertens., 28 (7), 877–883. [5] Hsu, P.F., Chuang, S.Y., Cheng, H.M., Sung, S.H.,
Ting, C.T., Lakatta, E.G., Yin, F.C., Chou, P., and Chen, C.H., 2013, Associations of serum uric acid levels with arterial wave reflections and central systolic blood pressure, Int. J. Cardiol., 168 (3), 2057–2063.
[6] Ficociello, L.H., Rosolowsky, E.T., Niewczas, M.A., Maselly, N.J., Weinberg, J.M., Asheingrau, A., Eckfeldt, J.H., Stanton, R.C., Galecki, A.T., Doria, A., Warram, J.H., and Krolewski, A.S., 2010, High-normal serum uric acid increases risk of early progressive renal function loss in type 1 diabetes,Diabetes Care, 33 (6), 1337–1343. [7] Jankowska, D.A., Trautwein-Schult, A., Cordes,
A., Bode, R., Baronian, K., and Kunze, G., 2015, A novel enzymatic approach in the production of food with low purine content using Arxula adeninivorans endogenous and recombinant purine degradative enzymes,Bioengineered, 6 (1), 20–25.
[8] Vasilevsky, A.M., Gerasimchuk, R.P., Zemchenkov, A.Y., Konoplev, G.A., Rubinsky, A.V., Stepanova, O.S., and Frorip, A.A., 2015, Dual-wavelength optoelectronic sensor for monitoring uric acid concentration in dialysate,
Biomed. Eng., 49 (3), 125–128.
[9] Numnuam, A., Thavarungkul, P., and Kanatharana, P., 2014, An amperometric uric acid biosensor based on chitosan-carbon nanotubes electrospun nanofiber on silver nanoparticles,
Anal. Bioanal. Chem, 406 (15), 3763–3772. [10] Zhang, Y., Yan, M., Gao, P., Jiang, J., Zhang, G.,
Li, J., and Shuang, S., 2015, Immobilization of uricase-gold nanoparticles composite nanomaterial on a biofilm and its application to determination of uric acid, Appl. Biochem. Microbiol., 51 (4), 470–478.
[11] Liu, X., Wei, S., Chen, S., Yuan, D., and Zhang, W., 2014, Graphene-multiwall carbon nanotube-gold nanocluster composites modified electrode for the simultaneous determination of ascorbic acid, dopamine, and uric acid, Appl. Biochem. Biotechnol, 173 (7), 1717–1726.
[12] Ghodsi, J., Rafati, A.A., and Shoja, Y., 2016, First report on hemoglobin electrostatic immobilization on WO3 nanoparticles: Application in the simultaneous determination of levodopa, uric acid, and folic acid, Anal. Bioanal. Chem., 408 (14), 3899–3909.
[13] Chauhan, N., Kumar, A., and Pundir, C.S., 2014, Construction of an uricase nanoparticles modified Au electrode for amperometric determination of uric acid, Appl. Biochem. Biotechnol., 174 (4), 1683–1694.
[14] Hall, E.A.H., 1991, Biosensor, Prentice Hall, Englewood Cliffs, New Jersey.
[15] Arora, K., Choudhary, M., and Malhotra, B.D., 2014, Enhancing performance of uricase using multiwalled carbon nanotube doped polyaniline,
[16] Lupu, S., Lete, C., Balaure, P.C., Caval, D.I., Mihailciuc, C., Lakard, B., Hihn, J.Y., and del Campo, F.J., 2013, Development of amperometric biosensors based on nanostructured tyrosinase-conducting polymer composite electrodes,Sensors, 13 (5), 6759–6774.
[17] Yoon, H., 2013, Current trends in sensors based on conducting polymer nanomaterials, Nanomaterials, 3 (3), 524–549.
[18] Situmorang, M., Gooding, J.J., and Hibbert, D.B., 1999, Immobilisation of enzyme throughout a polytyramine matrix: A versatile procedure for fabricating biosensors, Anal. Chim. Acta, 394 (2-3), 211–223.
[19] Sinaga, M., and Situmorang, M., 2015, Sensor spektrofotometri untuk penentuan pengawet nitrit,
Indonesian Patent, Application No P00201508158. [20] Situmorang, M., 2010, Kimia Analitik Lanjut dan
Instrumentasi, FMIPA UNIMED Publisher, Indonesia.
[21] Sinaga, M., Naibaho, R.T., and Situmorang, M., 2013, Rancang bangun sensor kimia dalam deteksi spektrofotometri untuk penentuan pengawet nitrit,
Semirata, 1 (1), 251–254.
[22] Situmorang, M., and Nurwahyuni, I., 2013, Biosensor elektrokimia untuk penentuan asam urat,
Indonesian Patent, Application No. P00201304727.
[23] Situmorang, M., Silitonga, P.M., Nurwahyuni, I., Siregar, L.S., and Purba, R., 2012, Pengembangan metode analisis spektrofotometry untuk penentuan kolesterol di dalam makanan tradisional,Jurnal Saintika, 12 (2), 90–97.
[24] Sihombing, E., Situmorang, M., Sembiring, T., and Nasruddin, 2015, The development of mercury ion selective electrode with ionophore 7,16-Di-(2-
methylquinolyl)-1,4,10,13-tetraoxa-7,16-diazacyclooctadecane (DQDC),Modern Appl. Sci., 9 (8), 81–90.
[25] Situmorang, M., and Nurwahyuni, I., 2013, Amperometric biosensor for the determination of cholesterol in traditional food samples,Proceeding of The 2nd International Conference of the
Indonesian Chemical Society, UII Yogyakarta, Indonesia, 22-23thOctober 2013, 91–99.
[26] Situmorang, M., Hibbert, D.B., Gooding, J.J., and Barnett, D., 1999, A sulfite biosensor fabricated using electrodeposited polytyramine: Application to wine analysis,Analyst, 124 (12), 1775–1779. [27] Situmorang, M., 2012, The development of