Consideration of Road Management from the View Points of Long-
and Short-
Distance Road User’s Satisfaction
Wardhana, A.P.1, Ishibashi, K.1, and Kiyota, M.1
Abstract: This study observed long- and short-distance road user satisfaction with national road infrastructure in order to direct future road management strategies. The research was a quantitative research method using questionnaire translated into the Japanese Language. The questionnaires were distributed to 2000 road users of two national roads in Saga, Japan. A five-point Likert scale was used to measure road user satisfaction, then the data were analyzed using stepwise regression. Based on regression model, long- and short-distance road user satisfactions were both affected by two same elements (road surface and road facilities).The availability of sidewalks mostly affected short-distance road user satisfaction. On the other hand, the smoothness of road surface was more considered by long-distance road user. Considering the findings, existing problems of inappropriate-infrastructure quality can be addressed to help
satisfy user’s expectations.
Keywords: Road user satisfaction, road infrastructure, road management.
_
Introduction
The Japanese government has emphasized on road construction [1]. In fact, until 2000, Japan had about 1.166 million km of roads: 6.600 km motorways, 21.800 km national roads (managed by Ministry of Land, Infrastructure, Transport and Tourism, MLIT), 32.000 km national roads (managed by prefecture), 128.200 km regional roads, and 977.800 km other roads [2]. However, it is essential to maintain road infrastructure and at the same time continue to provide a level of service that will satisfy road user. Conventional road repair and main-tenance is to mend only damaged parts and areas of roads when they were found during inspections [1]. The Japanese government has a road management system to maintain their road infrastructure, called PDCA (Plan, Do, Check, and Action) [3]. But lack of communication between the government and the road user causes hindrance to the road management to be implemented effectively [1, 3]. One of the key elements of road management is thus community and road user involvement [4].
The road user as a taxpayer should therefore also be involved in management of road infrastructure. On the other hand the local government is able to
maintain road infrastructure using tax payer’s
money.
1 Department of Engineering Systems and Technology, Saga University, JAPAN.
E-mail: [email protected]
Note: Discussion is expected before November, 1st 2011, and will be published in the “Civil Engineering Dimension” volume 14, number 1, March 2012.
Received 1 February 2011; revised 12 August 2011; accepted 17 August 2011.
Thus understanding customer requirements is essential in ensuring customer satisfaction, and the demand for construction products should therefore be viewed in relation to their intended use [5].
Satisfaction is the expectation of products’ perfor -mance purchased and used in accordance to its performance [6]. Related to the road infrastructure, satisfaction is a post-use evaluation in which the use of road infrastructure meets what is expected, while dissatisfaction is complaints to the provider of road infrastructure. Measuring customer satisfaction has further benefits such as; improvement in commu-nication between parties, enabling mutual agree-ment, evaluation of progress towards a goal, and monitoring of accomplished results and changes [7,8]. Customer orientation, communication skills, and responses to complaints, all play an important role in the overall satisfaction of the customer in the construction industry [9]. Accordingly, road user satisfaction is an important factor in the develop-ment of the road managedevelop-ment for better road infrastructure. A provider should therefore perio-dically measure road user satisfaction in order to learn how satisfied road users really are. On understanding which attributes affect road user satisfaction, the challenge is then to modify the current condition in a way that will lead to maximum road user satisfaction.
Limited research related to the study of road user
satisfaction was done in Japan. To the authors’
The main goal of this research therefore is to present an alternative method aimed at defining short- and long-distance road user’s satisfaction with national road infrastructure. Based on this goal, the following research objectives were formed:
To develop a model of road user satisfaction with road infrastructure based on short- and long-distance road user groups.
To identify those items in each group that has a strong correlation with overall satisfaction.
Methods
Questionnaire
The road user satisfaction research was based on the quantitative research method of surveying with a questionnaire. To develop a questionnaire, the authors benchmarked with the Tokyo Metropolitan Highway Questionnaire [10] and incorporated Guidance of International Road Federation (IRF) [11]. Questionnaires translated into the Japanese Language were distributed to 2000 road users (drivers and passenger) in Saga Prefecture, Japan. The National Route-203 (referred to hereafter as NR-203) and National Route-35 (NR-35) were selected for distribution of the questionnaire. These two roads have specific characteristics. NR-203 connects Saga city and Karatsu city, both of which are in Saga Prefecture, while NR-35 connects Saga city and Nagasaki city, which lies in Nagasaki prefecture. On NR-203, Kyuragi roadside station was chosen to distribute 1000 questionnaires, while on NR-35 the Yamauchi roadside station to deploy another 1000 questionnaires.
The questionnaire was divided into 3 categories; 1. Characteristics of the respondents: sex, age,
category of respondent (driver or passenger), purpose of travel, vehicle category, frequency of travel, main utility of time, whether or not they know the phone numbers for the customer service officer of Saga construction and emer-gency services [10].
2. Main questions, reported using the 5-point Likert scale (highly dissatisfied, somewhat dissatisfied, neither satisfied nor dissatisfied, somewhat satisfied, and highly satisfied), consisting of 27 satisfaction questions divided into six categories: road safety facilities, road surface, travel time, roadside station/service areas, government service level, and overall satisfaction [10,11]. 3. Route and the unsatisfactory section questions.
Respondents were asked about which routes they have used and which areas of the road they considered unsatisfactory.
Data Analysis
The Statistical Package for Social Science (SPSS) version 17 was used for data entry, the validity test,
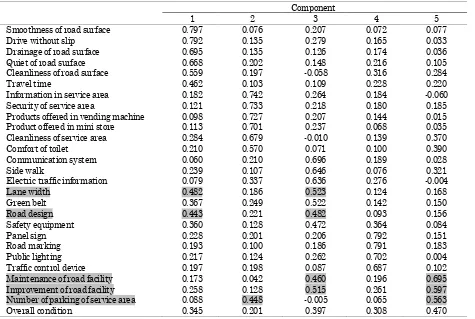
was determined using Principal Component Analy-sis (PCA) [13]. From the results of the PCA, six items were removed from the questionnaire instrument because they demonstrated poor communality value (<0.5) and factor loading of component (0.40 or greater on more than one component or demonstrated complex structure) as shown in Tables 1 and 2. The item that has communality value <0.5 is travel time and the item that have factor loading of component 0.4 or greater on more than one component are: 1) road design, 2) lane width, 3) the number of parking spaces in service areas, 4) maintenance of the road surface and 5) improve-ments of road facilities. After the validity test, the questionnaire subsequently comprised of 21 items.
The total length of NR-203 is 34 km and of NR-35 is 26.5 km. The road users were divided into two categories, those who traveled for a short distance of less than 8 km, and second, those who traveled for a long distance of more than 8 km.
The t-test was conducted to assess whether the means of road user satisfaction between short- and long-distance road users are statistically different from each other. Differences with a probability value of less than alpha level (0.05) are considered significant [12, 14].
The stepwise regression procedure was used to develop a road user satisfaction model. This procedure is better than the forward selection and the backward elimination procedures, because it considers more relevant models [15].
Table 1. Communalities (27 question items)
Extraction
Road marking 0.741
Panel sign 0.786
Public lighting 0.624
Traffic control device 0.568
Communication system 0.569
Electric traffic information 0.601 Safety equipment
Side walk Road design Lane width Green belt
Smoothness of road surface Drive without slip
Drainage of road surface Cleanliness of road surface Quiet of road surface Travel time
Number of parking of service area Cleanliness of service area Comfort of toilet
Security of service area Information in service area Product offered in mini store Products offered in vending machine Maintenance of road facility Improvement of road facility
The data set of Y (independent variable) was used to represent overall satisfaction and X (dependent variable) consisted of 20 items. Pearson correlation was used to identify the correlation between two variables. Pearson correlation coefficient of zero means there is no correlation, and a value of one and minus one means that there is a perfect correlation [12].
Results
Responses were received from 415 of 1000 questionnaire in NR-203 giving a response rate of 41.5%, while in NR-35, 385 of 1000 questionnaire, a respondent rate of 38.5%. Some 139 responses were excluded because they have a lot of unanswered question, giving the total proper questionnaire responses of 661.
Characteristics of Respondents
Table 3 shows the purposes of traveling in the short- and long-distance road user groups. A significant difference was observed. Shopping was the most common reason for traveling in the short-distance group (58.4%), while business trips (40.7%) followed by sightseeing (24.9%) were the most common in the long-distance group.
Table 3. Purpose of traveling
Short-distance Long-distance
n % n %
Commute to work/school 17 7.4 10 2.3 Logistic transportation 5 2.2 12 2.8
Business 40 17.3 175 40.7
Shopping 135 58.4 74 17.2
Sightseeing/touring/leisure 21 9.1 107 24.9
Taxi 0 0.0 1 0.2
Others 13 5.6 51 11.9
SUM 231 100.0 430 100.0
The Unsatisfactory Section
Respondents were asked to mark on the route picture, which one the unsatisfactory section as far as they are concerned. The unsatisfactory section was mapped as shown in Figure 1 and Figure 2. Numbers in Figure 1 and 2 correspond to ranks in Table 4 and 5 respectively. Some respondent made a comment in the questionnaire, such as: NR-203
there is “a bad drainage when rainy between Iwaya
and Machikiri” and in NR-35 there is “anarrow road
in section between Chikusan Shikenjou and Kuakoba”.
Table 2. Rotated Component Matrix (27 question items)
Component
1 2 3 4 5
Smoothness of road surface 0.797 0.076 0.207 0.072 0.077
Drive without slip 0.792 0.135 0.279 0.165 0.033
Drainage of road surface 0.695 0.135 0.126 0.174 0.036
Quiet of road surface 0.668 0.202 0.148 0.216 0.105
Cleanliness of road surface 0.559 0.197 -0.058 0.316 0.284
Travel time 0.462 0.103 0.109 0.228 0.220
Information in service area 0.182 0.742 0.264 0.184 -0.060
Security of service area 0.121 0.733 0.218 0.180 0.185
Products offered in vending machine 0.098 0.727 0.207 0.144 0.015
Product offered in mini store 0.113 0.701 0.237 0.068 0.035
Cleanliness of service area 0.284 0.679 -0.010 0.139 0.370
Comfort of toilet 0.210 0.570 0.071 0.100 0.390
Communication system 0.060 0.210 0.696 0.189 0.028
Side walk 0.239 0.107 0.646 0.076 0.321
Electric traffic information 0.079 0.337 0.636 0.276 -0.004
Lane width 0.482 0.186 0.523 0.124 0.168
Green belt 0.367 0.249 0.522 0.142 0.150
Road design 0.443 0.221 0.482 0.093 0.156
Safety equipment 0.360 0.128 0.472 0.364 0.084
Panel sign 0.228 0.201 0.206 0.792 0.151
Road marking 0.193 0.100 0.186 0.791 0.183
Public lighting 0.217 0.124 0.262 0.702 0.004
Traffic control device 0.197 0.198 0.087 0.687 0.102
Maintenance of road facility 0.173 0.042 0.460 0.196 0.695
Improvement of road facility 0.258 0.128 0.515 0.261 0.597
Number of parking of service area 0.088 0.448 -0.005 0.065 0.563
1
2 3
4 5 3 4
The unsatisfactory road section
Figure 1. The mapping of the unsatisfactory road section in NR-203
Table 4. The unsatisfactory road section in NR-203
Section Frequency Rank
Iwaya – Machikiri 13 1
Makise IC – Azamihara 8 2
Hamashiro – Iwaya 6 3
Yamamoto – Yamamoto. K 6 3
Utsubogi – Makise 5 4
Kawaharabashi – Yamamoto 5 4
Machikiri – Utsubogi 4 5
y 4 2
5
1 3 3
5
The unsatisfactory road section
Figure 2. The mapping of the unsatisfactory road section in NR-35
Table 5. The unsatisfactory road section in NR-35
Section Frequency Rank
Nagao – Shimo Nishiyama 17 1
Izumiyama - Karitate 9 2
Kuakoba - Izumiyama 7 3
Ogoshi – Point of Ogoshi and 104 line 7 3 Point of Ogoshi and 104 line - Nagao 6 4
Imariguchi - Mishirobashi 3 5
Tanoura – Jin Nouchi 3 5
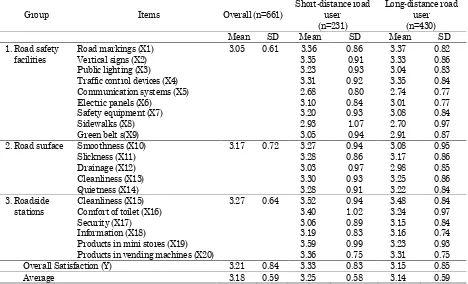
Descriptive Statistic
Table 6 demonstrates the results of the road user satisfaction scores, including the effect of travel distance. From the results, it can be concluded that the overall road user satisfaction rating was in the range of neither satisfied nor dissatisfied and
t -test Results
It can be seen from Table 6 that the mean of road user satisfaction for short-distance road user (3.25±0.58) was higher than that for long-distance road user (3.14±0.59) in condition; degree of freedom, df = (231+430) – 2 = 659, t(659) = 2.11, p=0.035, critical alpha level at 0.05.
Stepwise Regression
Stepwise regression was used for calibration model, and selected model were determined by the high determination coefficient, R2, statistic parameter T bigger than t-Table and p<0.05. Results are shown in Tables 7, 8, and 9.
For short-distance, R2 = 0.427 means that 42.7% of the variation of Y explained by the regressors X8, X12, X16, and X13. The correlation coefficient, r is 0.654, indicating a moderate positive linear relationship between dependent variable, Y and independent variable, X. F-Stat = 37.459 > F-Table = 2.417; t-Stat A = 4.723, X8 = 5.356, X12 = 3.361, X16 = 3.267, X13 = 2.921 > t-Table = 2.132.
And for long-distance, R2 = 0.523 means that 52.3% of the variation of Y explained by the regressors X10, X8 and X17. The correlation coefficient, r is 0.723, indicating a moderate positive linear relationship between Y and X. F-Stat = 142.686 > F-Table = 2.033; t-Stat A = 3.183, X10 = 10.065, X8 = 7.972, X17 = 7.791 > t-Table = 1.895.
The Model
1. The regression equation for short-distance road user was
Y = 0.970 + 0.252X8 + 0.190X12 + 0.152X16
+ 0.161X13 Where:
Y = Overall satisfaction
X8 = Satisfied with the availability of sidewalks X12 = Satisfied with the drainage of road surface X16 = Satisfied with the comfort of toilet
X13 = Satisfied with the cleanliness of road surface
2. The regression equation for long-distance road user was
Y = 0.439 + 0.338X10 + 0.268X8 + 0.296X17 Where:
Y = Overall satisfaction
X10 = Satisfied with the smoothness of the road surface
X8 = Satisfied with the availability of sidewalks X17 = Satisfied with the security of service areas
Notes: Satisfied with the road facilities
Table 7. Model Summary a. Predictors: (Constant), X8, X12, X16, X13
b. Predictors: (Constant), X10, X8, X17
Table 8. ANOVAc a. Predictors: (Constant), X8, X12, X16, X13 b. Predictors: (Constant), X10, X8, X17 c. Dependent Variable: Y
Short-distance road user satisfaction was affected by X8 (satisfied with the availability of sidewalks), X12 (satisfied with the drainage of road surface), X16 (satisfied with the comfort of toilet) and X13 (satisfied with the cleanliness of road surface). While long-distance road user satisfaction was affected by X10 (satisfied with the smoothness of the road authors conclude that there is no collinearity within data. To calculate the average VIF, one can simply add the VIF values for each predictor and divide by the number of predictors, k:
The average VIF is close to 1 and this confirms that collinearity is not a problem for these models.
Pearson Correlation
As shown in Table 10, the strongest positive correlation for short-distance road user was satisfied with the availability of sidewalks, X8 and overall satisfaction (r = 0.531, p = 0.000). And the strongest positive correlation for long-distance road user was satisfied with the smoothness of the road surface, X10 and overall satisfaction (r = 0.557, p = 0.000). Table 6. Mean and Standard Deviation (SD) of road user satisfaction scores and the effect of travel distance
Group Items Overall (n=661)
Short-distance road Traffic control devices (X4) Communication systems (X5) 2.Road surface Smoothness (X10)
Slickness (X11) Comfort of toilet (X16) Security (X17) Information (X18)
Products in mini stores (X19) Products in vending machines (X20)
Discussion
Preliminary Analysis
The t-test results indicated that between short- and long-distance road users are statistically different (P=0.035). This result suggested that road user satisfaction based on short- and long-distance road user could be used for the following analysis.
A Conceptual Model of Road User Satisfaction with Road Infrastructure
One can divide road infrastructure into two ele-ments, namely:
1. Road facilities, which refers to components designed, built or installed on the road and supporting the existing road. Such components consists of: road safety facilities (road markings, vertical signs, public lighting, traffic control devices, communication systems, traffic informa-tion, safety equipment, sidewalks) and roadside stations/service areas (parking areas, cleanliness of roadside stations, comfort of toilets, security of roadside stations, availability of information notices, minimarts, and vending machines) [10, 11].
2. Road surface, which refers to the existing con-ditions of the main elements of a roads infra-structure. Manifested in changes in the surface
the longitudinal and transversal unevenness of a road [16]. A vehicle with laser technology is commonly used to monitor a road’s surface condition. To evaluate road surface conditions in Japan the Maintenance Control Index (MCI) is used. Using the MCI, three concerns are evaluated: cracking, rutting, and evenness [2]. In this paper the road surface comprised of: smoothness, slickness, drainage, cleanliness, and the quietness of road surface.
Based on the above, a conceptual model of road user satisfaction with road infrastructure was created as shown in Figure 3.
Figure 3. A conceptual model of road user satisfaction with road infrastructure
There are interesting facts to be discussed in this study. First, road surface and road facilities elements had an important role for both groups (short- and long-distance road user). Second, short-distance road user more considered to X8 (satisfied with the availability of sidewalks), while long-distance road user more considered to X10 (satisfied with the smoothness of road surface).
Road surface is the main elements of road Table 9. Coefficientsa
Model
Unstandardized Coefficients
Standardized
Coefficients t Sig Collinearity Statistics
B Std. Error Beta Tolerance VIF
Short (<8 km) 4 (Constant) 0.970 0.205 4.723 0.000
X8 0.252 0.047 0.320 5.356 0.000 0.801 1.249
X12 0.190 0.057 0.220 3.361 0.001 0.662 1.510
X16 0.152 0.046 0.187 3.267 0.001 0.873 1.145
X13 0.161 0.055 0.183 2.921 0.004 0.723 1.383
Long (>8 km) 3 (Constant) X10
0.439 0.338
0.138
0.034 0.382
3.183 10.065
0.002
0.000 0.849 1.177
X8 0.268 0.034 0.308 7.972 0.000 0.819 1.221
X17 0.296 0.038 0.291 7.791 0.000 0.876 1.142
a. Dependent Variable: Y
Table 10. Correlation
X1 X2 X3 X4 X5 X6 X7 X8 X9 X10 X11 X12 X13 X14 X15 X16 X17 X18 X19 X20
Short X21 Pearson
Correlate .384** .362** .328** .325** .298** .317** .465** .531** .349** .499** .434** .496** .408** .463** .291** .335** .283** .270** .348** .324** Sig.
(2-tailed) .000 .000 .000 .000 .000 .000 .000 .000 .000 .000 .000 .000 .000 .000 .000 .000 .000 .000 .000 .000 N 228 228 222 225 223 222 226 223 227 227 228 225 229 228 229 229 228 228 229 228
Long X21 Pearson
Correlate .503** .538** .467** .431** .363** .461** .536** .533** .523** .557** .536** .426** .489** .537** .468** .443** .472** .378** .420** .321** Sig.
(2-tailed) .000 .000 .000 .000 .000 .000 .000 .000 .000 .000 .000 .000 .000 .000 .000 .000 .000 .000 .000 .000 N 427 428 424 428 410 421 424 422 422 428 426 425 428 426 427 426 427 426 427 426 **. Correlation is significant at the 0.01 level (2-tailed).
Overall satisfaction +
Satisfied with the road
facilities
water and adequately passing water under the road using natural channels [17]. During rainy day, the water on the road surface does not flow flawlessly, causing standing water in certain places. This is disturbing for travelers and can make a road slippery and dangerous. In addition, water concentrated on the road surface can accelerate erosion as well as wash off the surface material. Another item is the cleanliness of the road surface. More cleaning operation can remove dirt and dust from road way and prevent road user from slippery. The dirt could also obstruct water drainage.
The availability of sidewalks appeared in both regression models, suggesting improvements in sidewalk quality are needed. Almost all urban roads in Japan have a wide sidewalk with a dedicated barrier separating bicycle-pedestrian and vehicle access [18]. But on rural roads the sidewalks are narrow, and as a result, are often dangerous.
Another example, for both groups, satisfied with the roadside stations are needed, comfort of toilet and security of roadside stations were therefore the important items at roadside stations. Roadside stations, or michi-no-eki in Japanese, are rest areas located on ordinary highways, designed to support the smooth flow of road traffic and the current trend of increasing women, and senior [19]. Within their driving, sometimes they drop in roadside station to go to toilet, buying drink and food, or just taking a rest. So, comfort of toilet and security of roadside station are basic need for all of road user.
As shown in Table 3, daily shopping was the highest purpose for traveling among short-distance road user, indicating that the road user is a daily or high frequency user and live around roadway. Availability of sidewalk is important for them. The existing sidewalk space is not sufficient to accommodate pedestrian and bicyclist. To address safety of roadway for all road user, sidewalk should be placed along both sides and provide an all-weather walking surface, since they also serve bicyclist.
As shown in Table 3, business trips were the most common purpose for traveling among long-distance road user followed by sightseeing. They are therefore more likely to be able to experience the smoothness of road surface throughout the road way. Unevenness of a road surface can cause incon-venience for them. Pothole, gap of joint, cracking, rutting and patching are some of damage cause of unevenness of road surface [20]. Daily maintenance and preventive maintenance can preserve the smoothness of road surface [20].
Despite this research is the first quantitative study in Japan which measured road user satisfaction,
there was limitation that should be addressed. The authors collected questionnaire only in two routes of national road and two road users (driver and passenger). For further research, more number of routes and other road users (cyclists, motorcyclists, and pedestrians) will be needed to fulfill this limitation.
Conclusions
The existing condition of a road’s infrastructure from
the view points of short- and long-distance road user satisfaction should be an essential component of road management strategies aimed at maintenance or improvement. Both road user satisfaction groups were affected by two same elements (road surface and road facilities) within their driving experience. The availability of sidewalks mostly affected short-distance road user satisfaction. On the other hand, the smoothness of road surface was more considered by long-distance road user. This study suggested that road management should therefore concentrate some efforts on maintained road surface and improved road facilities in national road to increase road user satisfaction.
References
1. Shoichi, N., Road Asset Management, Approaches of Ministry of Land, Infrastructure and Trans-port, 2005, [Online] Available at http://www.jsce-int.org/civil_engineering/2005/8-1.pdf.
2. Masahide, I., Technical Standard for Pavement and Asset Management in Japan, The 12th
Conference on Public Works Research and Development in Asia, National Institute for Land and Infrastructure Management (NILIM), Octo-ber 2003.
3. Kiyoshi, M., Shintaro, T. and Akihiro, I., A study
on Road User’s Satisfaction Survey, Proceeding of Infrastructure Planning Study (in Japanese), 22 (2), 1999, pp. 307-310.
4. Robin, J.D., Management Structures Need Changing to Drive the Highway Business in the 21st Century, 1999, [Online] Available at http://
rru.worldbank.org/Documents/Toolkits/Highways /pdf/39.pdf.
5. Karna, S., Analyzing Customer Satisfaction and Quality in Construction, Nordic Journal of Survey-ing and Real Estate Research, 2 (special series), 2004, pp. 67-80.
di Surabaya (in Bahasa Indonesia), Dimensi Teknik Sipil, 4 (1), March 2002, pp. 30-38.
7. Burns, A. and Bush, R., Marketing Research, Fifth edition, Pearson Prentice-Hall, New Jersey, 2006.
8. Naumann, E. and Giel, K., Customer Satisfaction Measurement and Management: using the Voice of the Customer, International Thomson Publi-shing, USA, 1995.
9. Ahmed, S.M. and Kangari, R., Analysis of Client-Satisfaction Factors in Construction Industry, Journal of Management in Engineering, 11(2), 1995, pp. 36-42.
10.Tokyo Metropolitan Highway Questionnaire (in Japanese), [Online] Available at http://www. shutoku.jp.
11.International Road Federation, Maintenance of Road Signs, Markings and other Safety Assets: “A Cost Effective Means of Optimizing Road Safety”, IRF Publication, USA, 2006.
12.Field, A.P., Discovering Statistics using SPSS, Third edition, SAGE Publications Ltd, London, 2009.
13.Principal Component Analysis, [Online] Available at http://www.utexas.edu/courses/schwab/sw388r7/S olvingProblems/PrincipalComponentAnalysis_Ou tliers_Validation_Reliability.
14.The t-Test, [Online] Available at http://www. socialresearchmethods.net/kb/stat_t.php
15.Larsen, P.V, Selecting Regression Models, [Online] Available at http://statmaster.sdu.dk/courses/ st111/ module08/index.html.
16.Ruotoistenmaki, A., Seppala, T. and Kanto, A., Comparison of Modeling and Measurement Accuracy of Road Condition Data, Journal of Transportation Engineering, ASCE, 2006, pp. 715-721.
17.Gordon, K. and James, S., Drainage of Low-Volume Roads, Low-Volume Roads Engineering, 2003, [Online] Available at http://pdf.usaid.gov/ pdf_docs/PNADB595.pdf.
18.Alicandri, E., Hutton, P., Chrysler, S.T., Depue, L., Glassman, H.M., Granda, T.M., Harkey, D.L., Smith, T.J., Warhoftig, B.I., Older Road User, Summary Report, Department of Transportation, U.S., 2008.
19.Ministry of Land, Infrastructure, Transport and Tourism–Hokaido Regional Department Bureau, What is “Michi-no-eki”?, [Online] Available at http://www.hkd.mlit.go.jp/zigyoka/z_doro/station/ eng/index.html.