Correspondence Author:
Robiyanto Robiyanto: Tel./Fax.+ 62 298 321 212 E-mail:[email protected]
http://jurnal.unmer.ac.id/index.php/jkdp
THE ANALYSIS OF CAPITAL MARKET INTEGRATION IN
ASEAN REGION BY USING THE OGARCH APPROACH
Robiyanto Robiyanto
Department of Management Faculty of Economics and Business Satya Wacana Christian University
Jl. Diponegoro 52-60 Salatiga, 50711, Indonesia
ABSTRACT
Capital market integration is a topic that attracts a lot of research interests in regional and international capital markets. Unfortunately, the various studies that have been done tend to use analytical tools that have not been able to conclude the degree of capital market integration quantitatively, hence a study that is able to measure the degree of capital market integration quantitatively is required. This study investigated the capital markets integration in ASEAN by using the Orthogonal Generalized Autoregressive Con-ditional Heteroscedasticity (OGARCH) method which could provide the degree of inte-gration quantitatively. Capital markets studied were Indonesia Stock Exchange, Kuala Lumpur Stock Exchange, Thailand Stock Exchange, Singapore Stock Exchange and Phil-ippines Stock Exchange during period of January 2001 – December 2016. The result of this study was there was a co-movement among ASEAN capital markets studied, but not all these ASEAN capital markets were fully integrated. This study also found that Indo-nesia Stock Exchange, Kuala Lumpur Stock Exchange, Stock Exchange Thailand, and Singapore Stock Exchange were integrated but Philippines Stock Exchange was not. The Philippines Stock Exchange tended to be segmented rather than integrated.
ABSTRAK
Integrasi pasar modal merupakan topik yang menarik banyak perhatian peneliti di pasar modal secara regional maupun internasional. Sayangnya berbagai penelitian yang telah dilakukan cenderung menggunakan alat analisis yang belum mampu menyimpulkan derajat integrasi pasar modal secara kuantitatif sehingga diperlukan suatu penelitian yang mampu mengukur derajat integrasi pasar modal secara kuantitatif. Penelitian ini mengkaji integrasi pasar modal di kawasan ASEAN dengan menggunakan metode Orthogonal Generalized Autoregressive Conditional Heteroscedasticity (OGARCH) yang dapat menghasilkan derajat integrasi secara kuantitatif. Pasar modal yang dikaji adalah Bursa Efek Indonesia, Kuala Lumpur Stock Exchange, Stock Exchange Thailand, Singapore Stock Exchange dan Philipines Stock Exchange selama periode Januari 2001 – Desember 2016. Penelitian ini menemukan bahwa terdapat comovement pada pasar modal-pasar modal ASEAN yang dikaji, namun tidak semua pasar modal ini terintegrasi sepenuhnya. Penelitian ini juga menemukan bahwa Bursa Efek Indonesia, Kuala Lumpur Stock Exchange, Stock Exchange Thailand, dan Singapore Stock Exchange terintegrasi namun Philipines Stock Exchange tidak. Philipines Stock Exchange cenderung tersegmentasi daripada terintegrasi. Keywords:
ASEAN, capital market integration, Orthogonal Generalized Autoregressive Conditional Heteroscedasticity (OGARCH), Principal
Component Analysis (PCA)
JEL Classification: G11, G15
Kata kunci: ASEAN, integrasi pasar modal, Orthogonal Generalized Autoregressive Conditional Heteroscedasticity (OGARCH), Principal Component Analysis (PCA).
The integration of capital markets is an interest-ing topic for researchers in the stock market, so it is not surprising if there have been a lot of re-searches on the integration of capital markets that have been done either internationally (Mussa & Goldstein, 1993; Kearney & Lucey, 2004; Pukthuanthong & Roll, 2009; Mink, 2015) or re-gionally (Kim & McKenzie, 2008; Azad, 2009), that examine the integration of capital markets in Asia Pacific, Agyei-Ampomah (2011), that examine the integration of capital markets in Africa, Ameer (2006) and Arsyad (2015), that examine the capital markets in East Asia and South Asia. Meanwhile, for ASEAN region, there were many researchers who have conducted studies on the integration of financial markets and capital markets in this re-gion such as Volz (2013) who finds that the inte-gration of financial markets in ASEAN is still in the early stages, while Palac-McMiken (1997) finds that ASEAN capital markets in the period of 1987 to 1995 were integrated except for Indonesia.
The is also found by Roca et al. (1998), who state that all of the capital markets in the ASEAN region have interconnections except Indonesia. Meanwhile, Suryanta (2011) by using data from the post-crisis Asia (2004-2009) also found that capital markets in Indonesia do not have a comovement with the capital markets in ASEAN region, while the other capital markets have a comovement. On the contrary, some researchers such as Cheng et al. (2003), Click & Plummer (2005), and Karim & Ning (2013) who conducted a study on the ASEAN capital market integration by us-ing the data after the occurrence of the crisis in Southeast Asia even found that the five capital markets in the ASEAN (including Indonesia) are integrated with each other.
Those findings also reinforced by Majid & Kassim (2009) and Suganda & Soetrisno (2016). Both researches using data after the subprime cri-sis in 2008. Majid & Kassim (2009) found that ASEAN capital market integration is even
stron-ger following the 2008 subprime crisis. Karim & Karim (2012) and Suganda & Soetrisno (2016) even concluded that the integration of capital markets in ASEAN region even more integrated in the vari-ous crises occurred.
Various studies that have been conducted related to the integration of capital markets espe-cially for capital markets in the ASEAN region still tend to produce inconsistent findings. Further-more, these studies have not been able to conclude the integration degree of capital markets exam-ined conclusively. Based on those facts, so this study aimed to review the integration of capital mar-kets in ASEAN region using the Orthogonal Gener-alized Autoregressive Conditional Heteroscedasticity (OGARCH) method that were able to conclude the integration degree.
Bai (2011) states that the OGARCH method uses a Principal Component Analysis (PCA) to sum-marize the variation explanatory factors in the time series data and then used PCA covariance matrix to adjust the initial data of covariance matrix. The results of this OGARCH analysis will show the number of the total variation in the data that is able to be explained by each of the principle com-ponent (Alexander, 2001). In relation to the analy-sis of capital market integration, the greater the number of total variations that can be explained by the principle components will indicate the more integrated the capital markets are.
METHOD
The data were obtained from the Capital Market Statistics published by the Financial Services Au-thority/Otoritas Jasa Keuangan (OJK).
Orthogonal Generalized Autoregressive
Conditional Heteroscedasticity (OGARCH)
This study used the OGARCH method to analyse capital market integration. In the OGARCH model, time series data studied were linearly transformed into time series data that were not tied one another by using PCA (Luo, 2015). PCA was defined as a procedure that used the orthogonal changes in summarizing an impor-tant information content of a series of variables bound to each other into unrelated variables. According to Bai (2011), those new orthogonal variables were then called as principal components (PC) and the number of PC to be less than the num-ber of initial variables. Assume that K was the number of variables and M was the number of main components, M was expected to be less than K because it was expected that deviation from the data would be issued and could simplify the cal-culation.
Further, according to Alexander (2001), the number of major components used in the analysis would determine the accuracy of the calculations for PCA indicated the total number of variations in the initial data that could be explained by each of the main components. Thus in general, the prin-cipal component had to calculate the largest pos-sible variance and any variance that followed it was likely to be the highest variance by consider-ing the orthogonal of the precedconsider-ing components.
Estimation Model in OGARCH
If Y becomes the matrix T X k of the monthly return k of composite stock price index at T month, the monthly return can be calculated by using the natural logarithm of the next monthly closing of
composite stock price index divided by the monthly closing of composite stock price index. The formula is as follows:
ݕ
݅=
݈݃
ܲ݅+1ܲ݅
Where Pi is the monthly closing of compos-ite stock price index in period i.
The first step:
Standardizing the data into matrix XTX k with variance estimated and averaged for each yi and obtaining a correlation matrix XX’..
Step two:
Performing principal component analysis (PCA) on XX’to obtain eigenvalue vector and eigenvalue. Eigenvector matrix is denoted by L and its mth column with l m = (m 1, m,..., l k, m), 1 KX eigenvector associated eigenvalue O
m. So that this column becomes O
1>O2>...> Ok..
Third step:
Determining how many principal nents should be used. If the first principal compo-nent is selected, then the mth principal compocompo-nent of the system is:
p m = x 1 l 1,m + x 2 l 2,m + ... + x k l k,mpm = x 1 l 1, m + x 2 l 2, m +... + x k l k, m
Where xi is the ith column of the column X n, TXn matrix is then extracted from X. Thus, the prin-cipal component matrix of P is represented by TX n matrix and is obtained P = X n W n.
Fourth step:
Fifth step:
Conditional covariance matrix of X n is
ܦ
ݐ=
ܹ
݊ȭ
ݐܹ
݊ݐ and the conditional variancema-trix of Y is: ܪݐ =ξܸܦݐξܸ
Where ܹ݊ =ܮ݊݀݅ܽ݃(ඥߣ1, … ,ඥߣ݊
The accuracy of the conditional covariance matrix Vt from the original return is determined by how many components of n are selected to rep-resent the existing system.
RESULTS
Bai (2011) stated that the OGARCH tech-nique could work well in series of data that were
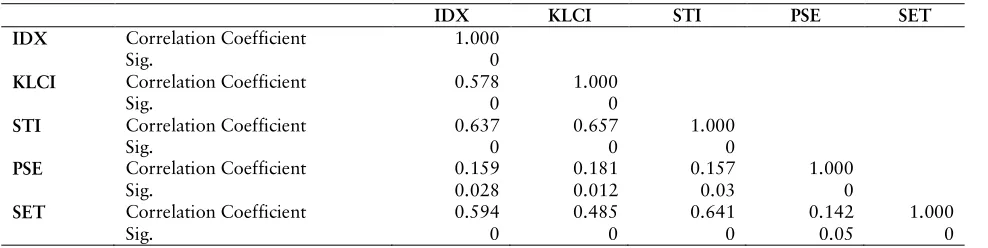
correlated with one another. Thus, before making the OGARCH analysis, correlation analysis for the capital markets in the ASEAN region examined in this study was required. In Table 1 below, it can be seen results of correlation analysis of ASEAN capital market returns.
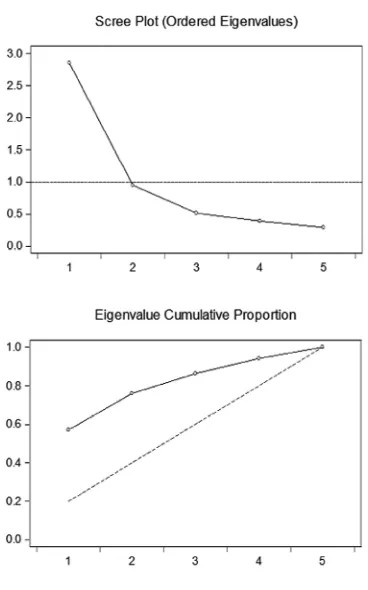
Based on Table 1, it can be seen that in gen-eral, the correlations of capital market returns in the ASEAN region studied in this research was significant therefore the OGARCH analysis was suitable for being applied on a series of data used in this study. Meanwhile, based on the OGARCH analysis result (which is combining GARCH and PCA) which had been done, it showed that the conditional variance of each capital market return in ASEAN region formed two main components. In detail, it can be seen in Table 2 and Table 3, whereas in Figure 1 it can be seen Ordered Eigen-value and EigenEigen-value Cumulative Proportion.
p
i, t=
ɂ
i, tߪ
݅2,ݐ=
߱
݅+
ߙ
݅߳
݅2,ݐെ1+
ߚ
݅ߪ
݅2,ݐെ1ȭ
ݐ=
݀݅ܽ݃
(
ߪ
1,2ݐ, …
ߪ
݊2,ݐ)Table 1. Correlation of Capital Market Returns in the ASEAN Region
Source: Capital Market Statistics, processed.
Table 2. Results of PCA analysis
Source: Capital Market Statistics, processed.
IDX KLCI STI PSE SET
IDX Correlation Coefficient 1.000
Sig. 0
KLCI Correlation Coefficient 0.578 1.000
Sig. 0 0
STI Correlation Coefficient 0.637 0.657 1.000
Sig. 0 0 0
PSE Correlation Coefficient 0.159 0.181 0.157 1.000
Sig. 0.028 0.012 0.03 0
SET Correlation Coefficient 0.594 0.485 0.641 0.142 1.000
Sig. 0 0 0 0.05 0
Principal
Component Eigenvalue
Cummulative
Value Proportion
Cummulative Proportion
1 2.854341 2.854341 0.5709 0.5709
Source: Capital Market Statistics, processed.
Principal component (PC) 1 had an eigen-value with eigen-value of 2.854. The proportion of PC 1 was 0.5709 which indicated that the five capital markets in ASEAN region had the same principal return variance explanatory. This PC 1 was even able to explain the 57.09% magnitude of variance inASEAN capital market returns. It showed that the five capital markets in ASEAN region had a same main risk factor and accounted for 57.09% to conditional variance of each capital market re-turn.
Meanwhile, the principal component (PC) 2 had eigenvalue of 0.9470 with a proportion of 0.1894. The second factor was able to explain 18.94% of the variance in the capital markets stud-ied. It indicated that there were other factors that had the same role in determining the number of variances on ASEAN capital markets studied. The risk factors of the second principal component ac-counted for 18.94% of conditional variance of each capital market return.
These two principal components were able to contribute as much as 76.03% in explaining the conditional variance of the capital market returns in ASEAN region. In the context of capital market integration, this finding also implied that there were 76.03% of the same factors that could affect the capital markets in ASEAN region. Furthermore, there were 23.97% variance that could not be ex-plained by the two principal components and these factors were random and not able to affect the capital markets in ASEAN region simultaneously. Table 3. Eigenvector (Loadings)
Figure 1. Ordered Eigenvalue and Eigenvalue Cumulative Proportion
Source: Capital Market Statistics, processed.
DISCUSSION
Based on PCA analysis results shown in Table 2., it was seen that the capital market in ASEAN region had 57.09% of the principal factors causing the same movement, so that there were comovements in those capital markets. This result supported the research results done by Click & Plummer (2005); Cheng et al. (2003) (2003); Karim & Ning (2013) who found that there were comovements in the capital markets in ASEAN region. The results also showed that despite the capital markets had comovement but the capital markets were not fully integrated. It could be seen from the communalities degree (cumulative pro-portion), which only reached 57.09%.
Variable PC 1 PC 2
If it was analysed further by using Eigen-vector Loadings as shown in Table 3., it could be seen that there were four capital markets in ASEAN region which formed same principal major com-ponents (PC 1), namely Indonesia Stock Exchange (represented by JCI), Kuala Lumpur Stock Ex-change (represented by KLCI), Stock ExEx-change Thailand (represented by SET) and Singapore Stock Exchange (represented by STI), while Philippines Stock Exchange (represented by PSEi) formed a separate principal component (PC 2). This finding sharpens the analysis result and showed that the four capital markets in ASEAN (Indonesia Stock Exchange, Kuala Lumpur Stock Exchange, Stock Exchange Thailand and Singapore Stock Exchange were integrated while the Philippines Stock Ex-change tended to be segmented). This condition might occur due to factors that affected the stocks movement in Philippines Stock Exchange during the period of observation tended to be dominated by internal factors than external factors, compared to the external factors especially regionally. The research results showed that in fact the capital market in Indonesia was integrated with Kuala Lumpur Stock Exchange, Stock Exchange Thailand and Singapore Stock Exchange. These research findings led to the policy that portfolio formation among integrated capital markets would not pro-vide an optimal diversification, but portfolio for-mation by engaging Philippines Stock Exchange was able to provide diversification benefits.
CONCLUSION AND SUGGESTION
Conclusion
This study aimed to review the integration of ASEAN capital markets by using the Orthogo-nal Generalized Autoregressive ConditioOrthogo-nal Heteroscedasticity (OGARCH) method which was able to conclude the degree of integration. In gen-eral it can be concluded there is co-movement in the five capital markets in ASEAN region
exam-ined in this study. However, from the five capital markets studied there are two principal compo-nents factors that influence the conditional vari-ance. The four capital markets in ASEAN form a principal component with the biggest weight (In-donesia Stock Exchange, Kuala Lumpur Stock Ex-change, Stock Exchange Thailand and Singapore Stock Exchange) while Philippines Stock Exchange forms a separate principal component. It indicates that Philippines Stock Exchange tends to be seg-mented from the capital markets in ASEAN re-gion, while Indonesia Stock Exchange, Kuala Lumpur Stock Exchange, Stock Exchange Thailand and Singapore Stock Exchange are integrated. Based on this finding, it can be stated that the capi-tal markets in ASEAN region are not fully inte-grated.
Suggestion
Portfolio manager that forms the portfolio across countries in ASEAN region does not need to diversify internationally (or regionally) if in-vesting in Indonesian Stock Exchange, Kuala Lumpur Stock Exchange, Stock Exchange Thailand and Singapore Stock Exchange because they tend to be integrated. Diversification can be done by including Philippines Stock Exchange into portfo-lio because this capital market is segmented from other capital markets in ASEAN region, so includ-ing Philippines Stock Exchange into portfolio can provide diversification benefits.
REFERENCES
Agyei-Ampomah, S. 2011. Stock Market Integration in Africa. Managerial Finance, 37(3): 242-256.
Alexander, C. 2001. A Primer on the Orthogonal GARCH Model. Working Paper.
Ameer, R. 2006. Integration of the South and East Asian Stock Market: How Long to Go? Journal of Finan-cial Reporting and Accounting, 4(1):61-102.
Arsyad, N. 2015. Integration between East and South-east Asian Equity Markets. Journal of Financial Eco-nomic Policy, 17(2):104-121.
Azad, A.S.M.S. 2009. Efficiency, Cointegration and Con-tagion in Equity Markets: Evidence from China, Japan and South Korea. Asian Economic Journal, 23(1):93-118.
Bai, J. 2011. Using Orthogonal GARCH to Forecast Cova-riance Matrix of Stock Returns. Thesis. The Faculty of the Department of Economics University of Houston. Houston.
Cheng, W.K., Leng, G.K., & Lian. K.K. 2003. Financial Crisis and Intertemporal Linkages Across the ASEAN-5 Stock Markets. FEA Working Paper (2003-4).
Click, R.W. & Plummer, M.G. 2005. Stock Market Integra-tion in ASEAN after the Asian Financial Crisis. Journal of Asian Economics, 16:5-28.
Karim, B.A., & Karim, Z.A. 2012. Integration of ASEAN-5 Stock Markets: A Revisit. Asian Academy of Man-agement Journal of Accounting and Finance, 8(2):21-41.
Karim, B.A. &. Ning, H.X 2013. Driving Forces of the ASEAN-5 Stock Markets Integration. Asia-Pacific Journal of Business Administration, 5(3):186-191.
Kearney, C. & Lucey B.M. 2004. International Equity Mar-ket Integration: Theory, Evidence and Implications. International Journal of Financial Analysis, 13:571-583.
Kim, S.-J., & McKenzie, M.D. 2008. Autocorrelation and Stock Market Integration in the Asia-Pacific. In Asia-Pacific Financial Markets: Integration, Innovation and Challenges: Elsevier, Ltd.
Luo, C. 2015. Stochastic Correlation and Portfolio Opti-mization by Multivariate GARCH. Dissertation, Graduate Department of Mathematics, University of Toronto, Toronto.
Majid, M.S.A. & Kassim, S.H. 2009. Impact of the 2007 US Financial Crisis on the Emerging Equity Markets. International Journal of Emerging Markets, 4(4):341-357.
Mink, M. 2015. Measuring Stock Market Contagion: Lo-cal or Common Currency Returns? Emerging Mar-kets Review 22:18-24.
Mussa, M. & Goldstein, M. 1993. The Integration of World Capital Markets.
Palac-McMiken, E.D. 1997. An Examination of ASEAN Stock Markets: A Cointegration Approach. ASEAN Economic Bulletin, 13(3):299-311.
Pukthuanthong, K. & Roll, R. 2009. Global Market Inte-gration: An Alternative Measure and Its Applica-tion. Working Paper.
Roca, E. D., Selvanathan, E.A., & Shepherd, W.F. 1998. Are the ASEAN Equity Markets Interdependent? ASEAN Economic Bulletin, 15(2):109-120.
Suganda, T. R. & Soetrisno, Y. 2016. Uji Integrasi dan
Contagion Effect Pasar Modal Pada Lima Negara
ASEAN (Riset Empiris Pasca Terjadinya Krisis
Subprime Mortgage dan Krisis Yunani). Jurnal
Keuangan dan Perbankan, 20(2):252-262.
Suryanta, B. 2011. Capital Market Integration in ASEAN Countries: Special Investigation of Indonesian Towards the Big Four. Asian Journal of Technology Management 4 (2):109-114.