* Corresponding author
CANOPY SURFACE RECONSTRUCTION AND TROPICAL FOREST
PARAMETERS PREDICTION FROM AIRBORNE LASER SCANNER FOR
LARGE FOREST AREA
Z. Chen
a*, Z. Yang
a, Y. Chen
a, C. Wang
b, J. Qian
a, Q. Yang
a, X. Chen
a, J. Lei
aa Forestry Research Institute of Hainan Province HaiKou, HaiNan, 571100, China - [email protected],
(616853450, 515835848, 43240637,965819833) @qq.com, [email protected]
b Hainan Geomatics Center, National Administration of Surveying, Mapping and Geoinformation of China,
HaiKou, HaiNan, 570203, China – [email protected]
KEY WORDS: Canopy Height Model, CHM, LiDAR, Tree Mean Height
ABSTRACT:
Canopy height model(CHM) and tree mean height are critical forestry parameters that many other parameters such as growth, carbon sequestration, standing timber volume, and biomass can be derived from. LiDAR is a new method used to rapidly estimate these parameters over large areas. The estimation of these parameters has been derived successfully from CHM. However, a number of challenges limit the accurate retrieval of tree height and crowns, especially in tropical forest area. In this study, an improved canopy estimation model is proposed based on dynamic moving window that applied on LiDAR point cloud data. DEM, DSM and CHM of large tropical forest area can be derived from LiDAR data effectively and efficiently.
1. INTRODUCTION
At present, remote sensing technology has been widely used in forestry resources management, dynamic monitoring and analysis, disaster monitoring, forecasting, assessment and so on. However, most of the remote sensing sensors can only provide detailed information on the horizontal direction, the vertical structure of the forest is hard to get from remote sensing images. The emergence of airborne LiDAR technology has led to significant changes in natural resource management and research. The laser emitted by the laser scanner can partly pass through the voids of the vegetation to reach the ground. The vegetation and the ground reflected laser are received by the system, and the vertical structure parameters of the forest can be obtained. However, a number of challenges limit the accurate retrieval of tree height and crowns. Research has shown that stand heights in moderate to dense canopy forests are commonly underestimated with LiDAR data as the probability of a laser pulse intercepting the apex of a tree crown is relatively small (Nilsson 1996, Naesset 1997).
A number of approaches have been developed to reduce this bias. In this study, an improved canopy estimation is proposed based on dynamic search window that applied on LiDAR point cloud data, and then the relation between the mean heights estimated from LiDAR data and the mean heights from the forest inventory is also proposed. By this relation, other forest mean heights can be estimated by applying a correction value.
2. RELATED WORKS
A variety of research have been recently conducted on forest attribute estimation. The estimation of vertical forest structure such as canopy height from LiDAR data is arguably of greatest interest to foresters(Lim, Treitz et al. 2003). From this information, other biophysical parameters (e.g., volume,
above-ground biomass) that describe the function and productivity of forest ecosystems can be derived (Dubayah and Drake 2000). The expected difference between mean tree height and the laser-based mean canopy height is discussed in details(Magnussen and Boudewyn 1998, Schardt, Ziegler et al. 2002, Sileshi 2014). In their work, geometrical probabilities were used to estimate the average vertical positions of laser hits given an average crown size. This position was then compared to the actual tree height for stands in the study area and a mean tree height was computed by adding the calculated difference to the laser estimated tree height. Adding the estimated difference to the laser-based height improved the correlation between field and laser estimates from 0.61 to 0.83.
3. METHODOLOGY
The complete process of laser scanning point cloud data is earlier proposed by Hoffman and Jain(Hoffman and Jain 1987) which including five subsequent data processing steps: data collection, data pre-processing, segmentation (or classification), feature identification and object modeling. This study is mostly carried out according to this process. For forest applications, the process is generally data acquisition, data preprocessing, DEM and DSM extraction, CHM generation, tree height and other parameters estimation that are shown in Figure 1.
CHM-canopy height model- is a continuous digital dataset representing vegetation heights(Wulder, Bater et al. 2008). Data collection and preprocessing are not discussed in this paper. This paper focuses on DEM and DSM extraction, CHM generation and tree height estimation.
ISPRS Annals of the Photogrammetry, Remote Sensing and Spatial Information Sciences, Volume IV-4/W2, 2017 2nd International Symposium on Spatiotemporal Computing 2017, 7–9 August, Cambridge, USA
Data Collection
Figure 1. General process of forest point cloud application
3.1 DEM and DSM Extraction
The improved moving window difference algorithm is adopted in view of the complicated terrain in the tropical forest area in this paper. The algorithm first meshes the point cloud data, obtains the highest point and the lowest point in each grid, as the initial DSM and DEM reference plane, and then sets different thresholds according to the initial reference surface. Then the remaining points are classified to DSM or DEM. Finally, the DEM, DSM point cloud collection are exported to output files. The specific steps of the algorithm are as follows:
1) Creating DSM and DEM initial reference plane grid
Calculate the minimum and maximum of the x, y coordinates, namely ( � , � ) and ( ��, ��), then create a grid by selecting the lower left corner( � , � ) of the area as a starting point and setting the interval size to 2 meters.
Figure 2. Point cloud to grid map 2) DSM points and DEM points accurate classification
First, find the highest and lowest points in each grid. Points with lowest value are marked as ground while the highest as canopy surface, that are called initial reference plane � , , � , . Secondly, move the grid every ⁄ grid spacing in the x direction and then y direction.
After each moving, do the accurate classification process as unmarked according to the following rules:
{| � | < � , ground point | � | > � , unmarked
{| � | < � , vegetation point | � | > � , unmarked
Where � , � are the difference threshold between unmarked point and � , , � , . In this paper, the threshold is set to 0.2 meters.
Finally, the discrete DEM (ground points) and DSM (vegetation points) point dataset are classified from the original dataset. 3) DSM and DEM interpolation
The IDW interpolation method is used for DSM and DEM interpolation and the interpolation grid size can be set to ⁄ grid interval to obtain the continuous reference model � , generated by DSM and DEM difference calculation. Based on the principle of grid space analysis in GIS, CHM is easily generated by DSM and DEM.
Many of the vegetation parameters in the forest survey can be obtained directly or indirectly from CHM, such as tree height, crown width, canopy density, volume and biomass, but these parameters are usually lower than the actual value.
3.3 Mean Tree Height Estimation
Based on CHM, the mean tree height can be estimated by calculating the mean value of the raster’s pixel values that greater than the minimum height value of trees HL.
4. EVALUATION
4.1 Test Site
In this study, part of the tropical forest in Sanya City, Hainan Province, China is selected as the experimental area which is about 2 square kilometers.
4.2 Data Used
Lidar data:
Lidar data of the test site was acquired by TopoSys Riegl LMS-Q680 Scanner with flight height 1150 meters and 1.5 points per squared meters.
Field survey data:
A total of 48 elevation sites and 69 trees’ height, position, diameter at breast height(DBH) and field photos were acquired by RTK receiver, Nikon forestry pro, rules and digital camera.
ISPRS Annals of the Photogrammetry, Remote Sensing and Spatial Information Sciences, Volume IV-4/W2, 2017 2nd International Symposium on Spatiotemporal Computing 2017, 7–9 August, Cambridge, USA
Figure 3. Experimental area field and surveyed points (red for elevation points, green for single trees)
4.3 Experiment Results
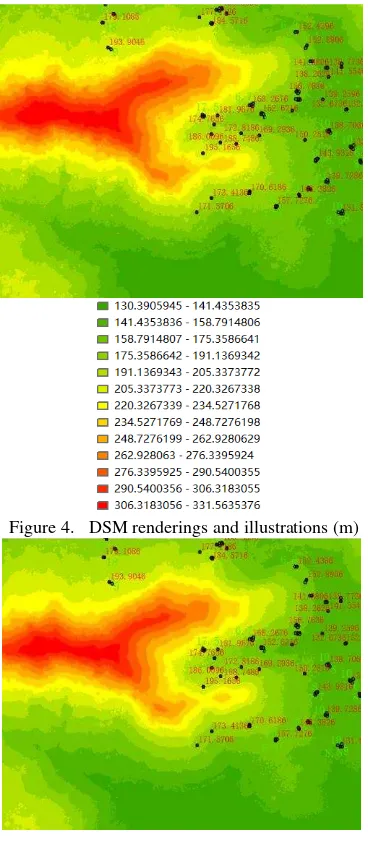
The algorithms are implemented by C ++ and C #. The data of Lidar point cloud in this area are processed by DEM, DSM extraction, IDW interpolation, slope, aspect generation, CHM generation and average tree height calculation. Figure 4 to 6 are DEM, DSM and CHM.
Figure 4. DSM renderings and illustrations (m)
Figure 5. DEM renderings and illustrations (m)
Figure 6. CHM renderings and illustrations (m) By setting different lowest tree height value HL, the estimated and surveyed mean tree height statistics are as follows: Table 1. Lidar point cloud data extraction average tree height (unit: m)
No.
Lowest Tree Height
Lidar Mean Tree Height
Surveyed Mean Tree
Height
Difference
1 3 5.7 8.9 -3.2
2 3.5 6.1 9.0 -2.9
3 4 6.5 9.0 -2.5
4 4.5 6.8 9.1 -2.3
5 5 7.2 9.2 -2
6 5.5 7.6 9.5 -1.9
7 6 8.0 9.6 -1.6
8 6.5 8.4 9.9 -1.5
9 7 8.8 10.3 -1.5
ISPRS Annals of the Photogrammetry, Remote Sensing and Spatial Information Sciences, Volume IV-4/W2, 2017 2nd International Symposium on Spatiotemporal Computing 2017, 7–9 August, Cambridge, USA
Figure 7. Relationship between different lowest tree height
4.4 DISCUSSION
The results show that the system can process the Lidar point cloud data efficiently. The smaller the minimum tree height is, the closer the estimate is to the survey value. When the minimum tree height HL is set to 4 meters, the average tree height is about 1.9 meters below the average height of the surveyed trees. The reasons for the difference may be as follows: First, the Lidar data loss at the top of trees because of the low density of Lidar point data. Second, Lidar laser is difficult to penetrate the low vegetation to arrives at the actual ground. Both reasons lead to the lower estimation.
This table analysis results can be used as an empirical value for late Lidar point cloud data tree corrections.
5. CONCLUSION
In this paper, a method for canopy surface reconstruction and forest parameters prediction from airborne laser scanner for large forest area is proposed and the algorithms are implemented by C ++ and C #. The dynamic search window algorithm is improved for Lidar data processing. Part of the tropic forest is selected as the test area and the estimated results are compared with the field for verification.
The result shows that this method can reconstruct canopy surface and predict forest parameters effectively and efficiently for large forest areas. More accurate results can be acquired with the empirical correction value. The future work can be focused on the estimation of more parameters such as crown width, canopy density, biomass and other indicators and improving methods for CHM construction for more accurate results.
ACKNOWLEDGEMENTS
The authors are grateful to their colleagues for their constructive comments and suggestions in writing this article.
REFERENCES
Ayrey, E., et al. (2017). "Layer Stacking: A Novel Algorithm for Individual Forest Tree Segmentation from LiDAR Point Clouds." Canadian Journal of Remote Sensing: 1-13.
Brovkina, O., et al. (2017). "Mapping forest aboveground biomass using airborne hyperspectral and LiDAR data in the mountainous conditions of Central Europe." Ecological Engineering 100: 219-230.
Dubayah, R. O. and J. B. Drake (2000). "Lidar remote sensing for forestry." Journal of Forestry 98(6): 44-46.
Gaulton, R. and T. J. Malthus (2010). "LiDAR mapping of canopy gaps in continuous cover forests: A comparison of canopy height model and point cloud based techniques." International Journal of Remote Sensing 31(5): 1193-1211. Hoffman, R. and A. K. Jain (1987). "Segmentation and classification of range images." IEEE transactions on pattern analysis and machine intelligence(5): 608-620.
Jing, L., et al. (2012). "Automated delineation of individual tree crowns from LiDAR data by multi-scale analysis and segmentation." Photogrammetric Engineering & Remote Sensing 78(12): 1275-1284.
Koukoulas, S. and G. A. Blackburn (2004). "Quantifying the spatial properties of forest canopy gaps using LiDAR imagery and GIS." International Journal of Remote Sensing 25(15): 3049-3072.
Lim, K., et al. (2003). "LiDAR remote sensing of forest structure." Progress in physical geography 27(1): 88-106. Magnussen, S. and P. Boudewyn (1998). "Derivations of stand heights from airborne laser scanner data with canopy-based quantile estimators." Canadian journal of forest research 28(7): 1016-1031.
Naesset, E. (1997). "Estimating timber volume of forest stands using airborne laser scanner data." Remote Sensing of Environment 61(2): 246-253.
Nilsson, M. (1996). "Estimation of tree heights and stand volume using an airborne lidar system." Remote Sensing of Environment 56(1): 1-7.
Schardt, M., et al. (2002). "Assessment of forest parameters by means of laser scanning." International archives of photogrammetry remote sensing and spatial information sciences 34(3/A): 302-309.
Sileshi, G. W. (2014). "A critical review of forest biomass estimation models, common mistakes and corrective measures." Forest Ecology and Management 329: 237-254.
Wulder, M. A., et al. (2008). "The role of LiDAR in sustainable forest management." The Forestry Chronicle 84(6): 807-826. Yang, X., et al. (2013). "Three-dimensional forest reconstruction and structural parameter retrievals using a terrestrial full-waveform lidar instrument (Echidna®)." Remote Sensing of Environment 135: 36-51.
ISPRS Annals of the Photogrammetry, Remote Sensing and Spatial Information Sciences, Volume IV-4/W2, 2017 2nd International Symposium on Spatiotemporal Computing 2017, 7–9 August, Cambridge, USA