GEOSPATIAL APPROACH FOR DELINEATING EXTRAPOLATION DOMAINS FOR
SUSTAINABLE AGRICULTURAL INTENSIFICATION TECHNOLOGIES
Francis K. Muthoni
1*,
Frederick Baijukya
2, Haroon Sseguya
3, Mateete Bekunda
4, Irmgard
Hoeschle-Zeledon
5, Edward Ouko
6, Kenneth Mubea
71International Institute of Tropical Agriculture (IITA), P.O. Box 10, Duluti, Arusha, Tanzania - [email protected] 2International Institute of Tropical Agriculture (IITA), Dar es Salaam, Tanzania [email protected]
3International Institute of Tropical Agriculture (IITA), Morogoro Tanzania - [email protected]
4International Institute of Tropical Agriculture (IITA), P.O. Box 10, Duluti, Arusha, Tanzania - [email protected] 5International Institute of Tropical Agriculture (IITA), Ibadan, Nigeria - [email protected] 6Regional Centre for Mapping Resources for Development (RCMRD), P.O. Box 632-00618, Roysambu, Nairobi, Kenya -
7Regional Centre for Mapping Resources for Development (RCMRD), P.O. Box 632-00618 Roysambu, Nairobi, Kenya -
KEY WORDS: Extrapolation Suitability Index, correlation structure, inorganic fertilizers, GIS, improved maize varieties, scaling out, spatial targeting, Tanzania
ABSTRACT:
Sustainable intensification (SI) is a viable pathway to increase agricultural production and improve ecosystem health. Scaling SI technologies in locations with similar biophysical conditions enhance adoption. This paper employs novel extrapolation detection (ExeDet) algorithm and gridded bioclimatic layers to delineate extrapolation domains for improved maize variety (SC719) and inorganic fertilizers (YaraMila-CEREAL® and YaraBela-Sulfan®) in Tanzania. Suitability was based on grain yields recorded in
on-farm trials. The ExeDet algorithm generated three maps: (1) the dissimilarity between bioclimatic conditions in the reference trial sites and the target extrapolation domain (Novelty type-1), (2) the magnitude of novel correlations between covariates in extrapolation domain (Novelty type-2) and (3) the most limiting covariate. The novelty type1 and 2 maps were intersected and reclassified into five suitability classes. These classes were cross-tabulated to generate extrapolation suitability index (ESI) for the candidate technology package. An impact based spatial targeting index (IBSTI) was used to identify areas within the zones earmarked as suitable using ESI where the potential impacts for out scaling interventions can be maximized. Application of ESI and IBSTI is expected to guide extension and development agencies to prioritize scaling intervention based on both biophysical suitability and potential impact of particular technology package. Annual precipitation was most limiting factor in largest area of the extrapolation domain. Identification of the spatial distribution of the limiting factor is useful for recommending remedial measures to address the limiting factor that hinder a technology to achieve its full potential. The method outlined in this paper is replicable to other technologies that require extrapolation provided that representative reference trial data and appropriate biophysical grids are available.
1. INTRODUCTION
Food insecurity is a prevalent problem in sub-Sahara Africa (SSA) and the situation is worsened by increasing human population (van Ittersum et al. 2016). Adoption of improved crop varieties that are high yielding and tolerant to drought, pests and diseases is one of the promising pathway to increase food production (Asfaw et al. 2012, Kassie et al. 2013, Kassie et al. 2014, Fisher et al. 2015). These varieties are disseminated as technology packages together with appropriate good agronomic practices to increase yields and conserve natural resource capital (Kihara et al. 2014, Vanlauwe et al. 2014). The potential impact and the rates of adoption of these agronomic practices can be accentuated if they are disseminated in their suitable biophysical environments (Rubiano et al. 2016, Muthoni et al. 2017).
Experimental trials for agronomic technologies are undertaken at few selected sites to determine varieties that are
adapted to specific agro-ecological conditions (Annicchiarico et al. 2006). This is followed by scaling out of successful technologies for wider adoption. Scaling involves a degree of extrapolation to areas where the range of environmental variables is beyond that observed in the reference trial sites or areas with new combinations of environmental variables (Zurell et al. 2012, Owens et al. 2013, Mesgaran et al. 2014). To a large extent the environmental conditions determine crop suitability (Nijbroek and Andelman 2015). Therefore determining environmental dissimilarity can guide spatial targeting of agronomic technologies to areas with the highest potential. Geographical Information Systems (GIS) and remote sensing tools are used to delineate suitability maps (Hyman et al. 2013).
maize variety (SC 719) and relatively new inorganic fertilizer blends (YaraMila-CEREAL and YaraBela-Sulfan) in Tanzania. The method for generating ESI accounted for the magnitude of deviation from univariate range of covariates and the extent of novel combinations of environmental covariates between the reference site and the projection domain. This study posits that accounting for correlation structure between biophysical covariates improves delineation of the risk of extrapolating agronomic technologies to novel environments.
2. MATERIALS AND METHODS
2.1 Study Area
The study was conducted within five administrative regions of Tanzania (Figure 1), covering approximately 277,743 km2
(31.9oE, -3.4oS; 38.5oE, -10.6oS). The biophysical and
socio-economic conditions of the study area are described by Muthoni et al. (2017).
Figure 1. The location of trial sites for technology package comprising of an improved maize variety and inorganic fertilizers in Mbozi District, Mbeya region in Tanzania. The area with red boundary in the inset map show the projection domain targeted for extrapolation
2.2 Maize varieties and fertilizers in demonstration sites
Demonstration plots measuring 100 m2 were established
during the 2015-2016 growing seasons in Mbozi district (Figure 1). Different agronomic technology packages were demonstrated at different villages (Figure 1). However this this paper focus on only one technology package comprising of SC719 improved maize variety with YaraMila-CEREAL® and
YaraBela-Sulfan® fertilizers applied as basal and topdressing
fertilizers respectively. The suitability of the technology was assessed in terms of grain yield harvested at the end of the season.
2.3 Environmental layers
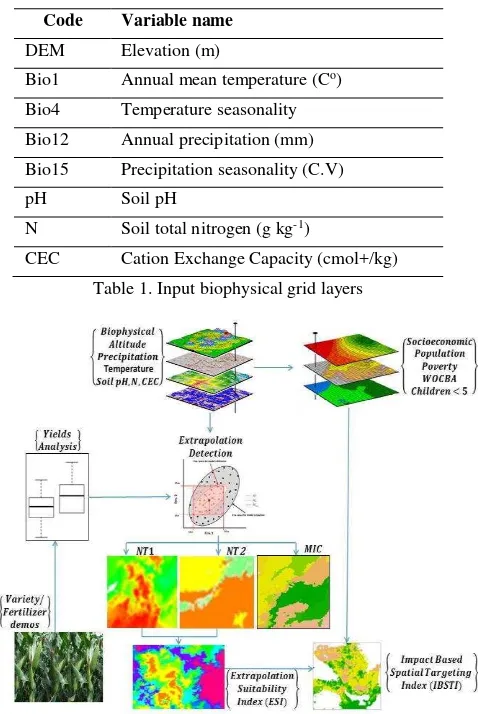
A set of eight gridded biophysical layers were selected based on their known influence on growth of the maize varieties and efficiency of inorganic fertilizers (Table 1). The bioclimatic grid layers at 1 km spatial resolution were obtained from the Worldclim database (Hijmans et al. 2005). A 30 m resolution ASTER global digital elevation model (DEM) was acquired from NASA website (METI and NASA 2011). Gridded layers
for selected soil chemical properties (Table 1) with a resolution of 250 m were downloaded from the World Soil Information database (ISRIC 2015).
Code Variable name
DEM Elevation (m)
Bio1 Annual mean temperature (Co)
Bio4 Temperature seasonality Bio12 Annual precipitation (mm) Bio15 Precipitation seasonality (C.V)
pH Soil pH
N Soil total nitrogen (g kg-1)
CEC Cation Exchange Capacity (cmol+/kg) Table 1. Input biophysical grid layers
Figure 2. Flow Chart for the statistical analysis
2.4 Statistical Analysis
The procedure for delineating extrapolation suitability map for the candidate technology is summarized in Figure 2. Prior to analysis all environmental layers were resampled to 1 km spatial resolution. To avoid multicollinearity between environmental covariates, only grid layers with Pearson’s correlation values less than 0.6 were included in the analysis. Therefore BIO1 and CEC (Table 1) were eliminated from further analysis. Grid layers representing the target projection domain were clipped to the extent of five administrative regions in Tanzania (Figure 1). A three kilometres buffer was created around the location of selected trial sites for the candidate technology. The resulting buffer polygon was used to extract grid layers for the reference trial sites.
values individual predictors in the projection domain are beyond that observed in the reference sites (Novelty type 1, NT1); and (2) the covariates exhibit unique multivariate combinations (novel correlation structure) not observed in the reference sites (Novelty type 2, NT2). NT1 ranges from zero to an infinite negative value with zero indicating no extrapolation beyond the univariate coverage of reference data. The lower the value is from zero, the more the environmental conditions of a location are dissimilar to that in the reference site. Values for NT2 map range from zero to an infinite positive value. NT2 values less than one indicate similarity in terms of multivariate combination among covariates, with values closer to zero being more similar. Values larger than one indicate novel combinations of environmental variables compared to those observed in reference sites.
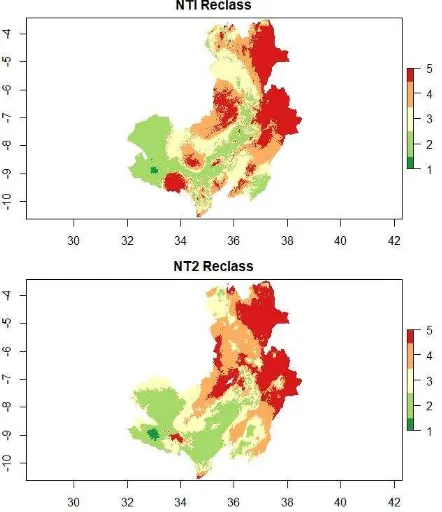
The ExeDet algorithm was coded in R with minor modifications to generate NT1 and NT2 maps. The resulting NT1 and NT2 maps were classified into five classes; the first class derived from NT1 map represented the zone where all univariate covariates were within the reference range (NT1=0). The first class in NT2 map indicated zones with no multivariate combination of covariates (NT2 =<1). The other four classes in each map were derived by dividing the range of values into four quantiles. The agreement between the five classes for each of the two classified maps was derived using ’compareClassification’ function in ’greenbrown’ R package (Forkel et al. 2015). This returned a map and a table showing the shift in classes between the classified NT1 (reference) and NT2 maps. The agreement between the two maps was assessed using Kappa index of agreement (Cohen 1960), low agreement (kappa <0.4) indicates that accounting for correlation structure among covariates (NT2) do not improve delineation of the extrapolation risk.
The extrapolation suitability index (ESI) was generated as the product of the values for cross-tabulated classes from the two maps. The derived suitability ranged from 1 to product of maximum number of classes in classified NT1 and NT2 maps. Lower values indicate higher suitability for a particular pixel for scaling a candidate technology package. Zone with ESI = 1 is perfectly similar to the reference area for particular technology and therefore is the most suitable for scaling out the candidate technology.
The ExeDet generated a third map of the most influential covariate (MIC) that identify the environmental variable that induce the highest limit to suitability of a selected technology package in each pixel in the projection domain.
2.5 Priority setting to maximize potential impact
Suitability zones defined by ESI represent the biophysical suitability and therefore they may exhibit heterogeneity when considering the potential socioeconomic impacts of scaling a particular technology. Therefore spatial prioritization is needed to identify areas within defined suitability clusters that can be targeted to maximize the potential impact of adopting a technology. The impact based spatial targeting index (IBSTI; Muthoni et al. 2017) was used to identify priority clusters in zones identified as suitable for specific technology package (with low ESI values). IBSTI values range from one to an infinite positive value, with higher values indicating more potential impact from a technology scaling intervention. Once a suitable zone for scaling the candidate technology package was
identified, based on ESI map, IBSTI values for that zone were calculated to pinpoint areas with maximum potential impact.
3. RESULTS
The NT1 dissimilarity ranged from 0 to -17.5. NT2 dissimilarity ranged from 0 – 742 with values larger than one indicating novel combination of environmental covariates. The two dissimilarity maps were reclassified into five suitability classes (Figure 3), where class 1 was the most suitable and class 5 most unsuitable. Cross-tabulation of the two maps revealed a poor agreement (Kappa = 0.35). The values of the derived ESI map (Figure 4) ranged from 1 to 25 and reflected a decreasing suitability gradient from south western to north eastern zones of the projection domain. Zones with ESI values 1 and 2 are wholly within or immediately surrounding the reference trial sites.
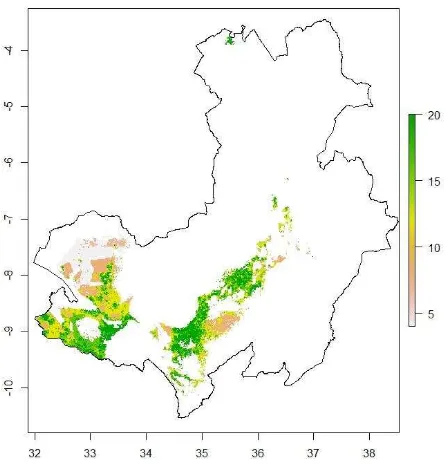
The area with ESI=4 was third best in suitability and formed the largest contiguous zone surrounding the reference trial sites area. Assessment of potential impact for zone with ESI = 4 revealed that IBSTI values ranged between 4 and 20 (Figure 5), with the higher value reflecting higher potential impact if the technology is fully adopted in that zone. 19% (7163 Km2) for
suitable zone with ESI=4 had IBSTI = 20. The suitability of the candidate technology package in 43% and 28% of the projection domain was limited by annual precipitation and precipitation seasonality respectively (Figure 6).
Figure 4. The extrapolation suitability index (ESI) for SC-719 maize variety and with inorganic fertilizer blend (YaraMila-CEREAL and YaraBela-Sulfan). ESI value 1 depicts high suitability while 25 is least suitable.
Figure 5. The Impact Based Spatial Targeting index (IBSTI) values for zone with ESI = 4. Higher IBSTI value indicates more potential impact for scaling candidate technology. Technology scaling interventions should prioritize zone with IBSTI = 20 to maximize potential impact.
Figure 6. Map on most important covariate (MIC). The suitability of the candidate technology package in 43% and 28% of the projection domain was limited by annual precipitation and precipitation seasonality respectively. Codes of variables in legend are defined in table 1.
4. DISCUSSIONS
This paper generates extrapolation suitability index (ESI) for quantifying the risk associated with extrapolating agronomic technology packages into novel environments. The index was developed using yield data for a technology package comprising of an improved maize variety (SC719) and a new inorganic fertilizer blend (YaramilaCereal + YaraBelaSulfan) in Tanzania. The ESI map was derived using a novel extrapolation detection method that account for the magnitude at which the univariate environmental variables in the projection domains fall outside the range of values in the reference sites (NT1; Mesgaran et al. 2014). It also account for the change in the correlation structure of covariates in the projection domain (NT2) compared to that observed in the reference sites. The low agreement between NT1 and NT2 maps suggest that the two dissimilarity maps contributed different information that was incorporated to delineate the risk of extrapolating varieties into novel environments. This concur with observation by (Zurell et al. 2012) that failure to account for multivariate correlation between environmental variables may lead to erroneous predictions when extrapolating to new environments. However was largely overlooked in previous studies estimating extrapolation domains for agronomic technologies.
technology package. Delineation of suitable zones for specific varieties could support seed producers and agro-dealers to estimate the quantity of seeds required to satisfy the expected demand (Annicchiarico et al. 2006).
The generated MIC map identified the most limiting factor for a particular technology at different locations of the projection domain. Extension agents can utilize information provided by MIC map to target management interventions that ameliorate the most significant biophysical factor that hinder a technology to achieve its full potential. For example, drought tolerant maize varieties could be targeted to the large zone that was limited by low precipitation as they withstand moisture stress.
5. ACKNOWLEDGEMENTS
Authors acknowledge the financial support from the United States Agency for International Development (USAID) under contract number MTO 069018 for ‘Enhancing partnership among Africa RISING and NAFAKA Programs for fast-tracking delivery and scaling of agricultural technologies in Tanzania’.
6. REFERENCES
Annicchiarico, P., F. Bellah, and T. Chiari. 2006. Repeatable genotype × location interaction and its exploitation by conventional and GIS-based cultivar recommendation for durum wheat in Algeria. European Journal of Agronomy 24:70-81.
Asfaw, S., M. Kassie, F. Simtowe, and L. Lipper. 2012. Poverty Reduction Effects of Agricultural Technology Adoption: A Micro-evidence from Rural Tanzania. The Journal of Development Studies 48:1288-1305. Cohen, J. 1960. A coefficient of agreement for nominal scales. Educational & Psychological Measurement 20:37 - 46.
Fisher, M., T. Abate, R. W. Lunduka, W. Asnake, Y. Alemayehu, and R. B. Madulu. 2015. Drought tolerant maize for farmer adaptation to drought in sub-Saharan Africa: Determinants of adoption in eastern and southern Africa. Climatic Change 133:283-299.
Forkel, M., M. Migliavacca, K. Thonicke, M. Reichstein, S. Schaphoff, U. Weber, and N. Carvalhais. 2015. Codominant water control on global interannual variability and trends in land surface phenology and greenness. Global Change Biology 21:3414-3435. Hijmans, R. J., S. E. Cameron, J. L. Parra, P. G. Jones, and A.
Jarvis. 2005. Very high resolution interpolated climate surfaces for global land areas. International Journal of Climatology 25:1965-1978.
Hyman, G., D. Hodson, and P. Jones. 2013. Spatial analysis to support geographic targeting of genetypes to environments. Frontiers in Physiology 4. ISRIC. 2015. Soil property maps of Africa at 250 m. Kassie, M., M. Jaleta, and A. Mattei. 2014. Evaluating the
impact of improved maize varieties on food security in Rural Tanzania: Evidence from a continuous treatment approach. Food Security 6:217-230. Kassie, M., M. Jaleta, B. Shiferaw, F. Mmbando, and M.
Mekuria. 2013. Adoption of interrelated sustainable
agricultural practices in smallholder systems: Evidence from rural Tanzania. Technological Forecasting and Social Change 80:525 - 540. Kihara, J., L. D. Tamene, P. Massawe, and M. Bekunda. 2014.
Agronomic survey to assess crop yield, controlling factors and management implications: a case-study of Babati in northern Tanzania. Nutrient Cycling in Agroecosystems 102:5-16.
Mesgaran, M. B., R. D. Cousens, and B. L. Webber. 2014. Here be dragons: a tool for quantifying novelty due to covariate range and correlation change when projecting species distribution models. Diversity and Distributions 20:1147-1159.
METI, and NASA. 2011. ASTER Global Digital Elevation Model (ASTER GDEM) version 2. NASA Jet Propulsion Laboratory.
Muthoni, F. K., Z. Guo, M. Bekunda, H. Sseguya, F. Kizito, F. Baijukya, and I. Hoeschle-Zeledon. 2017. Identifying sustainable recommendation domains for scaling agricultural technologies in Tanzania. Land Use Policy 66C:34 - 48.
Nijbroek, R. P., and S. J. Andelman. 2015. Regional suitability for agricultural intensification: a spatial analysis of the Southern Agricultural Growth Corridor of Tanzania. International Journal of Agricultural Sustainability:1-17.
Owens, H. L., L. P. Campbell, L. L. Dornak, E. E. Saupe, N. Barve, J. Soberón, K. Ingenloff, A. Lira-Noriega, C. M. Hensz, C. E. Myers, and A. T. Peterson. 2013. Constraints on interpretation of ecological niche models by limited environmental ranges on calibration areas. Ecological Modelling 263:10-18. Rubiano, M. J. E., S. Cook, M. Rajasekharan, and B.
Douthwaite. 2016. A Bayesian method to support global out-scaling of water-efficient rice technologies from pilot project areas. Water International 41:290-307.
van Ittersum, M. K., L. G. J. van Bussel, J. Wolf, P. Grassini, J. van Wart, N. Guilpart, L. Claessens, H. de Groot, K. Wiebe, D. Mason-D’Croz, H. Yang, H. Boogaard, P. A. J. van Oort, M. P. van Loon, K. Saito, O. Adimo, S. Adjei-Nsiah, A. Agali, A. Bala, R. Chikowo, K. Kaizzi, M. Kouressy, J. H. J. R. Makoi, K. Ouattara, K. Tesfaye, and K. G. Cassman. 2016. Can sub-Saharan Africa feed itself? Proceedings of the National Academy of Sciences 113:14964–14969. Vanlauwe, B., D. Coyne, J. Gockowski, S. Hauser, J. Huising,
C. Masso, G. Nziguheba, M. Schut, and P. Van Asten. 2014. Sustainable intensification and the African smallholder farmer. Current Opinion in Environmental Sustainability 8:15-22.


