Code: E-250
Abstract:About 50% of natural gas in Indonesia is exported to other countries despite of the demand of natural gas is relatively high, which may cause supply shortage in future. One of the reasons is that the export price of natural gas is higher than the domestic price. Indonesia has become an energy exporter for a long time, and has subsidized the cost of its domestic energy supply. Natural gas is one of the fuels which have been supported by the government. Many of the crude oil importing countries set the domestic natural gas price with references to the prices of crude oil mix, of which Japanese crude cocktail (JCC) method is commonly used to determine the natural gas price in the country. However, JCC is heavily dependent on crude oil prices and excludes the other substitution fuels. In this paper, the determination of natural gas price for domestic consumption in Indonesia using netback market value is investigated. The method takes into account prices of all competitive fuels with proper weightings of their shares in each consumer sector, by which the natural gas price does not depend only on crude oil prices, but also on other substitution fuel prices. Netback market value method will provide the relative prices of the natural gas for the consumers to other fuels. Information of all types of fuel including prices and consumption amounts in the past will be used to calculate natural gas price and analyzed in comparison with the actual price. The result will be useful for the policy makers to set the price of natural gas and the country s energy plan in order to secure continuous supply of natural gas.
Keywords: Natural gas price, Netback market value, Japanese crude cocktails
1. INTRODUCTION
Based on data from the IEA [1], in term of ratio between domestic use and export, Indonesia is ranked 16 from 51 natural gas exporter countries with around 50% of natural gas production for export in the year 2009, as shown in Table 1. The world average figures of natural gas production are 66.91% for domestic use, and 33.09% for export. If Indonesia could increase domestic consumption of natural gas to at least equal the world average ratio, or similar with 413.5 BCF (Billion Cubic Feet) [1] in year 2009, then this energy can be used as fuel for power plants, which would be around 1.5 times of electricity production from natural gas. That will improve the electrification ratio of the country. The current plan to increase the electricity production by 10,000 MW focuses on the use of coal [2], which is the major source of CO2 emission. By replacing coal with natural gas as fuel for power plants, around 18.91 million tonnes CO2 emmision per year can be avoided [3].
Based on oil and gas law in Indonesia No 22 year 2001, upstream and downstream are two main sectors in the business. Upstream sectors of natural gas business in Indonesia for exploration and production activities are under production sharing contracts (PSC), controlled by BP Migas, which is the government executive agency for oil and gas upstream sectors. There are foreign gas producing companies such as Total Elf, Conocophilips, Exxon mobil, Jilco, Vico, BP, Petrochina, etc. and local companies such as Medco E&P, Titis sampurna, Pertamina, etc. For LNG liquefaction terminal, there are PT Badak, BP and Exxon Mobil. Downstream sectors of natural gas business in Indonesia for delivering natural gas to the end users is controlled by BPH Migas, which is the government executive agency for downstream oil and gas.
Table 1 Natural gas consumptions and exports by country in the year 2009 [1]
No Country Domestic use (%)
Export
(%) No Country
Domestic use (%)
Export (%)
1 Mozambique 2.78 97.22 27 Europe 74.19 25.81 2 Norway 4.43 95.57 28 Uzbekistan 75.25 24.75 3 Bolivia 22.42 77.58 29 Middle East 78.86 21.14 4 Brunei 23.39 76.61 30 Central & South America 79.33 20.67 5 Qatar 23.64 76.36 31 Asia & Oceania 82.75 17.25 6 Equatorial Guinea 24.72 75.28 32 Colombia 82.84 17.16 7 Burma (Myanmar) 28.16 71.84 33 North America 86.38 13.62 8 Nigeria 31.10 68.90 34 United Kingdom 87.86 12.14 9 Algeria 35.32 64.68 35 Czech Republic 88.04 11.96
10 Libya 37.80 62.20 36 Slovakia 88.37 11.63
11 Kazakhstan 46.41 53.59 37 Germany 89.12 10.88 12 Netherlands 46.74 53.26 38 United Arab Emirates 89.39 10.61
13 Canada 47.65 52.35 39 Croatia 93.08 6.92
14 Malaysia 48.56 51.44 40 Ukraine 94.04 5.96 15 Africa 49.36 50.64 41 United States 95.51 4.49
16 Indonesia 50.74 49.26 42 Iran 95.87 4.13
17 Trinidad and Tobago 51.38 48.62 43 China 96.33 3.67
18 Denmark 52.39 47.61 44 Spain 97.20 2.80
19 Turkmenistan 52.76 47.24 45 Argentina 98.00 2.00
20 Oman 56.05 43.95 46 Turkey 98.02 1.98
21 Australia 60.50 39.50 47 France 98.32 1.68 22 Azerbaijan 64.10 35.90 48 Mexico 98.68 1.32
23 Egypt 70.78 29.22 49 Hungary 99.24 0.76
24 Russia 71.05 28.95 50 Poland 99.75 0.25
25 Austria 71.75 28.25 51 Italy 99.84 0.16
26 Eurasia 72.18 27.82 Average 66.91 33.09
2. METHODOLOGY
Many countries set the domestic natural gas prices with high dependency to the prices of crude oil mix, of which Japanese crude cocktail (JCC) method is commonly used to determine the natural gas price in their country[5-6]. Fig. 1 shows the natural gas prices in some countries, which are closely related to crude oil prices. This may be inappropriate when crude oil price swings over a wide range. According to Miyamoto et al.[5-6], natural gas price s not depend on crude oil price only, but also other substitutable fuels in the respective country.
Fig. 1 Natural gas price in different countries during the year 2000- 2009 [3]
Code: E-250
4th International Conference on Sustainable Energy and Environment (SEE 2011): A Paradigm Shift to Low Carbon Society 27-29 February 2012, Bangkok, Thailand
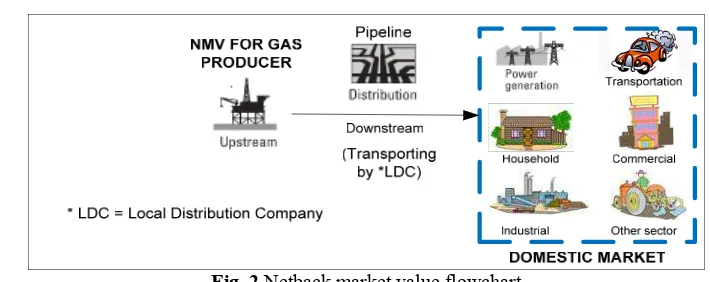
617 Fig. 2 Netback market value flowchart
The formula for the calculation of netback market value in a country [5-6] is given by:
NMV = ∑(WFi × Pi) C (1) where:
NMV : netback market value of natural gas in a country, WFi : weighting factor for competing fuel i,
Pi : price of competing fuel i, (retail price of competing energy in each consumption segment in price per unit of volume),
C : domestic cost of supply and delivery of natural gas, (estimated cost of supply from gas producer to the end users in price per unit of volume).
Weighting factors are estimation values indicating the relative importance or impact competing fuels, which can be calculated as follows:
WF = ESS × CES (2) where:
ESS: Energy sector share is the share of each sector in the total energy consumption. The main sectors are industrial, household, commercial, transportation, power plant and other sectors. Note that in order to obtain the summation of 100 percents, the shares of certain sectors with low consumption were combined with others.
CES: Competing energy share signifies the market share of a competing energy in a consumption sector. It is calculated by identifying the competitors to natural gas and using the ratio of this competing energy to the total supply (excluding natural gas) of competing energies. Energies that clearly do not compete with natural gas are excluded.
3. DATA AND ANALYSIS
3.1 Current situation
Based on the information presented on International Energy Outlook 2010 [7], the world’s proven reserves of gas in January 1, 2010 was 6,609 TCF (Trillion Cubic Feet). About 54.8% of natural gas reserves were located in Rusia, Iran and Qatar, while the amount of natural gas reserves of Indonesia was equivalent to 1.6% of the world gas reserves, and became the 14th top country with natural gas reserves [7]. Nowadays, Indonesia is still a significant producer and exporter in Asia. All the gas that is processed at the LNG plant is exported to Asian country such as Japan, China and South Korea. For domesic use, more than 70.9% of the natural gas is utilized in the energy transformation industry and 29.1% of it is consumed by end users in domestic market. The slow growth in domestic natural gas consumption is caused by the limited natural gas infrastructure, which needs high investment cost to develop the infrastructure. As the result, most of the natural gas distributors prefer the supply of bulk natural gas rather than household users in small quantities.
3.2 Shares of competing fuels in year 2000 – 2009
Code: E-250
The result of market value calculation has been converted from USD/BOE to USD/MMBTU to make it uniform unit in natural gas business. Other data which is needed to find netback market value at gas producer side is the delivery cost. Domestic delivery cost from natural gas producer to end user can be calculated using the data from local distribution company annual report that includes distribution cost, capital cost, employement cost, taxes, profits, etc. These data have been calculated from natural gas distribution revenue divided by total volume of sales. The result has been converted from local Indonesian currency (Rupiahs) per unit of volume, to USD/ MMBTU by exchange rate data year 2003 to 2009 (exchange rate year 2000-2002 used assumption 1 USD = Rp. 9,000,-). The delivery costs during the year 2000-2009 are shown in Table 5:
Table 5 Natural gas delivery cost year 2000 – 2009[4]
Delivery cost for Natural Gas transportation Year
2000 2001 2002 2003 2004 2005 2006 2007 2008 2009 Domestic cost from LDC (by pipeline) (USD/MMBTU) 1.03 0.97 1.03 1.25 1.26 1.47 2.56 2.61 2.62 3.37
4. RESULTS AND DISCUSSION
4.1 Calculation results
Based on data from Indonesian Local Distribution Company[4], the average domestic sale price of natural gas is derived by dividing the total sale revenue by the total volume of sale. The average cost for distributors can be calculated by dividing the total cost by the total volume of sale. The average domestic sale price and the average producer price for the year 2000-2009 are shown in Fig. 4.
Fig. 4 Actual average domestic sale price and producer price of natural gas in Indonesia during the year 2000-2009
Code: E-250
4th International Conference on Sustainable Energy and Environment (SEE 2011): A Paradigm Shift to Low Carbon Society 27-29 February 2012, Bangkok, Thailand
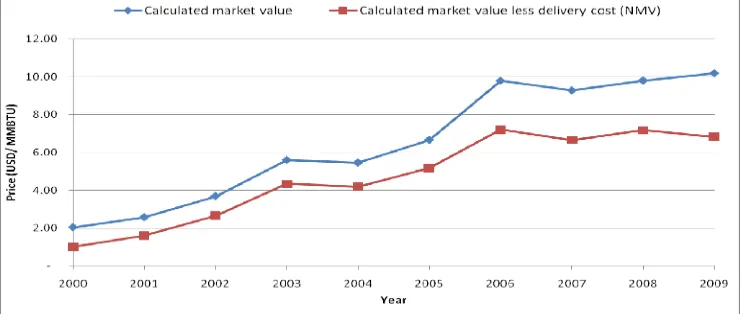
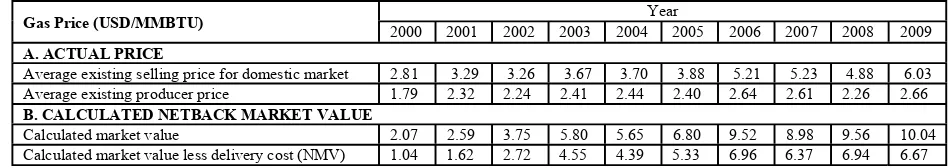
621 The natural gas export price has been much higher than the domestic price, which causes the gas producers to sell it to other countries where they can gain more profits than selling it in the domestic market for local consumption. The existing average gas selling price from producer (upstream) to distributor (downstream) has been stable almost at constant price, much lower compare to calculated NMV method. The detail of natural gas price shown in Table 6 below:
Table 6 Natural gas price year 2000 – 2009
Gas Price (USD/MMBTU) Year
2000 2001 2002 2003 2004 2005 2006 2007 2008 2009 A. ACTUAL PRICE
Average existing selling price for domestic market 2.81 3.29 3.26 3.67 3.70 3.88 5.21 5.23 4.88 6.03 Average existing producer price 1.79 2.32 2.24 2.41 2.44 2.40 2.64 2.61 2.26 2.66 B. CALCULATED NETBACK MARKET VALUE
Calculated market value 2.07 2.59 3.75 5.80 5.65 6.80 9.52 8.98 9.56 10.04 Calculated market value less delivery cost (NMV) 1.04 1.62 2.72 4.55 4.39 5.33 6.96 6.37 6.94 6.67
5. CONCLUSION AND REMARKS
The natural gas domestic price in Indonesia has been regulated at a much lower level than that of export price for a long period of time, which does not encourage the gas producers to increase their sale in the local market. Instead, the producers concentrate in the export markets which give more benefits to their sale. The netback market value, which determines the producer price by taking into account the market shares and their prices of the competing fuels to natural gas is proposed for the domestic market in Indonesia due to its stability and compatibility to the export price. The calculated value over the last decade has increased steadily and has been less affected by the fluctuations of crude oil prices.
6. ACKNOWLEDGMENT
The author thankfully acknowledges Dr. Athikom Bangviwat, and Dr. Ir. H. Djoni Bustan, M.Eng for his helpful consultation and assistance on this conference paper.
7. REFERENCES
[1] IEA (2010) Natural Gas Production, Export and Consumption.
[2] PLN (2000-2009) Electricity State Owned Company: Annual Report. Indonesia. [3] MEMR (2010) Handbook of Energy & Economics Statistics of Indonesia. Indonesia.
[4] PT. PGN (Persero) Tbk (2005-2009) Natural Gas LDC State Owned Company, Annual Report. Indonesia.
[5] Miyamoto, A., Ishiguro, C. and Yamada, T. (2009) Irrational LNG Pricing Impedes Development of Asian Natural Gas Markets: A Perspective on Market Value. Osaka Gas, Japan.
[6] Miyamoto, A. and Ishiguro, C. (2009) A New Paradigm of Natural Gas Pricing in Asia: A Perspective on Market Value. Oxford Institute for Energy Studies.
[7] IEA (2010) Keyworld Energy Statistic.
![Fig. 1 Natural gas price in different countries during the year 2000- 2009 [3]](https://thumb-ap.123doks.com/thumbv2/123dok/2824867.1689862/4.595.80.518.85.409/fig-natural-gas-price-different-countries-year.webp)
![Table 3 Indonesian share of natural gas competing fuel year 2000-2009[3] Competing Energy Shares (CES) year (%)](https://thumb-ap.123doks.com/thumbv2/123dok/2824867.1689862/6.595.64.538.376.760/table-indonesian-share-natural-competing-competing-energy-shares.webp)
![Table 4 Natural gas competing fuel’s price Year 2000 – 2009[2-4, 8, 9]](https://thumb-ap.123doks.com/thumbv2/123dok/2824867.1689862/7.595.44.557.351.750/table-natural-gas-competing-fuel-s-price-year.webp)