ULS LiDAR supported analyses of laser beam penetration from different ALS systems into
vegetation
M. Wieser a, M. Hollaus a, G. Mandlburger a, P. Glira a, N. Pfeifer a
a TU WIEN, Department of Geodesy and Geoinformation, Vienna, Austria – [email protected]
Commission III, WG III/2
KEY WORDS: tree height, ALB, underestimation, vegetation height, penetration, canopy
ABSTRACT:
This study analyses the underestimation of tree and shrub heights for different airborne laser scanner systems and point cloud distribution within the vegetation column. Reference data was produced by a novel UAV-borne laser scanning (ULS) with a high point density in the complete vegetation column. With its physical parameters (e.g. footprint) and its relative accuracy within the block as stated in Section 2.2 the reference data is supposed to be highly suitable to detect the highest point of the vegetation. An airborne topographic (ALS) and topo-bathymetric (ALB) system were investigated. All data was collected in a period of one month in leaf-off condition, while the dominant tree species in the study area are deciduous trees. By robustly estimating the highest 3d vegetation point of each laser system the underestimation of the vegetation height was examined in respect to the ULS reference data. This resulted in a higher under-estimation of the airborne topographic system with 0.60 m (trees) and 0.55 m (shrubs) than for the topo-bathymetric system 0.30 m (trees) and 0.40 m (shrubs). The degree of the underestimation depends on structural characteristics of the vegetation itself and physical specification of the laser system.
1. INTRODUCTION
Airborne laser scanning (ALS) has established itself as the state-of-the-art method for high precision topographic data acquisition over the last two decades. Several publications show the high potential of ALS for terrain modelling (Ackermann, 1999; Briese and Pfeifer, 2001; Kraus and Pfeifer, 1998; Kraus and Pfeifer, 2001), building modelling (Matikainen et al., 2003; Rottensteiner and Briese, 2003; Zhan et al., 2002) or vegetation related studies (Lim et al., 2003; Næsset, 2004b; Næsset et al., 2004), just to name a few applications. Especially with forestry related applications, the strength of ALS lies in the ability to capture both the terrain and the canopy height. This capability allows the direct tree height measurement (Holmgren, 2004; Hyyppä and Inkinen, 1999; Kwak et al., 2007; Lim et al., 2001; Næsset, 1997), which constitutes one of the most important forest parameters. Several studies have analysed the possibility of tree detection and tree height estimation based on the 3d point cloud or based on the derived canopy height models (CHM). The benchmark papers from Kaartinen and Hyyppä (2008) and from Eysn et al. (2015) provide an overview of available algorithms and their performance for different forest types and ALS data. In case the tree height estimation is based on the rasterized CHM, the applied method for deriving the digital surface model (DSM) (i.e. highest point within a raster cell, triangulation, moving planes interpolation, etc.) has a substantial effect on the achieved tree height accuracy (e.g. Hollaus et al., 2010). Several studies have investigated the accuracy of derived tree heights (Hollaus et al., 2006; Maltamo et al., 2004; Næsset, 2004a; Naesset, 2007), which often show an underestimation of the derived tree heights, provided that the analysed trees are standing approximately vertical. The studies of Gaveau und Hill (2003) and Hopkinson (2007) examined the canopy height underestimation due to laser beam penetration. These studies show the influence of flying altitude, beam divergence and pulse repetition frequency on the canopy point distribution but are limited to ALS scanners operating at a wavelength of ~1064 nm. Gaveau and Hill (2003) stated an underestimation for the raw point cloud of 1.27 m and 0.91 m for trees and shrub respectively, while Hopkins (2007)
provided relative underestimations for trees of 0.15 m to 0.61 m between different altitude, beam divergence and pulse repetition frequency. Furthermore, reference data for the above studies was acquired either with terrestrial laser scanners (TLS) or with Vertex clinometers. Especially in dense forests, the reference tree height measurements with the mentioned methods suffer from limited visibility of the canopy surface from viewpoints on the ground. Thus the available reference data makes studies about the assessment of tree height underestimation challenging or even unreliable.
The recent development of light weight laser scanning systems carried by unmanned aerial vehicles (UAVs) enable a unique way of reference data acquisition, which could revolutionize the surveying of forests with high precision. Therefore, the objective of this paper is to use UAV-borne laser scanning (ULS) data acquired with the Riegl VUX-SYS as reference for analysing the tree height estimation compared to data acquired with two ALS systems (Riegl LMS-Q-1560, Riegl VQ-880-G topo-bathymetric (ALB)) operating at different wavelength (1064/532 nm) and beam divergences (0.2/1.0 mrad). A secondary aim is to study the vertical echo distribution of the canopy in comparison. The different data sets were acquired for a deciduous dominated alluvial forest located in the eastern part of Austria as described in section 2. In section 3 the pre-processing of the different ALS data sets and the methods for analysing the tree height underestimation are described. The results are presented and discussed in section 4.
2. STUDY AREA AND DATA 2.1 Study area
The study area Neubacher Au is located at the lower course of the pre-alpine Pielach River near the Lower Austrian town Loosdorf (48°12'53.2"N 15°22'25.1"E, WGS 84) (Mandlburger et al., 2015a). It is a Natura2000 conservation area featuring a meandering river course. The riparian area is covered by grassland and alluvial forests (mostly deciduous trees with heights up to 35 m) (cf. Figure 1). On the northern side of the ISPRS Annals of the Photogrammetry, Remote Sensing and Spatial Information Sciences, Volume III-3, 2016
river, open grassland is present with low and high shrubs (Figure 1, greenish clusters). For analysing the penetration of the laser beam into the canopy 66 trees and 43 shrub objects have been manually selected based on the ALS derived normalized DSM (nDSM=DSM-DTM).
Figure 1. Overview of the study area; the ALS DSM shading is overlaid with the coloured ALS nDSM and the flight trajectories (black: ULS; red: ALS; green: ALB). The big black
dots represent analysed trees while the small ones represent bushes.
2.2 LS data acquisition
The data for the study at hand was captured with three different Riegl laser scanners each operating at a different wavelength (ALS: LMS-Q-1560/1064 nm, ALB: VQ-880-G/532 nm, ULS: VUX-SYS/1550 nm). The acquisition of the ULS and the ALS data was performed almost simultaneously on 26th February 2015, while ALB data was acquired one month later on the 20th March. In all cases data capturing took place under leave-off and snow-free conditions. Whereas the entire study area is fully covered by two ALS and ALB flight strips captured at 600 m a.g.l. a dense array of flight lines (strip distance: 40 m, flying altitude: 50 m a.g.l.) was used for the ULS data acquisition. The main sensor and data characteristics are summarized in Table 2.
The different mission parameters (flying altitude, scan rate, speed) and sensor properties (laser beam divergence β) result in individual laser footprint areas and point densities on the ground (Mandlburger et al, 2015b). The UAV-based system was mounted on a Riegl RiCOPTER X8-array octocopter carrier platform and flown at a speed of 8 m/s with an effective measurement rate of 350 kHz. In combination with the dense flight strip arrangement (cf Figure 1) and the large field of view (230°) a very high point density of more than 1000 points/m2 was achieved. Furthermore, the acquired point cloud describes the full 3D vegetation structure. The laser footprint diameter is dULS=1 cm in the canopy and dULS≤3 cm on the ground. In contrast, the point density of the airborne topographic (ALS) and topo-bathymetric (ALB) data is lower and the footprint sizes are
larger. Whereas eye safety considerations are responsible for the relatively large beam divergence of the green laser (βALB=1 mrad, dALB=60 cm), the near infrared laser beam of the ALS system is more collimated (βALS=0.25 mrad) resulting in non-overlapping footprints on the ground (dALS=15 cm). Furthermore, IR-based systems utilize longer pulses (ca. 4 ns) compared to the bathymetric sensor (ca. 1-2 ns). Together with the sampling frequency of recorded echo waveform (fIR=1 GHz, fGreen=2 GHz) this influences the range discrimination distance, i.e. the minimum distance for separating consecutive echoes of a single laser pulse. For more details please refer to Mandlburger et al. (2015c).
Flight
date Sensor Wave-length Altitude Foot-print density Point
26 Feb LMS-Q-1560 1064 nm 600 m 15 cm 21 pt/m² 26 Feb VUX-SYS 1550 nm 50 m 2.5 cm 1120 pt/m² 20 Mar VQ-880-G 532 nm 600 m 60 cm 15 pt/m²
Table 2.
Specifications of the used laser scanner systems2.3 Point density and echo distribution
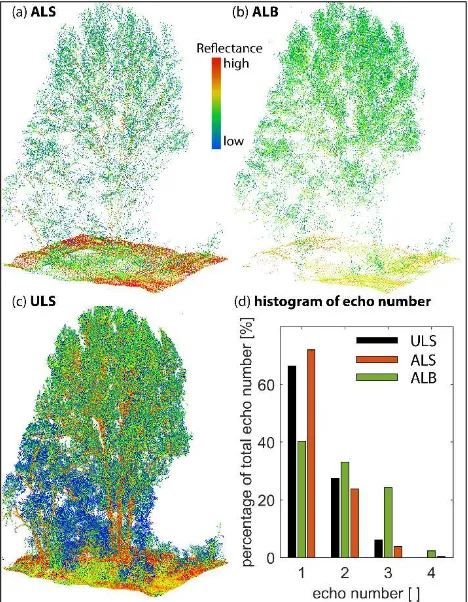
While the overall point density reported in Table 2 holds for open areas, in vegetation areas covered by shrub and especially trees the point density rises significantly due to multiple echoes originating from the complex 3d vegetation structure. As the number of echoes depends on several characteristics, like footprint size, pulse length, density of vegetation as the behaviour of the point density in vegetation is different to those in open areas. This will be stated in more detail in section 4.3. Figure 3 shows the point cloud of a tree and a bush from the three laser scanners.
Figure 3. (a-c) 3d point cloud of one tree color-coded with reflectance; (d) Histogram of echo numbers for all selected trees
and laser systems (cf. section 2.1). ISPRS Annals of the Photogrammetry, Remote Sensing and Spatial Information Sciences, Volume III-3, 2016
XXIII ISPRS Congress, 12–19 July 2016, Prague, Czech Republic
This contribution has been peer-reviewed. The double-blind peer-review was conducted on the basis of the full paper.
3. METHODS 3.1 ALS data pre-processing
To ensure direct comparability of the different 3d point clouds, the individual flight blocks were geometrically calibrated via rigorous strip adjustment based on the ICP algorithm (Glira, 2015) and co-registered using the ALS flight as reference. Quality control was carried out before and after co-registration using the scientific ALS software package OPALS (Pfeifer et al., 2014). The achieved a-posteriori relative accuracies1 are 0.7 cm for ALS, 1.5 cm for ULS, and 1.8 cm for the ALB (Mandlburger et al., 2015c).
3.2 Laser beam penetration analyses
The objective of this investigation is to quantify the underestimation of vegetation heights and the analysis of the 3d point distribution of airborne topographic and bathymetric data, compared to ULS data as a reference. For the quantification of the vegetation height underestimation trees and shrubs are analysed separately. As the focus of this study is not detecting individual trees in the 3d point cloud, representative tree and shrub positions were chosen manually (cp. section 2.1). To minimize the influence from neighbouring trees, i.e. from overhanging branches, only dominant trees and shrubs were selected. For each tree and shrub position the 3d point cloud is analysed in a circular area with a radius of 3.0 m and 1.3 m respectively. Within each circular area the maximum vegetation height was calculated robustly for each data set. To minimize influences from possible outlier points the vegetation height estimation is based on histogram analyses. The histograms are computed for height bins of 0.1 m and only 3d points meeting following conditions are considered. (1) ALS and ALB points cannot be higher than the highest point derived from ULS plus a tolerance of 0.15 m. Data analysis showed that ULS delivers the highest points within each search area in almost every case. (2) Points need to have at least 2 neighbors within a sphere of 0.8 m radius. (3) Single points at the top are not considered if no point is located within the lower 5 histogram bands of the vegetation column. This dismisses flying points within the height range of the tree/shrubs top. The vegetation height is estimated afterwards by the highest point within the selected histogram band. Figure 4a shows a histogram of the vertical point density structure for a tree with the estimated tree heights from the different laser scanning data. Height is given as difference to the ULS estimated top height In Figure 4b histogram from a shrub object is shown. The estimated vegetation heights of ALS and ALB are illustrated by its value and the throughout line in the figures. Only points within a vertical distance of 7.5 m for trees and 4.5 m for shrubs from the crown top were used to get the total number of points in the canopy for scaling the bin counts of the histograms in Figure 4.
Due to the complex structure of the available deciduous trees not all outliers could be removed by the applied approach, but in overall the remaining outliers are rare and do not influence the general outcome of this study. For visualization purposes, not only the absolute tree/shrubs heights are analyzed, but also the relative heights between the reference ULS height and the ALS and the ALB heights respectively.
Figure 4. Estimation of tree (a) and (b) shrub heights based on histogram of 3d points within vegetation column; the reference zero height is estimated from ULS data; black: ULS; green:
ALB; red: ALS.
4. RESULTS AND DISCUSSION 4.1 Vegetation height underestimation
The tree height differences between the estimated tree tops of ULS, ALS and ALB respectively were calculated for all 66 trees and are shown in Figure 5.
Figure 5. Differences of estimated tree top from ULS to ALS (red) and ULS to ALB (green).
For both, ALS and ALB tree tops are generally lower than those from ULS and the differences show a clear tendency that the tree height underestimation is less for ALB (-0.30 m ± 0.20 m) compared to ALS (-0.60 m ± 0.40 m). It should be noted that the mean deviations are significantly different from zero (one-sample T-Test: confidence level 95%, confidence interval: ALS: ±0.07m, ALB: ±0.05m; test statistic: ALS: 17.16, ALB: 11.84). ISPRS Annals of the Photogrammetry, Remote Sensing and Spatial Information Sciences, Volume III-3, 2016
In Figure 6 the histograms of the penetration depths (height difference to ULS top) of ALS and ALB for all trees are shown. It can be seen that the variance is higher for ALS than for ALB data.
Figure 6. Histogram of penetration depth for trees; red: ULS to ALS; green: ULS to ALB; brown: transparent overlaying of
smaller value
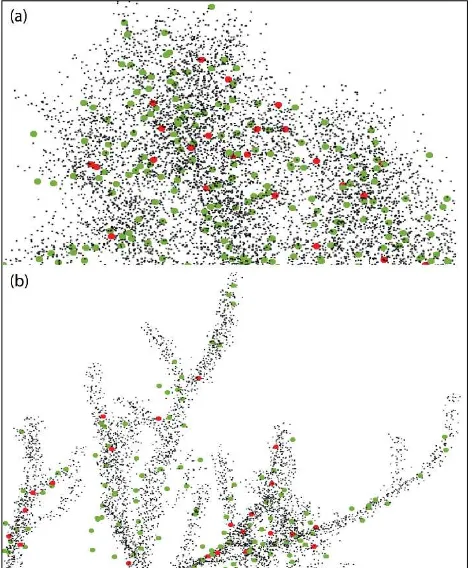
An explanation for the larger differences in the ALS can be found in the structure of these trees. The underestimation depends on the branch density and is less for dense canopies compared to a loose structure with single protruding top branches as seen in Figure 7. Figure 7a shows a typical dense branch system wherein the ALB and ALS points are spread, while for the single prominent branches ALB is more likely to follow the tree structure up to the top (Figure 7b).
Figure 7. (a) Tree with dense crown structure; (b) Tree sample with protruding single branches; black: ULS; green: ALB; red:
ALS
The explanation can be found in the larger footprint of the bathymetric sensor and its higher sensitivity. Compared to the
topographic ALS sensor, the ALB system utilizes higher laser pulse energy and features a larger receiver aperture. Therefore, this sensor is better capable of detecting weak signals from the top canopy layer.
For shrubs the same behaviour can be seen for ALS and ALB. In total 43 objects have been used to process the differences as stated before. In Figure 8 and Figure 9 the underestimation of the analysed shrubs are shown and are -0.55 m ± 0.20 m for ALS and -0.41 m ± 0.19 m for ALB (one-sample T-Test: confidence level 95%, confidence interval: ALS: ±0.06m, ALB: ±0.06m; test statistic: ALS: 16.78, ALB: 12.80).
Figure 8. Differences of estimated shrub heights from ULS to ALS (red) and ULS (green).
Again ALB data delivers smaller underestimations and variance than ALS data. Small branches also state a problem for ALS and ALB at shrub objects. But in contrast to thicker branches of trees for very small branches in shrub also the ALB appears to have not enough backscatter signal to detect an echo as seen in figure 10.
Figure 9. Histogram of penetration depth for shrubs; red: ULS to ALS; green: ULS to ALB; brown: transparent overlaying of
smaller value
4.2 Echo Distribution
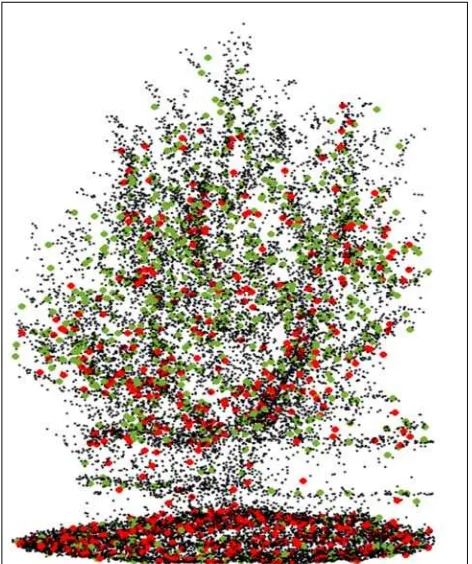
As already seen in the histograms of Figure 4 the ALB generates more echoes in the upper part of the vegetation column. While the overall point density in open area is slightly higher for the ALS system, within vegetation ALB generates more echoes. In fact the ALB systems receives more multi echoes than the ALS (see Figure 3). The ALS system generates 72% first echoes and smaller amount of second echoes (24%). For ALB, first echoes are 40%, second 33% and third echoes 24% of the overall points. Taking one shrub object this feature can be seen in Figure 10. While both ALB and ALS are not able to detect small branches, ISPRS Annals of the Photogrammetry, Remote Sensing and Spatial Information Sciences, Volume III-3, 2016
XXIII ISPRS Congress, 12–19 July 2016, Prague, Czech Republic
This contribution has been peer-reviewed. The double-blind peer-review was conducted on the basis of the full paper.
the ALB is generating a higher point density within the upper part of the vegetation column.
Figure 10. 3d point cloud of shrub object; black: ULS; green: ALB; red: ALS;
The corresponding histograms are shown in Figure 4b and Figure 11, which states that in the upper part of this object the ALB has double the points than ALS. Histogram in Figure 11 shows the absolute number of points as bin count. This characteristic was also seen in Figure 7a, which shows a tree with a dense crown structure. The explanation for the higher point density in the upper part of the vegetation was already given at the end of section 4.1 with a larger footprint of the bathymetric sensor and its higher sensitivity.
Figure 11. Histogram of 3d points within vegetation column in absolute numbers; the reference zero height is estimated from
ULS data; green: ALB; red: ALS.
4.3 Discussion
First echoes of ALS received from trees and shrubs tend to appear inside the vegetation structure. The most prominent factor for ALS and ALB in terms of penetration is clearly the density of the crown as a feature of the canopy structure in the upper part of the crown. Therefore, an overall underestimation value would be difficult to achieve due to varying vegetation structure within one species as revealed by the differences. As seen in the analyses ALB is less dependent on the crown structure than ALS. Comparable studies from Gaveau and Hill (2003) and Hopkins (2007) stated similar underestimations. Hopkins (2007) presented relative underestimation between different ALS configurations without reference data at all, which imposes an overall higher absolute underestimation. Overall, all underestimations from Gaveu, Hopkins and those estimated in this paper (ALS 0.6 m/0.55 m and ALB 0.3 m/0.4 m for trees/shrubs) state a significant difference between crown tops by ALS and the real ones. Generally the ULS can provide information of the upper part of the canopy to derive variations of density and branch systems at high resolution. Furthermore a small footprint of a few centimetre together with information about the relative accuracy of the block, the ULS is considered to be suitable as reference data for the upper part of the vegetation. For large areas derived by ALS systems, this may not be easy at all. Rising point density and different wavelengths of modern ALS systems promise to derive structural information of the upper part as well as already indicated in this paper. The underestimation values presented in this paper are valid for leaf-off condition and deciduous trees of an alluvial forest and to certain shrub types, which have not been investigated separately in terms of tree and shrub species. The high resolution of the ULS could be used to determine exactly how vegetation and its structure is mapped by different ALS systems which could be used to apply the underestimation values for different crown structures and species. Generally, the penetration into the canopy varies between different ALS systems, and of most importance is the footprint size of airborne systems compared to the UAV based ones. Besides this point, further differences between ALS systems relate to their design parameters like aperture size, wavelength, etc. and are the main reason for the scale of underestimation as already stated by Gaveau and Hill (2003). Despite different laser scanner systems, all ALS and ALB data is provided by operational systems and in almost identical flight arrangement, and therefore the relative differences in underestimation and vertical point distribution are inherent.
5. CONCLUSIONS
The results of this study clearly present an underestimation of vegetation heights derived from airborne laser scanner systems. While the most prominent factor for underestimation is the footprint size of airborne systems, other characteristics of the different airborne systems can lead to different scales of underestimation of vegetation heights.
In addition, the vegetation structure itself has an influence on the capability to gather 3d points within the canopy which has been stated for crown density and branch structure. A clear tendency uncovered is for ALB to have lower underestimations of vegetation heights than ALS. For ALS the mean value of underestimation is 0.6 m/0.55 m and for ALB 0.3 m/0.4 m for trees and shrub respectively within the prevailing conditions i.e., leaf-off-condition, tree and shrub species, flight parameters, etc. Knowledge about the penetration depth of different laser scanning systems can be important in terms of confidence in vegetation heights gathered by airborne systems. With increasingly available multi-temporal laser scanning data sets ISPRS Annals of the Photogrammetry, Remote Sensing and Spatial Information Sciences, Volume III-3, 2016
from different sensors, the knowledge regarding the penetration properties becomes of particular importance for operational forestry applications. The data presented in this paper shows a very high potential of ULS for reference data acquisition. Especially the capability to map upper parts of the canopy with extremely high density could be useful information for various vegetation related research. With its small footprint of about 1 cm in the upper part of the vegetation the ULS is as well suitable to investigate how ALS and ALB is interacting with different types of vegetation and small structures. Furthermore, the fact that ALB tends to deliver higher point densities within the tree crown than normal ALS, could result in positive effects for tree crown and biomass estimations.
ACKNOWLEDGEMENTS
The data presented in this work was provided by the company
RIEGL Laser Measurement Systems GmbH, an Austrian located
company, specialized in building and developing laser scanner systems. Parts of this study are founded from the European Community’s Seventh Framework Programme (FP7/2007–2013) under grant agreement No. 606971, the Advanced_SAR project.
REFERENCES
Ackermann, F., 1999. Airborne laser scanning - present status and future expectations. ISPRS Journal of Photogrammetry & Remote Sensing 54, 64-67.
Briese, C., Pfeifer, N., 2001. Airborne Laser Scanning and Derivation of Digital Terrain Models. In: Grün\Kahmen (Editor), Optical 3-D Measurement Techniques V, pp. 80 - 87.
Eysn, L., Hollaus, M., Lindberg, E., Berger, F., Monnet, J.-M., Dalponte, M., Kobal, M., Pellegrini, M., Lingua, E., Mongus, D., Pfeifer, N., 2015. A Benchmark of Lidar-Based Single Tree Detection Methods Using Heterogeneous Forest Data from the Alpine Space. Forests 2015, 6, pp. 1721-1747.
Gaveau, D.L.A., Hill, R.A., 2003. Quantifying canopy height underestimation by laser pulse penetration in small-footprint airborne laser scanning data. Canadian Journal of Remote Sensing 29 (5), 650-657.
Glira, P., Pfeifer, N., Briese, C., Ressl, C, 2015. Rigorous strip adjustment of airborne laserscanning data based on the ICP algorithm. ISPRS Annals of Photogrammetry, Remote Sensing and Spatial Information Sciences, Vol. II3/W5 (2015), pp. 73 -80.
Hollaus, M., Mandlburger, G., Pfeifer, N., Mücke, W., 2010. Land cover dependent derivation of digital surface models from airborne laser scanning data, ISPRS Commission III Symposium PCV 2010 -- Photogrammetric Computer Vision and Image Analysis, Paris, pp. 221-226.
Hollaus, M., Wagner, W., Eberhöfer, C., Karel, W., 2006. Accuracy of large-scale canopy heights derived from LiDAR data under operational constraints in a complex alpine environment. ISPRS Journal of Photogrammetry & Remote Sensing 60 (5), pp. 323-338.
Holmgren, J., 2004. Prediction of Tree Height, Basal Area and Stem Volume in Forest Stands Using Airborne Laser Scanning. Scandinavian Journal of Forest Research 19 (6), pp. 543-553.
Hopkinson, C., 2007. The influence of flying altitude and beam divergence on canopy penetration and laser pulse return distribution characteristics. Canadian Journal of Remote Sensing 33 (4), pp. 312–324.
Hyyppä, J., Inkinen, M., 1999. Detecting and estimating attributes for single trees using laser scanner. The Photogrammetric Journal of Finland 16 (2), pp. 27-42.
Kaartinen, H., Hyyppä, J. EuroSDR/ISPRS Project, Commission II “Tree Extraction”, Final Report; EuroSDR (European Spatial Data Research), Dublin, Ireland, 2008.
Kraus, K., Pfeifer, N., 1998. Determination of terrain models in wooded areas with airborne laser scanner data. ISPRS Journal of Photogrammetry & Remote Sensing 53 (4), pp. 193-203.
Kraus, K. and Pfeifer, N., 2001. Advanced DTM generation from LIDAR data. In: (Eds.): International Archives of Photogrammetry and Remote Sensing, Volume XXXIV-3/W4, Annapolis, MD, 22-24 Oct., 22-24 Oct., pp. 23-30.
Kwak, D.-A., Lee, W.-K., Lee, J.-H., Biging, G.S. and Gong, P., 2007. Detection of individual trees and estimation of tree height using LiDAR data. Journal of Forest Research 12 (6), pp. 425-434.
Lim, K., Treitz, P., Baldwin, K., Morrison, I. and Green, J., 2003. Lidar remote sensing of biophysical properties of tolerant northern hardwood forests. Canadian Journal of Remote Sensing 29 (5), pp. 658-678.
Lim, K., Treitz, P., Groot, A., St-Onge, B., 2001. Estimation of individual tree heights using LIDAR remote sensing. In: (Eds.): Proceedings of the Twenty-Third Annual Canadian Symposium on Remote Sensing, Quebec, QC, August 20-24, 2001.
Maltamo, M., Mustonen, K., Hyyppä, J., Pitkänen, J., Yu, X., 2004. The accuracy of estimating individual tree variables with airborne laser scanning in a boreal nature reserve. Canadian Journal of Forest Research 34 (9), pp. 1791–1801.
Matikainen, L., Hyyppä, J., Hyyppä, H., 2003. Automatic Detection of Buildings from Laser Scanner Data for Map Updating. International Archives of Photogrammetry, Remote Sensing and Spatial Information Sciences XXXIV (Part 3/W13), pp. 218-224.
Mandlburger, G., Otepka, J., Karel, J., Wagner, W., Pfeifer, N., 2012. Orientation and Processing Of Airborne Laser Scanning Data (OPALS) - Concept and First Results of a Comprehensive Als Software. IAPRS, Vol. XXXVIII, Part 3/W8 (2009), pp. 55 - 60.
Mandlburger, G., Hauer, C., Wieser, M., Pfeifer, N., 2015a, Topo-Bathymetric LiDAR for Monitoring River Morphodynamics and Instream Habitats — A Case Study at the Pielach River, Remote Sensing, Vol. 7-5 2015, pp. 6160-6195.
Mandlburger, G., Hollaus, M., Glira, P., Wieser, M., Milenkovic, M., Riegl, U., Pfennigbauer, M., 2015b, First examples from the RIEGL VUX-SYS for forestry applications, Proceedings of SilviLaser 2015, pp. 105--107
Mandlburger, G. , Pfennigbauer, M., Riegl, U., Haring, A., Wieser, M., 2015c. Complementing airborne laser bathymetry with UAV-based lidar for capturing alluvial landscapes. Proc. ISPRS Annals of the Photogrammetry, Remote Sensing and Spatial Information Sciences, Volume III-3, 2016
XXIII ISPRS Congress, 12–19 July 2016, Prague, Czech Republic
This contribution has been peer-reviewed. The double-blind peer-review was conducted on the basis of the full paper.
SPIE 9637, Remote Sensing for Agriculture, Ecosystems, and Hydrology XVII, 96370A (October 14, 2015);
Næsset, E., 1997. Determination of mean tree height of forest stands using airborne laser scanner data. ISPRS Journal of Photogrammetry & Remote Sensing 52 (2), pp. 49-56.
Næsset, E., 2004a. Accuracy of Forest Inventory Using Airborne Laser scanning: Evaluating the First Nordic Full-scale Operational Project. Scandinavian Journal of Forest Research 19, pp. 554-557.
Næsset, E., 2004b. Practical Large-scale Forest Stand Inventory Using a Small-footprint Airborne Scanning Laser. Scandinavian Journal of Forest Research 19 (2), pp. 164-179.
Naesset, E., 2007. Airborne laser scanning as a method in operational forest inventory: Status of accuracy assessments accomplished in Scandinavia. Scandinavian Journal of Forest Research 22 (5), pp. 433-442.
Næsset, E., Gobakken, T., Holmgren, J., Hyyppä, H., Hyyppä, J., Maltamo, M., Nilsson, M., Olsson, H., Persson, Å, Söderman, U., 2004. Laser scanning of forest resources: the Nordic experience. Scandinavian Journal of Forest Research 19 (6), pp. 482-499.
Pfeifer, N., Mandlburger, G., Otepka, J., Karel, W., 2014. OPALS - A framework for Airborne Laser Scanning data analysis. Computers, Environment and Urban Systems 45, pp. 125-136.
Rottensteiner, F., Briese, C., 2003. Automatic Generation of Building Models from LiDAR Data and the Integration of Aerial Images. In: (Eds.): International Society of Photogrammetry and Remote Sensing, Proceedings of the ISPRS working group III\3 workshop "3-D reconstruction from airborne laserscanner and InSAR data", 8-10 October, Volume XXX IV, PART 3 \ W13, Dresden, Germany.
Zhan, Q., Molenaar, M., Tempfli, K., 2002. Building Extraction from Laser Data by Reasoning on Image Segments in Elevation Slices. In: (Eds.): Photogrammetric Computer Vision (PCV'02), ISPRS Commission III, Symposium 2002, 9-13 September, Graz, Austria, 4.