EVALUATION OF THE USER STRATEGY ON 2D AND 3D CITY MAPS
BASED ON NOVEL SCANPATH COMPARISON METHOD
AND GRAPH VISUALIZATION
J. Dolezalova a, S. Popelka a*a Department of Geoinformatics, Faculty of Science, Palacký University Olomouc, 77146, Olomouc, Czech Republic (jitka.dolezalova, stanislav.popelka)@upol.cz
Theme Session 16, ThS 16
KEY WORDS: Eye-tracking, User Perception, Search Strategy, Scanpath Comparison, Simple Graphs, Cliques
ABSTRACT:
The paper is dealing with scanpath comparison of eye-tracking data recorded during case study focused on the evaluation of 2D and 3D city maps. The experiment contained screenshots from three map portals. Two types of maps were used - standard map and 3D visualization. Respondents’ task was to find particular point symbol on the map as fast as possible.
Scanpath comparison is one group of the eye-tracking data analyses methods used for revealing the strategy of the respondents. In cartographic studies, the most commonly used application for scanpath comparison is eyePatterns that output is hierarchical clustering and a tree graph representing the relationships between analysed sequences. During an analysis of the algorithm generating a tree graph, it was found that the outputs do not correspond to the reality. We proceeded to the creation of a new tool called ScanGraph. This tool uses visualization of cliques in simple graphs and is freely available at www.eyetracking.upol.cz/scangraph.
Results of the study proved the functionality of the tool and its suitability for analyses of different strategies of map readers. Based on the results of the tool, similar scanpaths were selected, and groups of respondents with similar strategies were identified. With this knowledge, it is possible to analyse the relationship between belonging to the group with similar strategy and data gathered from the questionnaire (age, sex, cartographic knowledge, etc.) or type of stimuli (2D, 3D map).
1. INTRODUCTION
Scanpath comparison is one group of the eye-tracking data analyses methods. These methods were developed for revealing the strategy of the respondents during observation of the stimuli. One of the most frequently used methods is String Edit Distance, which is used to measure the dissimilarity of character strings. As Duchowski et al. (2010) mentions, scanpath comparison based on the String Edit Distance introduced by Privitera and Stark (2000) was one of the first methods to compare quantitatively not only the loci of fixations but also their order. For the use of String Edit Distance, the grid or Areas of Interest have to be marked in the stimulus. The gaze trajectory (scanpath) is then replaced by a character string representing the sequence of fixations with a character for the AOIs they hit.
The most commonly used application for String Edit Distance in cartographic studies is eyePatterns (West et al., 2006) that output is hierarchical clustering and a tree graph representing the relationships between analysed sequences.
String Edit Distance in eyePatterns was used for example in the study of Coltekin et al. (2010) who examined dynamic visual analytics displays. In the resulting tree graph, clusters of participants were identified visually. EyePatterns together with Path Similarity Analysis (Andrienko et al., 2012) was also used in authors’ paper (Popelka et al., 2013). The aim of the study was to identify map readers' typology based on their eye-movements while solving the geographical tasks with the use of a map. During an analysis of the algorithm generating a tree graph, it was found that the outputs do not correspond to the reality. With the increasing number of iterations, the closer sequences in the graph do not have a lower score in the matrix and their position
* Corresponding author
in the graph is not correct. This situation is caused by the fact, that similarity relation is not transitive.
We proceeded to the creation of a new tool called ScanGraph. This tool uses visualization of cliques in simple graphs. Although our visualization does not connect all sequences, the output corresponds to the similarity matrix and display the simple graph with cliques. These cliques show similar sequences based on the input parameter of the degree of similarity.
Algorithms used in eyePatterns were modified to be more appropriate for the analysis of eye-tracking data, where character strings have different lengths.
2. METHODS
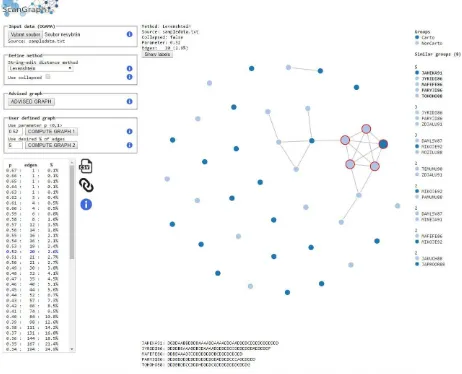
The ScanGraph application was created using PhP, C# (backend) and D3.js (frontend). Its interface can be seen in Figure 1. The application works with data exported from open source application OGAMA (Voßkühler et al., 2008). Sequence similarity measures from OGAMA can be exported to text file – and this text file can be imported directly to ScanGraph. This is one of the advantages against eyePatterns, which needs data in the specific format and it is necessary to prepare it in a text file or table processor.
The calculation of similar groups could be described in several steps. At first the distance matrix is constructed using Levenshtein (Levenshtein, 1966) or Needleman-Wunsch (Needleman and Wunsch, 1970) algorithm. However, it is not appropriate to use the absolute value of the distance to comparing the similarities. Hence, the values were normalized. Each of the element of the matrix is divided by the higher value of the length of strings and . The next step is creation of the adjacency
The International Archives of the Photogrammetry, Remote Sensing and Spatial Information Sciences, Volume XLI-B2, 2016 XXIII ISPRS Congress, 12–19 July 2016, Prague, Czech Republic
This contribution has been peer-reviewed.
matrix, which depends on the user’s choice of “advised graph”, parameter or percent of possible edges.
“Advised Graph” is a graph with 5 % of possible edges and the corresponding value of parameter . This (advised) graph is user-friendly and according to our experiences has a very high interpretive value about the similarities. The second option is a construction of user-defined graph. The graph will be created according to parameter or % of edges. The higher value of , the higher similarity of the given sequences. For smaller values of parameter , it is not possible to find the optimal solution and heuristic calculation is used instead of calculation based on brute-force algorithm.
More information about ScanGraph can be found in Dolezalova and Popelka (2016).
Figure 1 The interface of the ScanGraph application
3. CASE STUDY
For evaluation of non-photorealistic 3D visualization, an eye-tracking experiment was created. Its aim was to determine if 3D visualization affects user perception of city maps during the search for a specific point on the map.
Total of 40 participants (24 females, 16 males) attended the eye-tracking experiment. Respondents were originated from different fields. Some of them were cartographers, some of them were not. The majority of participants were 20-25 years old, and they were not paid for the testing.
The aim of the experiment was to verify if a finding of the target will be harder on stimuli with a 3D variant of maps.
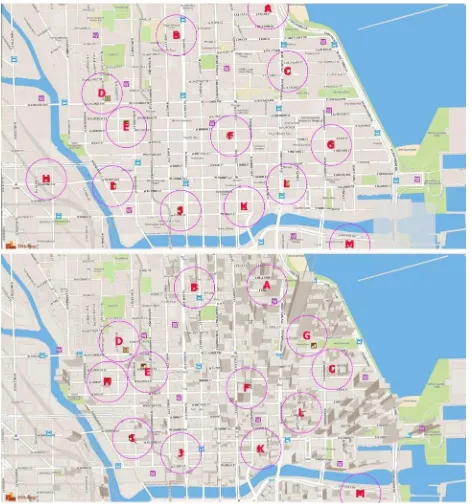
The experiment contained screenshots of different internet map portals (Figure 2). These maps were complemented with point symbols. Two types of maps were used - the first one was a standard map with buildings represented by polygons, second contained 3D visualization of buildings.
One of the most important issues in eye-tracking data analysis is event detection of recorded data. For almost all analyses, the fixations and saccades are needed. Eye-tracking data were recorded with a sampling frequency of 120 Hz, so the dispersion algorithm (I-DT), which is more appropriate for the low-frequency data, was used. The threshold values were set to 80 ms (duration) and 50px (dispersion). These values were selected based on the author’s study (Popelka, 2014), which compares four settings, used in cartographic papers and identified the thresholds, which fits to the recorded raw data.
For statistical analysis of movement data, several eye-tracking metrics were calculated - Time to Answer (click), Fixation Count, Fixation Duration Median and Scanpath Length. The biggest difference between 2D and 3D visualization was found for all metrics in the case of stimuli no. 9. This result was expected, because the 3D map no. 9 was tilted and orientation in this map was harder.
Figure 2 Pairs of 2D (left) and 3D (right) stimuli. A: Google Maps (source: http://maps.google.com), B: OSMbuildings
(source: http://osmbuildings.org), C: F4map (source: http://map.f4-group.com)
Higher values for the Fixation Count metric in the 2D variant were observed for three map pairs. For remaining maps, the higher values were observed for the 3D variant of the maps. A similar situation occurred for all other analyzed metrics. Then, the comparison of the differences between 2D and 3D for all stimuli together was performed. Statistically significant differences were found for metrics Time to Answer and Fixation Duration. Higher values of both metrics were observed for the 3D variant of the map. The biggest difference between 2D and 3D variant for all measured metrics was found for a pair of stimuli no. 9 (F4 Map). These values affected the results. Without including a pair of stimuli no. 9 in the statistical comparison, no statistically significant difference for any of the monitored eye-tracking metrics was found. More detailed description of statistical analysis and visual analytics of data using FlowMap method (Andrienko et al., 2012) are described in Popelka and Doležalová (2015).
In this paper, we have focused more on the evaluation of similarity of sequences during point symbol finding. The results can help us to find participants who choose the similar strategy.
4. RESULTS
Areas of Interest were marked in the OGAMA software around all added point symbols. The correct answer, in this case, was AOI C (Figure 3).
Character strings representing the sequences of visited AOIs were exported using OGAMA’s tool “Levenshtein Distance Calculation”. This file was then analysed in ScanGraph with the use of Levenshtein algorithm and non-collapsed variant of the calculation. The “Advised Graph” was constructed and contained 37 edges (4.7% of maximum possible edges (780)). The value of parameter is 0.58 in this case. Total of 18 cliques were found.
The International Archives of the Photogrammetry, Remote Sensing and Spatial Information Sciences, Volume XLI-B2, 2016 XXIII ISPRS Congress, 12–19 July 2016, Prague, Czech Republic
This contribution has been peer-reviewed.
The biggest one consist of 5 sequences (participants). All of them were females (that is represented by a colour). They started their gaze trajectories in AOI F followed by AOI E. Then they moved their eyes to different AOIs, and all of them have finished in the correct answer (AOI C), and they performed five fixations there (see Figure 4).
Figure 3. Areas of Interest marked around added points in 2D (up) and 3D (bottom) variant of stimuli 08 of the case study
Figure 4. Result of ScanGraph for 2D variant of stimulus.
Trajectories of the five participants consisted in the biggest clique were displayed in OGAMA (Figure 5). It is visible that these participants visually inspect just a small part of the stimulus, mainly around the AOIs F, E, C. The difference between the rest of participants (displayed as grey lines) is evident.
Figure 5. Trajectories of five participants consisted in the biggest clique (colour lines) and the rest of participants (grey lines).
When the same process was applied to the 3D variant of the stimulus, the advised graph consists of the 38 edges (4.9%). In this case, the resulting parameter for this settings is 0.69. The similarity between participants was higher in the case of 3D variant. The biggest clique for this settings contained six participants (four males and two females). Most of the sequences in this clique started again in the AOI F, but then the gaze pointed directly to AOI C with the correct answer. The cut of the 3D variant of the stimulus displaying this situation is displayed in the Figure 6.
Figure 6. Trajectories of six participants consisted in the biggest clique
Statistical evaluation of the difference between the group of six participants and the rest was performed. Statistically significant difference was found for the eye-tracking metric Scanpath Length. The value of Scanpath Length was significantly lower for the group of six participants (Figure 7). According to Goldberg et al. (2002), a shorter scanpath indicates more efficient searching. This example shows the possibility of ScanGraph - to quickly find participants with the similar strategy of eye-movements between predefined AOIs.
Fig. 7 Boxplot showing the difference in Scanpath Length metric between the group of six participants and the rest of participants
The International Archives of the Photogrammetry, Remote Sensing and Spatial Information Sciences, Volume XLI-B2, 2016 XXIII ISPRS Congress, 12–19 July 2016, Prague, Czech Republic
This contribution has been peer-reviewed.
5. DISCUSSION
Foulsham et al. (2012) pointed to the disadvantage of String Edit Distance, which is reducing distances to binary classification (because of the necessity of the creation of Areas of Interest). For some applications, like cartography is, it may be advantageous to divide the stimuli (map) to Areas of Interest. These Areas of Interest can be created around map composition elements or, as in our case study, around the targets - point symbols.
In the case study, the participants were grouped according to their sex to males and females. It is possible to create groups according to the expertise of the participants (experts vs. novices) or according to any other division.
As is discussed above, until now the scanpath comparison in cartographic studies was made using eyePatterns application (West et al., 2006). The output of this application is a tree graph. Unfortunately, this tree graph does not reflect the similarity measured by used algorithms. From the tree graph, similar groups could be found only visually (e.g. (Coltekin et al., 2010)) - what was very inaccurate. Our approach did not connect all sequences (participants), but the created groups of similar participants correspond to the computations. The user knows that the identified group is similar according to given parameter - which was not possible in eyePatterns. The algorithms for calculating similarity were modified to match better the eye-movement data where the strings have a different length. Another benefit of application ScanGraph for the evaluation of differences between 2D and 3D maps of the cities. The application performs scanpath comparison based on the String Edit Distance method. Until now, the application eyePatterns was used for this purposes. We have found that results of the eyePatterns are not reliable. The functionality of the ScanGraph application was presented on the example of the case study dealing with 2D and 3D maps. The task in this study was to find the point symbol on the map.
For the paper, analysis of one pair of stimuli was selected. In the first one (2D), a clique (a group of similar sequences/participants) containing five participants was found. All of them were females. In the 3D variant of the same stimuli, the group of six participants with similar strategy was found. All of these participants visually inspect only a few Areas of Interest and then performed a number of fixations in the target AOI. Statistical analysis of the difference between these six participants and the rest of participants shown statistically significant difference in Scanpath Length metric. These results showed that the group found by ScanGraph had the similar strategy which was advantageous for solving the task.
ACKNOWLEDGEMENTS
This paper was supported by projects of Operational Program Education for Competitiveness – European Social Fund (projects CZ.1.07/2.3.00/20.0170), of the Ministry of Education, Youth and Sports of the Czech Republic and the student project IGA_PrF_2016_008 of the Palacky University.
REFERENCES
Andrienko, G., Andrienko, N., Burch, M., Weiskopf, D., 2012. Visual Analytics Methodology for Eye Movement Studies.
Visualization and Computer Graphics, IEEE Transactions on 18, 2889-2898.
Coltekin, A., Fabrikant, S., Lacayo, M., 2010. Exploring the efficiency of users' visual analytics strategies based on sequence analysis of eye movement recordings. International Journal of Geographical Information Science 24, 1559-1575.
Dolezalova, J. & Popelka, S. (2016). ScanGraph: A novel scanpath comparison method using graph cliques visualization.
Journal of Eye Movement Research, In Print.
Duchowski, A.T., Driver, J., Jolaoso, S., Tan, W., Ramey, B.N., Robbins, A., 2010. Scanpath comparison revisited, Proceedings of the 2010 Symposium on Eye-Tracking Research & Applications. ACM, pp. 219-226.
Foulsham, T., Dewhurst, R., Nyström, M., Jarodzka, H., Johansson, R., Underwood, G., Holmqvist, K., 2012. Comparing scanpaths during scene encoding and recognition: A multi-dimensional approach.
Goldberg, J.H., Stimson, M.J., Lewenstein, M., Scott, N., Wichansky, A.M., 2002. Eye tracking in web search tasks: design implications, Proceedings of the 2002 symposium on Eye tracking research & applications. ACM, pp. 51-58.
Levenshtein, V.I., 1966. Binary codes capable of correcting deletions, insertions, and reversals, Soviet physics doklady, pp. 707-710.
Needleman, S.B., Wunsch, C.D., 1970. A general method applicable to the search for similarities in the amino acid sequence of two proteins. Journal of molecular biology 48, 443-453.
Popelka, S., 2014. Optimal eye fixation detection settings for cartographic purposes. 14th SGEM GeoConference on Informatics, Geoinformatics and Remote Sensing 1, 705-712 pp. Popelka, S., Doležalová, J., 2015. Non-photorealistic 3D Visualization in City Maps: An Eye-Tracking Study, Modern Trends in Cartography. Springer, pp. 357-367.
Popelka, S., Dvorsky, J., Brychtova, A., Hanzelka, J., Sgem, 2013. User typology based on eye-movement paths,
Geoconference on Informatics, Geoinformatics and Remote Sensing - Conference Proceedings, Vol I, pp. 1041-1048. Privitera, C.M., Stark, L.W., 2000. Algorithms for defining visual regions-of-interest: Comparison with eye fixations.
Pattern Analysis and Machine Intelligence, IEEE Transactions on 22, 970-982.
Voßkühler, A., Nordmeier, V., Kuchinke, L., Jacobs, A.M., 2008. OGAMA (Open Gaze and Mouse Analyzer): open-source software designed to analyze eye and mouse movements in slideshow study designs. Behavior research methods 40, 1150-1162.
West, J.M., Haake, A.R., Rozanski, E.P., Karn, K.S., 2006. eyePatterns: software for identifying patterns and similarities across fixation sequences, Proceedings of the 2006 symposium on Eye tracking research & applications. ACM, pp. 149-154.
The International Archives of the Photogrammetry, Remote Sensing and Spatial Information Sciences, Volume XLI-B2, 2016 XXIII ISPRS Congress, 12–19 July 2016, Prague, Czech Republic
This contribution has been peer-reviewed.