COMPARISON OF SEMI AUTOMATIC DTM FROM IMAGE MATCHING WITH DTM
FROM LIDAR
Aji Rahmayudi, Aldino Rizaldy
Center of Topographic Mapping and Toponyms, Geospatial Information Agency, Bogor, Indonesia (aji.rahmayudi, aldino.rizaldi)@big.go.id
Commission III, WG III/2
KEY WORDS: Automatic DTM, Image Matching, LIDAR
ABSTRACT:
Nowadays DTM LIDAR was used extensively for generating contour line in Topographic Map. This method is very superior compared to traditionally stereomodel compilation from aerial images that consume large resource of human operator and very time consuming. Since the improvement of computer vision and digital image processing, it is possible to generate point cloud DSM from aerial images using image matching algorithm. It is also possible to classify point cloud DSM to DTM using the same technique with LIDAR classification and producing DTM which is comparable to DTM LIDAR. This research will study the accuracy difference of both DTMs and the result of DTM in several different condition including urban area and forest area, flat terrain and mountainous terrain, also time calculation for mass production Topographic Map. From statistical data, both methods are able to produce 1:5.000 Topographic Map scale.
1. INTRODUCTION
1.1 Motivation
Indonesia is very large country consisting almost 500 cities and regencies. There was law on Detail Spatial Planning released by Ministry of Public Works on 2013 that required 1:5.000 topographic maps as a reference for Detail Spatial Planning. Production of 1:5.000 topographic maps was depending on aerial image and LIDAR. There are only small number of private company in Indonesia have these sensor.
According to the Term of Reference (TOR) for 1:5.000 Topographic Mapping Production released by Indonesian Geospatial Information of Agency, the production of DTM in 1:5.000 topographic map is divided by two methods: stereomodel from aerial image and point clouds LIDAR. Digital Terrain Model (DTM) is very costly component for topographic maps; it was used to generate contour line. While LIDAR is very powerful to generate DTM, aerial image is quite slow mainly due to the manual workflow of DTM generation.
For over ten years, Indonesian Geospatial Information Agency use 3D stereoplotting to get elevation value from digital aerial photo for produce DTM. DTM from stereomodel is generated from mass points and breaklines. Mass points are produced every 2 – 20 meter (depend on the terrain) by human operator. This was very costly and labour workflow.
Until for last three years, we start moving forward to use LIDAR technology for produce DTM and/ or DSM. Where in the same time, for the last decade airborne LIDAR (Light Detection and Ranging) has established itself as a key technology to capture high resolution Digital Surface Models (DSM) and/ or Digital Elevation Models (DEM) with higher accuracy and higher resolution. Point density from LIDAR is easily meeting this requirement. This method is very superior compared to traditionally stereomodel compilation from aerial photos. LIDAR is became first choice to fulfill this demand for various applications, including for orthophoto production.
However, additional LIDAR acquisition costs is often considered too expensive if its use for ground ortho-rectification. Then it is become new problem when we need use this method for very large area, especially for Indonesian area.
If there is no improvement from aerial image workflow, it is absolutely clear that it will be better to use LIDAR rather than aerial image. But, since the improvement of computer vision and digital image processing, it is possible to generate point cloud DSM from aerial images using image matching algorithm. It is also possible to classify point cloud DSM to DTM using the same technique with LIDAR classification and producing DTM which is comparable to DTM LIDAR. We believe this method could help us to solve the problem.
This research will study the accuracy difference of both DTMs and the result of DTM in several different condition including urban area with flat terrain and forest area with mountainous terrain, also time calculation for mass production 1: 5000 Topographic Map Scale.
1.2 Short Overview
Image matching methods is find areas in 2 overlapping images which correspond either by their features or grey values. It involves the location of similar but not identical areas of the 2 overlapping digital images of the same point taken from different locations to compute the 3D object coordinates of the point. Since the development of computer vision and many methods were developed to build Digital Surface Model (DSM) by image matching methods like Area Based Matching (ABM), Feature Based Matching (FBM), Least Square Matching (LSM) or Semi Global Matching (SGM), it is also possible to filter DSM to obtain DTM using point clouds LIDAR processing approach. Quality and accuracy point cloud from image matching is affected by the following factors of matching algorithm and terrain condition described below (Trinder, 2014):
1. ABM, Cross Correlation is easier to program, but does not compensate for errors in geometry between the two images
2. FBM may be less affected by differences in object geometry, but more complex to program
3. LSM is more time consuming, but more accurate since it compensates for errors in image geometry. 4. SGM enables determination of elevations of every
pixel
5. Objects on the terrain, especially buildings and trees. 6. Density of the objects on the terrain – manual editing
will always be necessary, which may be very time consuming
7. Image matching accuracy is usually of the order of 0.5 to 1 pixel.
Filtering DSM to obtain DTM using point clouds LIDAR processing approach is requires very high DSM/DEM resolution. Generating a very high DSM/DEM resolution is presumes matching at the actual image resolution in the order of the image ground sampling distance (GSD). Algorithms that globally minimize both cost and constraints are called global image matching approaches in terms of quality and resolution. The image matching approach that suited for DSM collection in very high resolution is SGM method (Gehrke, S., et al, 2010).
However, in this paper is not talk about superiority of SGM method. This research will processing DSM to obtain DTM using point clouds LIDAR processing approach on point clouds that generated from image matching in general.
1.3 Major Difference and Comparison Aspect of Point Cloud image matching with LIDAR
Point cloud from LIDAR is directly obtained from sensor while point cloud from image matching is obtained from data processing. There are some major difference between LIDAR and image matching.
First, degree of automation processing each system, Baltsavias (1999) has shown that there are some differences between LIDAR and image matching. He said that LIDAR can provide under ideal conditions fully automatically raw X, Y, Z data in point cloud. However this data still needs manual editing for error correction and fill-in of gaps, although filtering-out of vegetation and buildings can be automated to a high degree. While in image matching method, filtering DSM to obtain DTM using LIDAR processing approach in photogrammetric processes, especially when meet heavy forestry area, high dense urban area, and water area, need more manual intervention. Image matching algorithm from most commercial programs typically result point cloud that exhibits more and larger errors than those observed in raw laser data in those area, thus requiring more manual editing. After the development of sensor and sophisticated processing algorithms by now, the only difference to LIDAR with respect to automation will be the more extensive manual editing for matching and reduction of the DSM to a DTM. Besides that, this manual editing could be reduced by the fact that stereo images can be directly used for manual interpretation and 3D editing by developed editing tools in some digital photogrammetric stations or point cloud processing station like DTMaster, TerraScan, or even manual stereoplotting in Summit Evolution.
Second, point clouds from LIDAR are more powerful to penetrate canopy since it only need line of sight between sensor and ground. So, LIDAR pulse could hit the ground through gaps between canopies. In the other hand, point clouds from image matching are computed from stereo pair imagery, which is typically acquired under strict mission constraints, i.e., sun angle, cloud cover, GSD, etc. (Baltsavias, 1999). It could not to penetrate canopy, so it is hard to find the ground in forestry area. It will leave a huge „no data‟ hole below forestry area after filtering surface point to ground point.
Third, LIDAR could not use in water area so the point cloud LIDAR make less error in water area. While image matching will create point cloud in whole area, even in the water area that will make more error because it is hard to matching point in the water surface.
Forth, LIDAR point clouds has better vertical accuracy than horizontal, it is typically about 5 cm in vertical and horizontal accuracy about 10-30 cm depending altitude. Image matching point cloud accuracies are driven by the triangulation accuracies of the imagery in photogrammetry process, its typically 0.5 GSD horizontally and 1.5 GSD vertically (Gehrke, S., et al, 2010).
Fifth, the density and distribution of raw measurements, this is a decisive factor of DTM/DSM quality. LIDAR point density typically could be reach 4-20 ppm (altitude dependencies). It is also have top and ground of measured points. It is enough to build high resolution of DTM/DSM with good quality. While, with manual and image matching photogrammetric measurements, it could measure theoretically as dense as possible. However, this does not make sense; even if the terrain were so rough (Baltsavias, 1999). And it is only has top of measured point.
But, besides all the differences above, Gehrke et al (2010) has shown that there are some similarities between LIDAR and image matching. Similar to LIDAR intensities, image matching point clouds can be assigned the base image intensities and even the NRGB color values based on the source imagery. So, they can be plotted as an orthoimage like a LIDAR intensity image.
Some investigation has conducted to build DSM from image matching. The results are comparable to human operator using stereo measurement (Gulch, 1999). Due to the improvement of image matching algorithm, DSM in homogenous density or poorly textured areas are able to obtained (Heuchel, T., et al, 2011).
1.4 Study Area, Data Description and Software
1.4.1 Study Area: Area study for this research is Bogor City. The city is situated in the western part of Java Island, about 53 km south of the capital Jakarta and 85 km northwest of Bandung, the administrative center of West Java Province. Bogor spreads over a basin near Salak Volcanoes in south, and Mount Gede in south-east of the city. The average elevation is about 265 meters, maximum elevation 330 m, and minimum elevation 190 meters above sea level. The terrain is rather uneven: 17.64 km² of its area has slopes of 0 to 2°, 80.9 km² from 2° to 15°, 11 km² between 15° and 25°, 7.65 km² from 25° to 40° and 1.20 km² over 40°; the northern part is relatively flat and the southern part is more hilly. Several rivers flow through the city toward the Java Sea. The largest ones, Ciliwung and Cisadane, flank the historic city center. There are The International Archives of the Photogrammetry, Remote Sensing and Spatial Information Sciences, Volume XLI-B3, 2016
several small lakes within the city, including Situ Burung and Situ Gede, with the area of several hectares each. Rivers and lakes occupy 2.89% of the city area(Wikipedia Online, 2016).
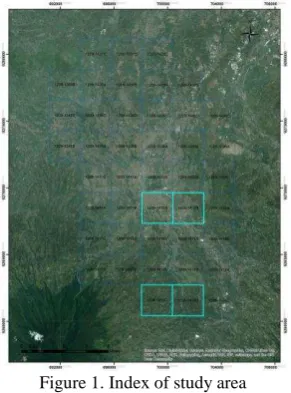
1.4.2 Data Description: This both data (LIDAR data and aerial photo is taken from Digital Aerial Photo and LIDAR Data Acquisition for 1:5000 Map Scale Project on 2014, for Bogor and Depok City Area, West Java, by Geospatial Information Agency, Indonesia. It consist 43 NLP (map sheet) of aerial photo with GSD 15 cm and LIDAR data with density 4 point per meter. Aerial photo is taken using medium format digital camera (60 mega pixel). Both data is taken in the same time for reduce temporal difference error. But, for this research we just select about 4 map sheet with different condition including urban area with flat terrain and forest area with mountainous terrain for this performance comparison. 1 map sheet is equal to 5.3km2.
Figure 1. Index of study area
1.4.3 Software: Several software using manual, semi-automatic and semi-automatic methods have been developed in order to generate 3D city reconstruction. The data used in them can be DSMs, especially from LIDAR, but also from photogrammetric image matching, in combination with other sources such as orthophotos, images and cadastral footprints. Most commercial software used for build DTM/ DSM from point clouds are TerraScan, Match-T DSM with DTMaster, etc. Only a brief description of each software a given below. An extended description of them can be found in their user manuals.
TerraScan is the main application in the TerraSolid Software family for managing and processing LIDAR point clouds that offers tools for handling the large amount of points of a LIDAR data and classification routines that enable the automatic filtering of the point cloud. TerraScan is also possible refine automatic classification result by using half-automatic and manual classification tools in combination with versatile 3D point cloud visualization options (TerraSolid, 2012).
Match-AT is a high performance digital aerial triangulation software for find automatic orientation from digital frame aerial image (Trimble Inpho, 2013a) and Match-T DSM is an automated terrain and surface extraction environment that generates DTM and/or DSM from aerial image using Feature Base Matching and Least Square Matching method (Trimble Inpho, 2013b). Both of software is a part of INPHO modular system.
2 COMPARISON OF SEMI AUTOMATIC DTM FROM
IMAGE MATCHING WITH DTM FROM LIDAR
2.1 Methods
This paper will compare between DTM generated form LIDAR, image matching DTM-automatic (using Robust Filter Method), image matching DSM to DTM by automatic classification, image matching DSM to DTM-semi automatic with manual measured DTM from 3D stereoplotting.
As known, DTM and DSM can be manual measured using 3D stereoplotting to get elevation value from digital aerial photo for produce DTM. DTM from stereomodel is generated from mass points and breaklines. Mass points are produced every 2 – 20 meter (depend on the terrain) by human operator. This data used for elevation benchmark of comparison.
For generates DTM from DSM LIDAR, with respect to these criteria, we should distinguish between closed surfaces like building roofs and a tree canopy with openings surfaces. LIDAR offers certain advantages, because a certain penetration of the canopy can be achieved and surface discontinuities are better modelled in LIDAR data since measurements are in practice denser and/ or more accurate than other method. This better modelling allows the use of geometric criteria for the detection of regular surfaces and irregular surface to distinguish between closed surfaces and open surfaces (Baltsavias, 1999). Another advantage of LIDAR is faster data processing. LIDAR processing speed is in the order of 1,000,000 points/s (Gehrke, S., et al., 2010). Point cloud processing software, e.g., TerraScan could be used for generate DSM to DTM that offer the possibility to filter out non-DTM 3D objects like buildings and trees based solely on geometrical criteria in the DSM that have a certain area and height or slope. There are many algorithms for DTM filtering from LIDAR data. Axelsson (2000) introduce method for DEM generation based on Triangular Irregular Network (TIN). This method starts with created sparse TIN from seed points. An iterative process then performed. TerraSolid software is implemented this algorithm. Ground routine from TerraSolid software classifies ground points by creating a triangulated surface model iteratively (TerraSolid, 2015). The routine build TIN (surface model) from initial ground points and then add more points to build ground model. Finally, this automatic process completely classify ground points into a class from others class. Then the elevation of DTM LIDAR compared to DTM manual using pixel to pixel signed subtraction. This result is used for calculate the vertical accuracy of DTM.
Beside manual measurement, we could generate DTM automatically from digital aerial image. We could also using image matching methods on digital images to measure a DTM and/or DSM. Some commercial photogrammetric software offer automatic orientation and DTM/ DSM generator with matching programs, e.g., Match-AT and Match-T DSM. We could just do automatic DTM generation using robust filter method from measured point (DSM). Or in this case, LIDAR data processing software and similar algorithms can be used to image matching DSM results, i.e., detection of DTM in the DSM and deletion based on geometric criteria. However point clouds produced by image matching has slower processing speed than LIDAR point clouds, it is approximately 10,000-20,000 points/s (Gehrke, S., et al., 2010).
TerraSolid software is very famous for DEM filtering using LIDAR point clouds. Since image matching also result point clouds, it is possible to perform points classification using the same technique. Narendran et al (2014) investigate semi-automatic DTM using DSM from image matching for Large Format Digital Camera Ultracam-D. According to this research, geometry accuracy result was very good with LE90 < 25 cm.
However, the process of non-DTM object detection is very difficult to automate fully. Theoretically, it will be work well if the filtered objects are the minority within the filtering window. So, this procedure works well only in relatively flat terrain area, an urban area that is not too crowded with isolated buildings and trees. But in rough topography, terrain features like tips of hills, and mostly in heavy forestry area or narrow streets in high dense urban area that the ground points are the minority, especially on DSM data that generated from image matching results, are often also eliminated when applied a filtering procedure. It will always leave a huge „no data‟ hole in those areas. For improving the result of DTM, the breaklines that indicating the presence of such objects, could be used in addition to the geometry in order to lead to a more complete and accurate elimination of non-DTM objects (Baltsavias, 1999).
Then, the elevation value (pixel value-using 32 bit USGS DEM elevation grid format) of DTM that generated from each method compared as same as DTM LIDAR using pixel to pixel signed subtraction. This comparison is using 2 meter grid cell size. The compared result of vertical accuracy each DTM will described in chapter 2.2 about vertical difference accuracy.
2.2 Vertical Accuracy Difference
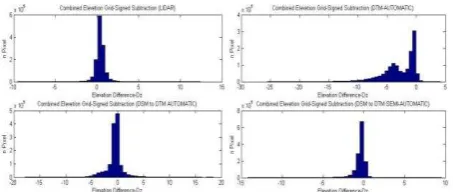
According to this research, DTM is able to produce manually, fully automated, or semi-automated. This research produced improved semi-automatic photogrammetry DTM which is quite similar with manual stereoplotting DTM with RMSz 0.889-1.504 m in surface difference value to manual stereoplotting DTM as reference DTM, while LIDAR DTM has RMSz 0.811-3.203 m. this condition show that semi-automatic DTM is quite similar to LIDAR DTM performance, except for forestry area with mountainous terrain. automatic and DSM to DTM-automatic have not satisfactory result with RMSz 4.219-7.014 m and 1.777-3.719 m. It is because filtering DSM result is not optimal yet. For complete understanding, see histogram comparison of each method on Figure (2), (3), (4), and (5). Then, the Appendix B will show the comparison of vertical accuracy of each method.
Referred to Large Scale Topographic Map Specification in Indonesia, it was stated that 1:5.000 required 1 m accuracy for Class 1, 1.5 m accuracy for Class 2, and 2.5 m accuracy for Class 3. It was assumed that manual method is the benchmark for the geometry accuracy, only LIDAR and DSM to DTM semi-automatic methods are meet the accuracy for 1:5.000. However, this process could not be executed without one condition which is the information of elevation values accuracy on reference DTM to ground control point should be known beforehand.
Statistically, this research proved that semi-automatic photogrammetry DTM could be used for alternative of DTM production for 1:5000 map scales without considering to production time and cost. However, this method could not exceed superiority of DTM LIDAR, especially in production
time and cost. Discussion about production time and cost each method will describe in chapter 2.4 and 2.5.
Figure 2. Histogram comparison of each method on map sheet 1209-1415C
Figure 3. Histogram comparison of each method on map sheet 1209-1415D
Figure 4. Histogram comparison of each method on map sheet 1209-1432C
Figure 5. Histogram comparison of each method on map sheet 1209-1432D
2.3 Geomorphological Quality
The geomorphologic quality of the derived DTM is affected by many factors depending on the source of data. The density and distribution of raw measurements is a decisive factor of DTM/DSM quality. But, although the accuracy and the density of the raw each data is high, the geomorphologic quality of the derived DTM is not always satisfactory. For example, DTMs from LIDAR tend to be smooth and miss some important terrain features when applied unsuitable parameter in filtering algorithm (Kraus and Pfeifer, 1998). It is because filtering method to reduce errors in raw data is hard to find and not The International Archives of the Photogrammetry, Remote Sensing and Spatial Information Sciences, Volume XLI-B3, 2016
always satisfactory in various area, every difference area has unique parameter to be applied in a filtering algorithm. Besides, it is because apart from the lack of explicit modeling of characteristic lines and points of object (Baltsavias, 1999). Manual editing will always be necessary. The breaklines that indicating the presence of such objects could be used in addition to the geometry in order to lead to a more complete and accurate elimination of non-DTM objects.This condition is also happened in image matching DTM and/ or DSM data. A
huge “no data” hole below forestry area and large building after
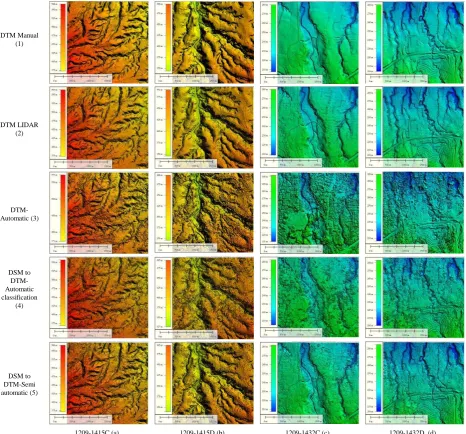
filtering surface point to ground point should be replaced by manual point or synthetic point. It could be better if we add breaklines that indicating the presence of such objects in order to lead to a more complete data. However, manual photogrammetric measurements are still the best method for high geomorphologic DTM quality (Baltsavias, 1999). This figure below will show the geomorphological quality of each method from forestry area with mountainous terrain and urban area with flat terrain.
DTM Manual (1)
DTM LIDAR (2)
DTM-Automatic (3)
DSM to DTM-Automatic classification
(4)
DSM to DTM-Semi automatic (5)
1209-1415C (a) 1209-1415D (b) 1209-1432C (c) 1209-1432D (d)
Figure 6. Geomorphological quality comparison of each method from forestry area with mountainous terrain (a) (b), and urban area with flat terrain (c) (d)
Manual stereoplotting data have top and ground measured point with irregular grid point, it is about 2-20 m interval point. So that DTM manual stereoplotting have smooth terrain, and detail of terrain is depending on breaklines to improve geomorphological quality (see on Figure 6(1)), but have good vertical accuracy. LIDAR data have top and ground measured point with dense point, it is about 0.5-1 m interval point. Of course DTM LIDAR has detail of terrain and good vertical accuracy (see on Figure 6(2)). Automatic DTM from image matching just have top measured point with dense point, it is
depending on GSD of photo. Robust filtering method often left some non-DTM object point because lack of information in image matching generated DSM (only top measured point, poor texture, etc.); see the automatic DTM result on Figure 6(3). Although some filtering method successfully clearing non-DTM
object point, it will leave a „no data‟ hole-no point measured exist in some area, especially in heavy forestry area or crowded urban area undulation area. It is the most problem in automatic DTM generation from image matching. So that the DTM result still roughly and often left some noise/non-DTM object point, The International Archives of the Photogrammetry, Remote Sensing and Spatial Information Sciences, Volume XLI-B3, 2016
see DSM to DTM automatic result on Figure 6(4). But this result could be improved with additional breaklines and manual measured point to improve the detail of terrain and geomorphological quality. Semi-automatic DTM result show
that this method could reduce almost the „hole‟ and miss -classification problem (see on Figure 6(5)). However, this method is depending on degree of manual intervention.
2.4 Production Time Difference
There is no doubt that with direct range measurement from LIDAR data acquisition, a DTM can be generated more rapidly than with photogrammetry. Then as an alternative purpose, how fast the DTM production from semi-automatic image matching. Based our independent calculation, DTM production time from semi-automatic image matching could reduce 40-60% from manual DTM production time. It is about 18-29 hour per map sheet while manual DTM production can reach 30-52.5 hour per map sheet. However this method still could not exceed LIDAR production time yet which only need about 1 hour per map sheet. This production time calculation is exclude data acquisition time. However, the production time of this method still could be improved if we could reduce the number of manual point‟s measurement or degree of manual intervention, which is the best interval size of manual point measured. In order to find the right parameter values for generating DTM accurately. For complete comparison, the table on Appendix C will show the comparison of production time of each method.
2.5 Cost Difference
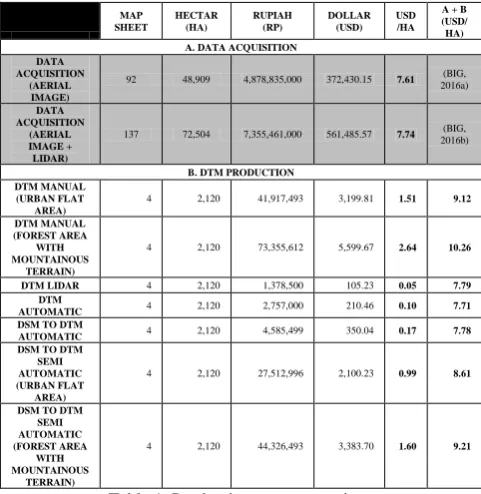
As known that manual DTM production from photogrammetric and DTM production from LIDAR has established, the costs and production time of each methods are very well known now. Although each service provider has different means of calculating the costs, and there is competition among the service providers. These vary a lot depending on the firm, size of the area and point density, type of post processing, and extra costs for mobilization, platform, etc. industries, manual DTM production from photogrammetric prices ranges are 9.12-10.26 $/ha, while the automatic DTM production from LIDAR prices ranges are 7.79 $/ha. With this cost benchmark, we could calculate estimation cost of each method. Although this is not exact prices, nor a thorough cost comparison, this table comparison could be show the percentage of reduction cost of this alternative method compared to each method. Data acquisition cost calculation in this research is based on Digital Aerial Photo and LIDAR Data Acquisition for Maps Scale 1:5000 Project on 2016 (BIG, 2016a and 2016b).
So, based on table calculation above (see Table 1), DTM production cost from semi-automatic image matching could reduce 40-60% from manual DTM production cost exclude data acquisition cost. It is about 0.99-1.60 $/ha or 8.61-9.21 $/ha included data acquisition, while manual DTM production can reach 1.51-2.64 $/ha or 9.12-10.26 $/ha included data acquisition. But again, this method still could not beat the superiority of LIDAR which only need about 0.05 $/ha in DTM production or 7.79 $/ha included data acquisition. For complete comparison, the table on Appendix C will show the comparison of DTM production cost of each method.
3 CONCLUSION AND OUTLOOK
LIDAR and photogrammetry have different principles in generating DTM and the DTM difference result is significant. This difference is proved by surface elevation comparison using pixel by pixel signed subtraction and the statistical test. The difference is mainly due to the characteristic of surface measured and the number point each method. LIDAR data have top and ground measured point with dense point. DTM LIDAR has detail of terrain and good vertical accuracy. Manual geomorphological quality. Automatic DTM from image matching just have top measured point with dense point. The best filtering method that suitable with various area and terrain type is still the main problem of this research. And also, although the filtering method successfully clearing non-DTM
object point, it will leave a „no data‟ hole-no point measured exist in some area, especially in heavy forestry area or crowded urban area undulation area. But this result could be improved with additional breaklines and manual measured point to improve the detail of terrain and geomorphological quality.
According to this research, DTM is able to produce semi-automated from image matching. The main key to obtain best result using method in this research is how to generate good DSM without many error points that appear as consequences for image matching method. This research produced improved semi-automatic photogrammetry DTM which is quite similar with LIDAR and manual stereoplotting DTM with RMSz 0.889-1.504 m in surface difference value to manual stereoplotting DTM as reference DTM. Statistically, this research proved that semi-automatic photogrammetry DTM could be used for alternative of DTM production for 1:5000 map scales without considering to production time and cost. The International Archives of the Photogrammetry, Remote Sensing and Spatial Information Sciences, Volume XLI-B3, 2016
Referred to Large Scale Topographic Map Specification in Indonesia, it was stated that 1:5.000 required 1 m accuracy for Class 1, 1.5 m accuracy for Class 2, and 2.5 m accuracy for Class 3. It was assumed that manual method is the benchmark for the geometry accuracy. Since the geometry is the important constraint in 1:5.000 topographic map productions, only LIDAR and DSM to DTM semi-automatic methods are meet the accuracy for 1:5.000. As a note, LIDAR accuracy for forest area (4 – 5 m) is not actually weak geometry, mainly it was the different ground interpretation between human operator and LIDAR point cloud in dense vegetation in forest area. However, LIDAR still offer huge advantages for time and cost aspect for DTM production. From the Appendix A, B, and C, it clearly showed that LIDAR is very superior compared to both manual and semi-automatic method.
From this research, it can be conclude that there were many aspects that introduce difficulties to produce DTM using semi-automatic image matching method. The main aspect was much error point from DSM image matching especially in homogeneous area, not only in mountainous terrain but also in flat terrain. DSM image matching in such area tends to be lower than actual value and become depression points. This aspect is able to correct manually but it was very time consuming. TerraScan software offer correction using low point routine and it worked for almost error points. However, it needs to verify manually for entire are for the best result.
Other difficulty is water. LIDAR offer great advantage than image matching method. LIDAR provide no data for water area, while image matching generates point with huge blunder value. Human operator is needed to identify the water area and removed points manually.
Another aspect is building in a very dense urban area. Since Indonesia has not very good urban planning, many urban areas are very complex containing irregular permanent or semi-permanent building. There is no space between buildings. If image matching produces not very clear shape DSM, it was usually error in point‟s classification in DSM to DTM filtering. Top roof of building in this area would assume as ground points due to misclassification filtering. Human operator is needed to identify this error and correct manually.
Following this research, it will be interesting to see the effect of a number of manual measured points or density to the accuracy of measurement, which is the best interval size of manual point measured. Another recommendation is to compare various filtering algorithm in different locations of Bogor such as urban, forest, etc. This could explore which filtering algorithm is suitable for particular areas of Bogor (urban, forest, etc.) to reduce manual editing intervention.
The result of this research could give a good contribution to DTM comparison study between Photogrammetry and LIDAR which has not much conducted yet, especially in the case study of urban area in developing countries.
ACKNOWLEDGEMENTS
The authors extend sincere thanks to Dr. Ade Komara Mulyana, Head of Large Scale Mapping Division, Centre of Topographic Mapping and Toponyms, Geospatial Information Agency of Indonesia (BIG), for his constant support and encouragement in carrying out this study. The authors thanks too to all of large scale mapping division staff for their support during the course of this work.
REFERENCES
Axelsson, P., 2000. DEM generation from laser scanner data using adaptive TIN models. In: The International Archives of the Photogrammetry and Remote Sensing, 33 (B4/1), pp. 110– 117.
Baltsavias, E.P., 1999. A comparison between photogrammetry and laser scanning. ISPRS Journal of Photogrammetry & Remote Sensing, 54, 1999. 83–9.
BIG. 2016a. KAK dan HPS Kegiatan Pemotretan Udara Digital Kota Banda Aceh, Sabang, Meulaboh dan Sekitarnya Tahun Anggaran 2016. Pusat Pemetaan Rupabumi Dan Toponim. Badan Informasi Geospasial. Bogor, Indonesia.
BIG. 2016b. KAK dan HPS Kegiatan Akuisisi LIDAR dan Pemotretan Udara Digital KEK Sei Mangke dan Sekitarnya Tahun Anggaran 2016. Pusat Pemetaan Rupabumi Dan Toponim. Badan Informasi Geospasial. Bogor, Indonesia.
Gehrke, S., et al. 2010. Semi-Global Matching: An Alternative to LIDAR for DSM Generation. ISPRS Archives of the Photogrammetry and Remote Sensing, Calgary, Alberta, Canada, Volume XXXVIII, Part 1.
Gulch, E. 2009. Advanced Matching Techniques for High Precision Surface and Terrain Models. Photogrammetric Week 2009, pp 303 – 313.
Heuchel, T., et al. 2011. Towards a Next Level of Quality DSM/DTM Extraction with MATCH-T. Photogrammetric Week 2011, pp 197 – 202.
Kraus, K., Pfeifer, N., 1998. Determination of terrain models in wooded areas with airborne laser scanner data. ISPRS J. Photogramm. Remote Sensing, 53 (4), 193–203.
Narendran, J., et al. 2014. Quality Metrics of Semi-Automatic DTM from Large Format Digital Camera. The International Archives of the Photogrammetry, Remote Sensing and Spatial Information Sciences, Volume XL-8.
TerraSolid. (2012). TerraScan – Software for LiDAR Data Processing and 3D Vector Data Creation. http://www.terrasolid.com/products/terrascanpage.php (March 28th, 2016).
TerraSolid. 2015. TerraScan User’s Guide.
Trimble Inpho. (2013a). Geo-referencing Module.
http://www.trimble.com/imaging/inpho.aspx?tab=Geo-_Referencing_Module (March 28th, 2016).
Trimble Inpho. (2013b). Geo-capturing Module.
http://www.trimble.com/imaging/inpho.aspx?tab=Geo-Capturing_Module (March 28th, 2016).
Trinder, John. 2014. Lecture Notes GMAT9300: Aerial and Satellite Imaging Systems. The University of New South Wales, School Of Surveying and Geospatia l Engineering. Chapter 4: 87-94.
Wikipedia Online. (2016). Geography, topography, and geology of Bogor.
https://en.wikipedia.org/wiki/Bogor#Geography.2C_topography .2C_geology (March 28th, 2016).
APPENDIX
A. Data Comparison
MAP SHEET 1209-1432C 1209-1432D 1209-1415C 1209-1415D
TERRAIN TYPE Urban area with
flat terrain
Urban area with flat terrain
Forest area with mountainous terrain
Forest area with mountainous terrain
MANUAL 54,212 162,894 98,149 107,596
LIDAR
Unclassified 49,911,066 48,937,807 83,051,134 76,745,594
Classified 4,427,639 5,805,561 3,071,594 3,033,342
Manual Point - - - -
DTM-AUTOMATIC
Unclassified 12,586,726 13,212,616 18,018,688 17,066,109
Classified - - - -
Manual Point - - - -
DSM TO DTM AUTOMATIC
Unclassified 29,557,306 29,560,442 29,555,481 29,556,046
Classified 4,038,033 6,505,761 6,685,459 5,732,550
Manual Point - - - -
DSM TO DTM-SEMI AUTOMATIC
Unclassified 29,557,306 29,560,442 29,555,481 29,556,046
Classified 3,904,025 6,208,774 6,434,934 5,581,293
Manual Point 30,910 70,547 37,030 50,903
Manual Intervention
Percentage
57.02 43.31 37.73 47.31
B. Accuracy Report - Delta Z to Benchmark –Manual Measurement
MAP SHEET 1209-1432C 1209-1432D 1209-1415C 1209-1415D
TERRAIN TYPE Urban area with
flat terrain
Urban area with flat terrain
Forest area with mountainous terrain
Forest area with mountainous terrain
LIDAR
Max DZ 17.347 12.403 11.62 28.884
Min DZ -14.056 -9.587 -52.366 -92.243
Mean -0.098 0.408 -0.818 -0.431
RMS DZ 0.989 0.811 3.203 2.797
Accuracy LE90 1.632 1.339 5.285 4.615
DTM-AUTOMATIC
Max DZ 4.945 4.112 45.444 73.873
Min DZ -41.443 -25.534 -30.978 -40.554
Mean -4.457 -2.991 -3.594 -4.13
RMS DZ 7.014 4.219 5.721 6.652
Accuracy LE90 11.573 6.961 9.44 10.975
DSM TO DTM AUTOMATIC
Max DZ 25.02 18.462 54.108 85.428
Min DZ -14.938 -17.878 -27.776 -28.75
Mean 0.461 -0.52 -0.166 0.28
RMS DZ 2.442 1.777 3.422 3.719
Accuracy LE90 4.029 2.931 5.647 6.137
DSM TO DTM-SEMI AUTOMATIC
Max DZ 11.966 9.505 48.277 87.602
Min DZ -15.022 -14.255 -22.231 -29.111
Mean -0.134 -0.421 -0.433 -0.331
RMS DZ 0.889 0.861 1.32 1.504
Accuracy LE90 1.467 1.42 2.178 2.482
C. Time and Cost Comparison
MAP SHEET 1209-1432C 1209-1432D 1209-1415C 1209-1415D
TERRAIN TYPE Urban area with
flat terrain
Urban area with flat terrain
Forest area with mountainous terrain
Forest area with mountainous terrain
MANUAL
Total Time (h) 30 30 52.5 52.5
Pts/h 1,807 5,430 1,870 2,049
DTM Cost ($/ha) 1.52 1.52 2.64 2.64
LIDAR
Total Time (h) 1 1 1 1
Pts/h 2,500,000,000-3,500,000,000 (depending on terrain type)
DTM Cost ($/ha) 0.05 0.05 0.05 0.05
DTM-AUTOMATIC
Total Time (h) 2 2 2 2
Pts/h 6,293,363 6,606,308 9,009,344 8,533,055
DTM Cost ($/ha) 0.1 0.1 0.1 0.1
DSM TO DTM AUTOMATIC
Total Time (h) 3 3 3 3
Pts/h 1,346,011 2,168,587 2,228,486 1,910,850
DTM Cost ($/ha) 0.17 0.17 0.17 0.17
DSM TO DTM-SEMI AUTOMATIC
Total Time (h) 18 18 29 29
Pts/h 218,608 348,851 223,171 194,214
DTM Cost ($/ha) 0.99 0.99 1.6 1.6