AN APPROACH TO AUTOMATIC DETECTION AND HAZARD RISK ASSESSMENT OF
LARGE PROTRUDING ROCKS IN DENSELY FORESTED HILLY REGION
S. Chhatkuli a, *, K. Kawamura a, K. Manno a, T. Satoh a , K. Tachibana a
a
PASCO CORPORATION, 2-8-10 Higashiyama, Meguro-Ku, Tokyo, Japan - (cshahb7460, kaeriu5602, koonua2121, tuoost7017, kainka9209)@pasco.co.jp
Commission III, WG III/2
KEY WORDS: LiDAR, Hazard, Rock-fall, Curvature analysis, Simulation
ABSTRACT:
Rock-fall along highways or railways presents one of the major threats to transportation and human safety. So far, the only feasible way to detect the locations of such protruding rocks located in the densely forested hilly region is by physically visiting the site and assessing the situation. Highways or railways are stretched to hundreds of kilometres; hence, this traditional approach of determining rock-fall risk zones is not practical to assess the safety throughout the highways or railways. In this research, we have utilized a state-of-the-art airborne LiDAR technology and derived a workflow to automatically detect protruding rocks in densely forested hilly regions and analysed the level of hazard risks they pose. Moreover, we also performed a 3D dynamic simulation of rock-fall to envisage the event. We validated that our proposed technique could automatically detect most of the large protruding rocks in the densely forested hilly region. Automatic extraction of protruding rocks and proper risk zoning could be used to identify the most crucial place that needs the proper protection measures. Hence, the proposed technique would provide an invaluable support for the management and planning of highways and railways safety, especially in the forested hilly region.
* Corresponding author
1. INTRODUCTION
Rock-fall along highways and railways presents one of the major threats to transportation and human safety. Especially for a mountainous country like Japan, locating protruding rocks to discriminate rock-fall hazard prone areas poses a significant challenge as the protruding rocks are generally hidden under a dense forest. So far, the most feasible way to detect the locations of protruding rocks is by physically visiting the site and assessing the situation. However, with this traditional approach, the field inspectors or surveyors are exposed to an unforeseen risk of rock-fall hazard as there are no prior information about the possible presence of the protruding rocks on that that area. Furthermore, highways or railways are stretched to hundreds of kilometres; therefore, this approach is not feasible to thoroughly assess the safety throughout the highways or railways. Hence, a technology that can minimize this painstaking manual labour in determining rock-fall risk prone zones has already been felt necessary.
Michoud et.al., (2012) presented a detailed slope angle analysis to detect potential rock-fall sources areas. Nicolas et.al., (2012) assessed the risk of rock-fall hazard by basically analysing the slope, surface roughness, forest parameter and performing 3D modelling to map hazard zone. However, in the above approaches LiDAR data were fundamentally used to create a DTM and hazard zone was mapped mainly based on evaluating the slope without determining the presence or absence of rocks on the terrain.
There have been some prior studies regarding the detection of rock-fall events and risk assessment based on the evaluation of laser scanner data acquired during different time epochs, especially for rocky outcrops. Alba and Scaioni (2010) presented a pipeline to extract changes and deformation detection between two or more digital surfaces of the same rock face surveyed at different observation epochs using a TLS. Toniani and Abellan (2014) analysed a series of terrestrial LiDAR point clouds acquired over a cliff to detect and extract individual rock fall events that occurred during a time span of six months. In those approaches, rock-fall events were evaluated based on volumetric changes of the scanned area. Hence, those approaches cannot be used to detect the protruding rocks in forested hilly region before rock-fall events have occurred.
One of the main challenges in detecting protruding rocks hidden under dense forest is the lack of data that could penetrate forest canopies and acquire the information about the features underneath. However, there have been continuous developments in LiDAR technologies. Full wave form (FWF) digitizer is also commercially available which can be utilized to detect ground position or features under tree canopies which is otherwise not detected just by discrete pulse LiDAR system (Chhatkuli et al., 2012). Hence, in this research we have utilized a state-of-the-art airborne LiDAR technology and derived a workflow to automatically detect protruding rocks and their location in densely forested hilly regions and analysed the level of hazard risk that they pose. Moreover, we
have also proposed a 3D simulation technique that actually uses the topography and physical parameters to perform the dynamic simulation of rock-fall events.
2. METHODOLOGY
The workflow formulated to analyse the LiDAR data to detect protruding rocks located under the densely forested hilly region and a methodology of 3D simulation of the rock-fall event is explained below.
2.1 LiDAR data acquisition and pre-processing
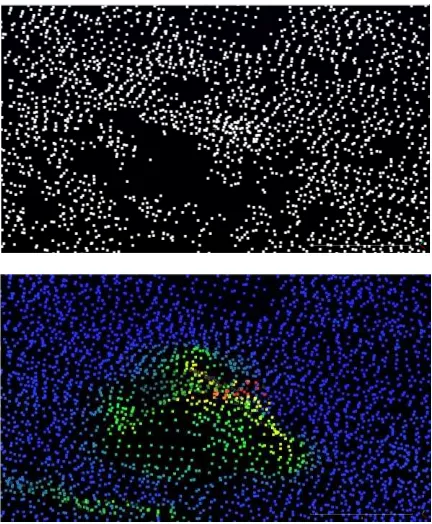
FWF LiDAR data was acquired at two different study areas (region A and region B) in Japan. The FWF data was processed to create a point cloud data. The resulting processed point cloud data was of a high point density (>30 pts. / Sq.m). At first, the point cloud data was automatically filtered to create a terrain data by utilizing commercially available software called “Terrasolid”. Our experience shows that the automatic filtering performed by the commercial software generally tends to, fully or partially, remove the protruding rocks in the point cloud data (Figure 1 (top)). Hence, in addition to the terrain data set, all the point cloud data within 2 m of the terrain was also extracted from the data set. Thus extracted buffered terrain data set would include point cloud representing protruding rocks filtered out by the commercial software. However, the buffered terrain data would also include noise like vegetation and other features along with rocks. The steps below explain the procedure to filter out the noise and to detect the protruding rocks from the buffered terrain data.
2.2 Noise removal and data reconstruction
To remove the sparsely populated noise from the buffered terrain data set, at first, statistical outlier removal technique based on evaluating the standard deviation of the nearest neighbour from the mean distance was used. After the statistical noise removal, further noise removal and surface reconstruction was performed by utilizing Moving Least Square (MLS) technique. MLS technique constructs continuous function from a set of unorganized point cloud data (Alexa et.al., 2003). While statistical outlier removal reduces outliers, it also tends to remove sparsely populated point cloud. Hence after the data surface reconstruction was complete, the original terrain data (Figure 1 (top)) was concatenated with the reconstructed data to add back the sparsely populated point cloud that were wrongly removed during noise removal process. Once again, surface reconstruction based on the concatenated data set was performed by utilizing MLS technique.
2.3 Rock detection
From the reconstructed data set, protruding rocks were detected by performing the curvature analysis of the point cloud data. For the curvature analysis, at first, a 3D spherical buffer was assigned and the normal vector of point cloud was evaluated by performing Principal Component Analysis (PCA). PCA was then performed again on the normal approximations of points in a local neighbourhood. The directions of curvature and radius of curvature was then approximated by evaluating the rate of change in normal direction which defines the variation of the surface normal (Belton., 2008).
After the curvature analysis, the point cloud was then clustered in 4 different classes as per the curvature index utilizing Jenks clustering technique. For the pilot study area, the data set clusters that belong to the upper two classes i.e. with higher local curvature were regarded as the protruding rocks (Figure 1 (bottom)).
2.4 Hazard risk assessment
The detected rocks positions were overlaid on a slope map created from the terrain data. Since our study areas were small localized areas; terrain geology, presence of vegetation, rainfall events, seismicity and previous rock fall history did not vary that much within the test area. Hence, based on the empirical studies (Saroglou. et.al., 2012), we just adopted terrain slope to categorize the rock-fall risk hazard posed by the detected rocks. Rocks located on a terrain with slope greater than 25 degrees and less than or equal to 40 degree were categorized as the ones with a very low risk of falling. Likewise, rocks located on terrain with slope greater than 40 degrees and less than or equal to 50 degrees, terrain with slope greater than 50 degrees and less than or equal to 60 degrees and terrain with slope greater than 60 degree were categorized as the one with low, medium, and high risks of falling respectively.
2.5 3D rock-fall simulation
To envisage a rock-fall scenario and to determine the trajectory and the velocity of the rock-fall, we conducted a 3D simulation of a rock-fall event based on the fusion of Moving particle semi implicit method (MPS) and Distinct Element Method (DEM). In MPS, solid material is represented as a collection of finite number of particles. The particles behave as if they are connected by normal and shear springs which are governed by
Figure 1. Terrain data derived by utilizing Terrasolid (top) and newly reconstructed terrain data with protruding rock
extracted by the proposed algorithm (bottom)
the parallel and perpendicular displacement of particles (Chhatkuli et. al., 2009). In this study, an airborne LiDAR data that belonged to a terrain and protruding rocks represented the finite numbers of particles.
During the simulation, a rock-fall event was initiated by the application of an external force. Once the rock-fall was initiated, gravitational force and the interactive force between different objects (e.g. Terrain and rocks) were the only forces that came into effect. The interactive force is modelled by using DEM (Furukawa et.al., 2009) in which the physical parameters of the materials namely the Young’s modulus of elasticity and the Poisson’s ratio governed the interactive forces.
3. RESULTS AND DISCUSSION
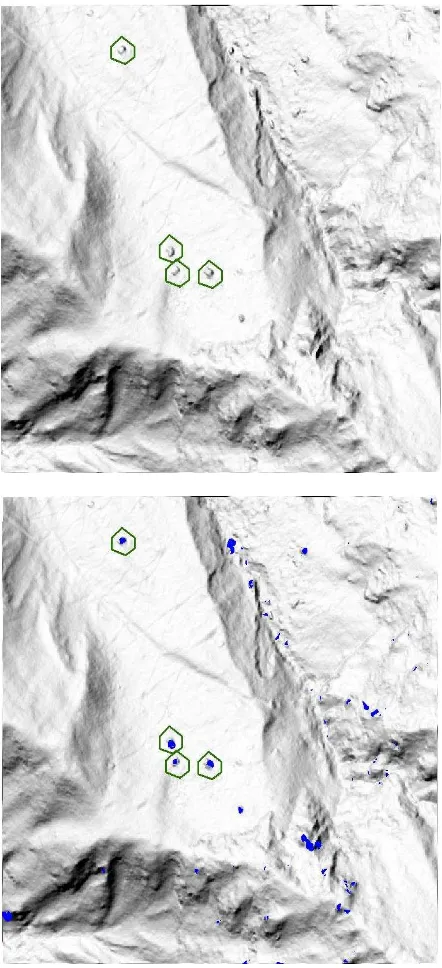
Figure 2 (top) shows the hill shade model of one of the study area, region A. The green polygons on the figure are the location of the protruding rocks confirmed from the site verification. The size of each protruding rocks were over 2m wide.
The airborne LiDAR data was processed, as explained in section 2, and the point cloud that represented the protruding rocks were converted into raster and overlaid on the hill shade model. The blue patches on the Figure 2 (bottom) are the locations of the protruding rocks detected by our proposed technique. The result showed all the four isolated protruding rocks were detected by our proposed technique. Figure 3 shows the detected protruding rocks overlaid on terrain data classified into 4 risk zones as per the criteria explained in earlier section. From the rock-fall risk analysis based on the slope, we could ascertain that the protruding rocks detected by the proposed algorithm and also confirmed by the field verification possessed very low to low risk of rock-fall hazard as they were located on the terrain with slope less than 50 degrees.
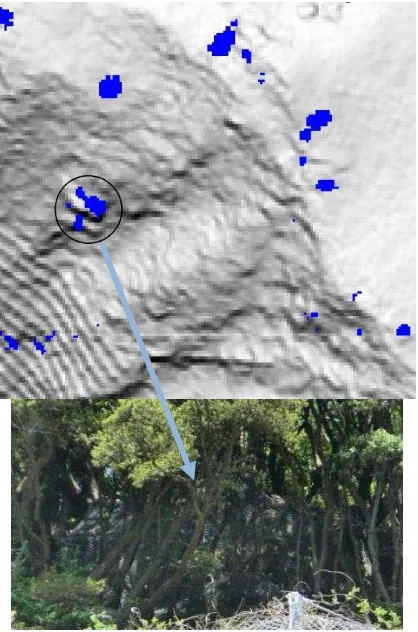
Likewise, in the Figure 4 (top) the blue patches indicate the protuding rock position detected by our algorithm for region B. As seen in Figure 4 (bottom) the encircled blue patch is confimred by our field visit to be a rock of about 5 m width hidden under tree canopies. The slope of the terrain where the protruding rock was detected was below 50 degrees. Hence, the risk posed by detected protruding rock was regarded to be very low to low.
Regarding the overall accuracy of the detection results, we could not independently verify whether all the detections were actually protruding rocks or not due to the limitation posed by the inaccessibility of the detected locations to investigate them thoroughly. Nevertheless, from our field survey we noticed that in some cases the localised change in the topography or small shrubs, which were grouped together, were also detected as protruding rocks. The false detection is due to the fact that the current algorithm just looks into the sudden change in local curvature on the terrain to determine whether there are presence of protruding rocks or not.
Figure 5 shows the results of the 3D dynamic simulation of a rock-fall event. The simulation was performed for one of the detected protruding rocks. The total duration of the simulation was 7 seconds. As seen in Figure 5, the simulation results could be used to visualize the rock fall trajectory and the
physical rock-fall event in a very realistic manner. In the Figure 5, the dots (ranging from blue to red colours) represent the simulated rock-fall trajectory and the velocity at every 0.09 second interval. During the 7 seconds events, we could see that the falling rock hit the terrain at 4 different locations. Moreover, during the rock-fall event, the velocity varied considerably from point to point. The velocity ranged from lower than -20 m/s (blue) to higher than +20 m/s (red). Here the negative velocity represents the velocity while falling down and the positive velocity represents the velocity while bouncing back.
Figure 2. Green polygon on the top figure are locations of protruding rocks at region A, confirmed from the site verification, and blue patches on the bottom figure are the
protruding rocks detected by our algorithm
Legend:
Figure 3. Rock-fall hazard risk map with protruded rock locations
simulation @ t = 0
simulation @ t = T/3
simulation @ t = 2T/3
simulation @ t = T
Figure 5. Rock-fall simulation (T = 7 sec)
Figure 4. Blue patches are the protruding rocks, at region B, detected by the proposed algorithm. Detected rock enclosed in the circle was found to be about 5 m wide
confirmed by the field verification (bottom)
4. CONCLUSION AND FUTURE WORK
In this study we have proposed a technique to automatically extract protruding rocks from the forested hilly region and analysed the level of hazard risk they pose. Moreover, we also presented a technique of 3D dynamic simulation of the rock-fall event. Proper risk zoning and automatic extraction of probable protruding rock position could be used to identify the most crucial place that needs the proper protection measures. Hence, this research will provide an invaluable support to the management of highway or railway safety especially in the forested hilly region.
Since this study utilized just an airborne LiDAR data, our test showed that the point cloud density on a very steep slopes and cliffs are not enough to represent the rocks in a meaningful manner. Moreover, in some cases, there were no data at all. Hence in future, the fusion of laser data from other multiple sources like mobile vehicle borne laser systems etc. should be considered to create the data completeness.
Regarding the effect of forest type on the detection of protruding rocks, we found that that it is still challenging even for FWF LiDAR to penetrate the coniferous forest to get the very detailed ground structures under canopies. Hence with the current LiDAR sensors that are commercially available, the proposed method suits the best for deciduous forest provided the laser scanning is done during winter when most of the leaves have fallen down. Moreover, the current algorithm just looks into the sudden change in local curvature on a terrain to determine whether there are presences of protruding rocks or not. Hence in future additional LiDAR derived parameters should also be exploited to reduce the false detection and to further increase the accuracy and reliability of the results.
Moreover, regarding the 3D dynamic simulation of rock-fall event, the fusion of MPS and DEM was exploited for the first time to simulate the rock-fall event. Hence to keep the test simple and to understand the potential of the proposed technique, the simulation did not include the effect of trees or vegetation that were present on the terrain. However, for the practical application of this simulation technique, the effect of trees and vegetation needs to be implemented thoroughly and the results need to be quantitatively validated by real or prototype data set.
ACKNOWLEDGEMENTS
The authors would like to express their gratitude towards the Ministry of Land, Infrastructure and Transport Chubu Regional Development Bureau Tajimi Sabo National Highway Office and the Kinki Regional Development Bureau Kinki technology office for providing the laser data.
REFERENCES
Alba, M., and Scaioni, M., 2010. Automatic detection of changes and deformations in rick faces by terrestrial laser scanning. In: The International Archives of the Photogrammetry, Remote Sensing and Spatial Information Sciences, Newcastle upon Tyne, UK, Vol. XXXVIII, Part V, pp. 11-16.
Alexa, M., Behr, J., Cohen-Or, D., Fleishman, S., Levin. D., and Silvia, C.T., 2003. Computing and rendering point set surface. VCG, IEEE TVCG, 9 (1). pp. 3-15.
Belton, D., 2008. Improving and extending the information on principal component analysis for local neighborhoods in 3D point clouds. In: The International Archives of the Photogrammetry, Remote Sensing and Spatial Information Sciences, Beijing, China, Vol. XXXVII, Part B5, pp. 477-484.
Chhatkuli, S., Mano, K., Kogure, T., Tachibana, K., and Shimamura, H., 2012. Full waveform liDAR and its evaluation in the mixed forest hilly region. In: The International Archives of the Photogrammetry, Remote Sensing and Spatial Information Sciences, Melbourne, Australia, Vol. XXXIX, Part B7, pp. 505-509.
Chhatkuli, S., Kojima, H., Koshizuka, S., and Uesaka, M., 2009. Meshfree simulation of lung deformation during inspiration. In: Proceedings of the world congress on engineering and computer science, San Francisco, USA, Vol II.
Furukawa, A., and Ohta, Y., 2009. Failure process of masonry buildings during earthquake and associated casualty risk evaluation. Nat Hazards, 49, pp.25-51.
Michoud, C., Derron, M. H., Horotn, P., Jaboyedoff, M., Baillifard, F. J., Loye. A., Nicolet, P., Pedrazzini, A., and Queyrel, A., 2012. Rockfall hazard and risk assessments along roads at aregional scale: example in Swiss Alps. Nat.Hazards Earth Syst. Sci, 12, pp. 615-629.
Nicolas, C., Frédéric. B., and Jerome. L., 2012. Rockfall modelling and risk zoning: A case study in the French Alps using geomatics, airborne laser scanning, 2D & 3D runout models. In: 12th Congress INTERPRAEVENT, pp. 479-486.
Saroglou, H., Marinos, V., Marinos, P., Tsiambaos, G., 2012. Rockfall hazard and risk assessment: an example from a high promontory at the historical site of Monemvasia, Greece. Nat.Hazards Earth Syst. Sci, 12, pp. 1823-1836.
Toniani, M., and Abellan, A., 2014. Rockfall detection from terrestrial LiDAR point clouds: A clustering approach using R. Journal of Spatial Information Science, 8, pp . 95-110.