CHANGE SEMANTIC CONSTRAINED ONLINE DATA CLEANING METHOD FOR
REAL-TIME OBSERVATIONAL DATA STREAM
Yulin Ding a, Hui LIN a,*, Rongrong LI a
a Institute of Space and Earth Information Science, The Chinese University of Hong Kong, Shatin, Hong Kong, China - (dingyulin,
huilin, rongrongli) @cuhk.edu.hk
Commission II, WG II/3
KEY WORDS: Real-time observational data stream; Change semantic constraint; Kalman filtering
ABSTRACT:
Recent breakthroughs in sensor networks have made it possible to collect and assemble increasing amounts of real-time observational data by observing dynamic phenomena at previously impossible time and space scales. Real-time observational data streams present potentially profound opportunities for real-time applications in disaster mitigation and emergency response, by providing accurate and timeliness estimates of environment’s status. However, the data are always subject to inevitable anomalies (including errors and anomalous changes/events) caused by various effects produced by the environment they are monitoring. The “big but dirty” real-time observational data streams can rarely achieve their full potential in the following real-time models or applications due to the low data quality. Therefore, timely and meaningful online data cleaning is a necessary pre-requisite step to ensure the quality, reliability, and timeliness of the real-time observational data.
In general, a straightforward streaming data cleaning approach, is to define various types of models/classifiers representing normal behavior of sensor data streams and then declare any deviation from this model as normal or erroneous data. The effectiveness of these models is affected by dynamic changes of deployed environments. Due to the changing nature of the complicated process being observed, real-time observational data is characterized by diversity and dynamic, showing a typical Big (Geo) Data characters. Dynamics and diversity is not only reflected in the data values, but also reflected in the complicated changing patterns of the data distributions. This means the pattern of the real-time observational data distribution is not stationary or static but changing and dynamic. After the data pattern changed, it is necessary to adapt the model over time to cope with the changing patterns of real-time data streams. Otherwise, the model will not fit the following observational data streams, which may led to large estimation error. In order to achieve the best generalization error, it is an important challenge for the data cleaning methodology to be able to characterize the behavior of data stream distributions and adaptively update a model to include new information and remove old information. However, the complicated data changing property invalidates traditional data cleaning methods, which rely on the assumption of a stationary data distribution, and drives the need for more dynamic and adaptive online data cleaning methods. To overcome these shortcomings, this paper presents a change semantics constrained online filtering method for real-time observational data. Based on the principle that the filter parameter should vary in accordance to the data change patterns, this paper embeds semantic description, which quantitatively depicts the change patterns in the data distribution to self-adapt the filter parameter automatically. Real-time observational water level data streams of different precipitation scenarios are selected for testing. Experimental results prove that by means of this method, more accurate and reliable water level information can be available, which is prior to scientific and prompt flood assessment and decision-making.
1. INTRODUCTION
Recent breakthroughs in sensor networks have made it possible to collect and assemble increasing amounts of real-time observational data by observing dynamic phenomena at previously impossible time and space scales (NSF, 2005). Real-time observational data streams present potentially profound opportunities for real-time applications in disaster mitigation and emergency response, by providing accurate and timeliness estimates of environment’s status (Gama and Gaber, 2007). However, the data are always subject to inevitable anomalies
(including errors and anomalous changes/events) caused by various effects produced by the environment they are monitoring (Nativi et al., 2015). The “big but dirty” real-time observational data streams can rarely achieve their full potential in the following real-time applications due to the low data quality. Therefore, a timely and meaningful online data cleaning is a necessary pre-requisite step to ensure the quality, reliability, and timeliness of the real-time observational data streams (Huang, 2015; Goodchild, 2013; PhridviRaj and GuruRao, 2014).
S
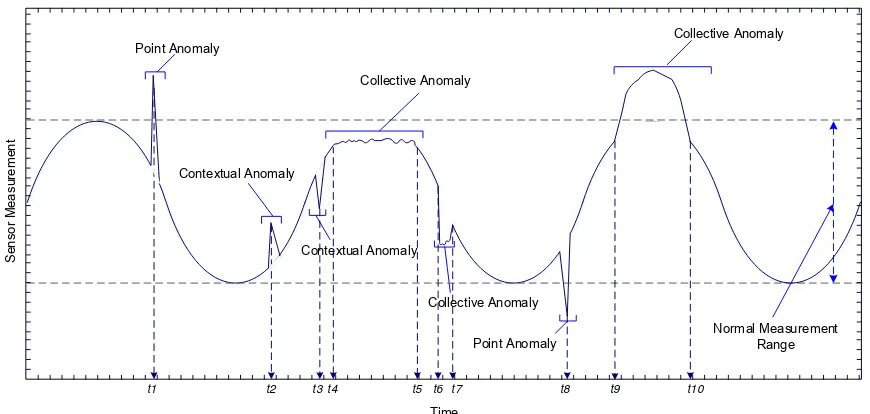
Fig.1 The fluctuation patterns of the real-time water level data stream (Chandola et al., 2009)
Anomalies in real-time observational data streams can cover a variety of different anomalous changes/events and errors and have various semantics with different length, distributions and change patterns (Chandola et al., 2009). changes/events are unusual patterns that reflect the true state of monitoring phenomena, but do not conform to the normal sensor data patterns. Fig. 1 illustrates several major anomalies that could occur in the real-time observational data stream, and could be defined into three types, including Point Anomaly, Contextual anomaly, and Collective Anomalies. Anomalies can occur due to different causes. These anomalies are always produced by sensor software or hardware malfunctions and data shifting errors. Highly abnormal phenomenon change may also cause anomalies. It is hard to distinct between errors and anomalous changes/events by analyzing sensor data only, as the same data instances might be considered errors or abnormal changes/events according to different context. Consequently, in order to efficiently identify the erroneous values and the unusual, but true event values, contextual semantic awareness is essential to a good data cleaning methodology.
Data cleaning for the real-time observational data streams refers to the dynamic data quality assurance and control process of finding anomalous patterns, removing errors and extracting useful information. In general, a straightforward streaming data cleaning approach, is to define various types of models/classifiers representing normal behaviour of sensor data streams and then declare any deviation from this model as abnormal or erroneous data. The effectiveness of these models is affected by dynamic changes of deployed environments. Due to the changing nature of the complicated phenomenon, real-time observational data is characterized by diversity and dynamic, showing a typical Big (Geo) Data characters. Dynamics and diversity is not only reflected in the data values, but also reflected in the complicated changing patterns of the data distributions. This means the pattern of the real-time observational data distribution is not stationary or static but changing and dynamic. After the data pattern changed, it is necessary to adapt the model over time to cope with the
changing patterns of real-time data streams. Otherwise, the model will not fit the following observational data streams, which may led to large estimation error. Therefore, it is an important challenge for the data cleaning methodology to be able to characterize the behaviour of data stream distributions and adaptively update the model.
To meet the need for online environmental sensor data stream cleaning, several studies have explored methods suitable for separating fault data in real-time observational data streams (Hill, 2013). Previous approaches to sensor data streams cleaning can be broadly categorized into two classes (Chandola et al., 2009; Patcha and Park, 2007). The rule-based approach uses a prior knowledge to classify the sensor data. The statistical-based approaches execute the detecting process by compare the sensed data trajectory with predefined samples. The values that deviate from predefined patterns are labelled as outliers.
Rule-based approaches exploit domain knowledge to define heuristic rules/constraints that the normal sensor values must satisfy (Rahman et al., 2014), otherwise the value will be regarded as outliers. Expert knowledge and historical experiments of specific domains have been popularly used for sensors validation and faults detection in many fields, including engineered systems (Rabatel et al., 2011), water environment (Mounce et al., 2011), and so on. The rule-based approaches establish a series of rules (e.g. threshold) from domain experts’ knowledge or historical training experiments, and then classify the newly injected data into one of the predefined (normal/outlier) classes. Rule-based approaches rely on the availability of accurate and various domain rules (a priori knowledge) and have substantial connection with their application domain. However, the a priori knowledge required by rule-based approaches is often not available. (Ramanathan et al., 2006) have introduced a series of thresholds obtained from domain experts that can be used to construct the soil chemical concentration data quality rules. Rule-based methods can be highly accurate in detecting and classifying errors. Especially, the rule-based model/classifier has high sensitivity to the selected rules (Sharma et al., 2010) but poor adaptability to new data characteristics. Therefore, when new data characteristics emerge, the rule-based priori model/classifier have to optimize itself to accommodate new instances that belong to the normal
class, that make them unsuitable for real-time streaming data cleaning.
Statistical-based approaches leverage historical distributions of sensor behavior to build a statistical probability distribution model for these streaming data (Bolton and Hand, 2002; Ge et al., 2010; Montgomery, 2007). In most of the statistical-based approaches, the statistical model are exploited to predict the underlying data distribution based on the temporal correlations of the historical data (Hill and Minsker, 2010; Yao et al., 2010) of individual sensors or spatiotemporal correlation of sensor network. This study here concentrates on cleaning the data sets on the individual nodes. After the statistical model defined, statistical inference tests will be applied to determine whether a newly injected data conform to the model or not. For the statistical model outputs, the normal data can fit into the not a requisite condition for statistical approaches. Statistical-based techniques is mathematically proved, and justified through computation (Bolton and Hand, 2002). The major disadvantage of statistical techniques is that they often rely on the assumptions that the spatial, temporal or spatiotemporal correlation of the observational data obeyed the accurate and quantifiable probability distributions (Markou and Singh, 2003). These assumptions are not universally applicable to real-life phenomenon.
To conclude, various data cleaning approaches for sensor data streams have been proposed in the literature. These researches have given detailed review on the usage of rule-based classifier or statistical models to represent the underlying distribution patterns of normal observations and identify any highly different instants as error. The effectiveness of these models is affected by dynamic changes of monitored environments. The adaptability to the changing data distributions of these models in dynamic environments is an important challenge for assuring the quality of sensor measurements. However, most of the proposed data cleaning approaches require the assumptions of a stationary data distributions and quasi-stationary process, which cannot be assumed for most data processed by anomaly detection systems (Patcha and Park, 2007). Besides, the adaptability of data cleaning methodology with dynamic changes in the monitored environment was rarely considered by previous studies. The complicated changing property of real-time observational data streams is not suitable for traditional data cleaning methods, and requires dynamic and adaptive online data cleaning methods.
In this paper, a novel hydrological change semantics constrained online data cleaning method for real-time observational water level data is proposed. The trajectory composed by consecutive observation points on the real-time data stream contains rich semantic information of the underlying changing phenomenon states; moreover, the changing pattern of trajectory distribution implies the change semantics of the evolution process and evolution trend of the observed dynamic process. In this case, semantically understanding the observed phenomenon and the extreme events, or learning the data distribution patterns, can assist in adaptively model updating as well as to resolving the ambiguity. Therefore, this work presents an adaptive model optimizing strategy by creating dynamic semantic mapping between real-time data changing patterns and the rules of spatial-temporal
geographic process evolution, and then using change semantics constrain the Kalman filter optimizing process.
The efficiency and effectiveness of the proposed method are validated and compared with some existing filters using real life real-time observational water level data streams of different precipitation scenarios.
The remainder of this paper is structured as follows. The proposed methodology and the implementation of the proposed approach are described in Section 2. The experimental results, analysis, and evaluation of the proposed models are outlined in Section 3. Finally, concluding remarks and some directions for future research are presented in Section 4.
2. METHODS
2.1 Overview
In this section, the framework of our proposed approach is described in detail.
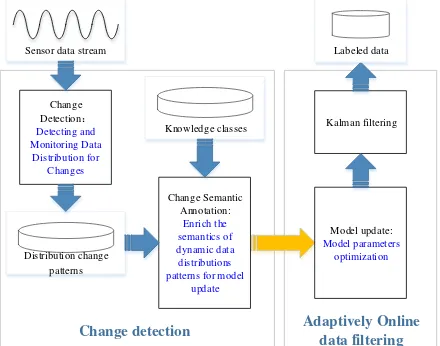
The brief framework of our approach is illustrated in Fig. 2. The two issues mentioned above are addressed: (a) the change detection process about the underlying distribution patterns and (b) the adaptively online data filtering in new data. Real time observational data will be injected in the change detection part in order to determine whether there has been a change in the data distribution. When the change detection algorithm determines that a significant change has occurred in the data distribution, an update to the model will occur in the online data filtering part.
Fig.2 General Framework of the proposed approach
2.2 Change detection
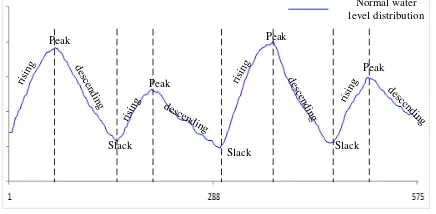
In brief, the change detection process is divided into three steps. First, the most frequent data distribution patterns without anomalies are extracted from historical observations. Then, these patterns are characterized into knowledge classes. The knowledge class will describe normal behaviour with contextual semantics, and also provide the data filtering process with essential information about the impact of contextual criteria. For example, Fig 2 shows the normal distribution of real time water level observations from Pinghu Shi hydrological station. The observation is recorded once per 5 minutes, so each day has 288 observations accordingly. It can be noted that in each day, the observations show clear regular patterns of “rising- peak – descending - slack”, even the water level data obtained in heavy rainy weather shows the same regular patterns. Thus, it is clear that, real time water level stream could be divided into segments with semantic annotation of “rising” or “descending”. By this,
we can distinguish whether or not a change in water level is abnormal. That is to say, if in “rising” period, there is a “descending” value, then the “descending” value should be considered as an error, and vice versa.
Peak
Fig. 2 Normal change patterns of the real-time water level data stream obtained at Huanggutang station
Furthermore, the slope between two consecutive water level observations are also found distributed evenly within a range. The water level change between two consecutive observations have roughly the same proportion. However, the results show that due to different weather conditions, the distribution of water level change pattern stays the same, but the slope two consecutive water level observations changes. This is reasonable because the water level change in Pinghu City is a cyclical fluctuation phenomenon and is vulnerable to be effected by rainy weather, as shown in Fig. 3.
t t+1 t+2 t+3 t+4 t+5 t t+1 t+2 t+3 t+4 t+5
Fig.3 The observational water level data stream changes
In this study, we define BL (Bending Level) to quantitatively water level change patterns “rising- peak –descending - slack” and gives the contextual criterias for the slope between two consecutive water level observations. BL will be used to constraint the parameter selection process in the next data filtering step.
Tab. 1 Base patterns and semantic descriptions of the observational water level data stream changes
Change event Pattern contextual criteria no significant change z(0) BL≈0
slowly rising z(+) 0.1%·△z≤ BL < 10 %·△z, zt > △z is the change of the observations of water level
2.3 Adaptively Online Kalman filtering
After having characterized the behavior in the first step of the proposed method, adaptively online Kalman filtering will be executed to detect anomalies and errors in newly recorded data stream. In this part, the previously obtained knowledge will be used to identify a time when the data distribution has changed significantly enough to justify an update of the Kalman model parameters in the data filtering step. Different model parameters can be optimal for different data distributions.
The Kalman filter provides an efficient computational (recursive) mean to estimate the state of a process, in a way that minimises the mean of the square error. Due to the merits of low computational complexies and memory footprint of Kalman filter, it is suitable for dynamic applications and widely adopted in data stream processing (Sun and Deng, 2004; Li and Peng, 2014; Wang et al., 2011). However, in most cases while the application of classical Kalman filters for the dynamic data quality control of environmental sensor data seems to be good and for water level observations filtering may lead to poor results. This is because it is important that if there is a change in the data distribution, the Kalman filter model parameters need to be re-optimized to reflect this.
In our study, the adaptively online Kalman filtering is based on the semantic constrained parameter re-optimizing. The state variable at the time tk here is true dynamic water level wk,
defined as wk = wk-1 + △wk, where wk-1 is the true dynamic
water level at the time tk-1, △wk is the semantic constrained
change value of two consecutive water level observations. The observation procedure zk can then be represented by forcing a
bias to the true dynamic water level wk. Therefore, the structure
of the Kalman filter in our study is formed as the following measurement vector respectively. Ωk denotes the process noise
and δk denotes the measurement noise. Qk denotes the process noise covariance and Rk denotes the measurement noise covariance and we assume E[Ωk] = 0, E[δk] = 0. That is to say
the estimators of Qk, Rk contain non-systematic part of errors and the water level changes follow the normal distribution by assumption.
During the recursive online Kalman filtering process, the contextual criteria on water level change will be dynamically hydrological station provides water level measurements at 5-min 5-min measurement intervals, a frequency selected to support urban flood monitoring. Black solid line in Fig 2 shows water level measurements (with 576 observation values) with no effective rainfall rain. Black solid line in Fig 3 shows water
level measurements (with 1440 observation values) with high rainfall. These two datasets were selected to test our proposed method.
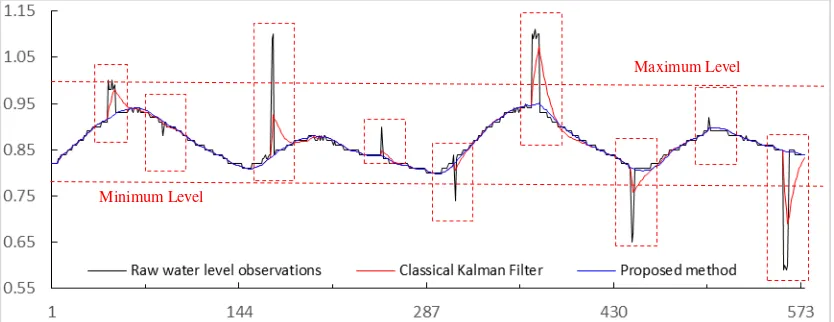
Fig 4 and Fig 5 illustrate the online data cleaning results from the classical Kalman filtering method and the proposed method, in which the blue solid lines show the results from the proposed method and the red solid lines denote the results of Kalman filter. It can be noted that in the abnormal areas (denoted by the dashed rectangles), the proposed method can filter the outliers
correctly. On the other hands, the classical Kalman filter still produces noticeable spines in the profiles. In the outlier region, the slope of the water level exceeds a certain range, which is ignored by the classical Kalman filter. However, in the proposed method, the range of the slopes are detected and determined through the combination of contextual semantics as denoted in Table 1 and the amount of the observed perception. So abnormal observations can be dynamically filtered using the constrained slope of the water level.
Fig. 4 Filtering results of the real time observational water level data stream obtained at Huanggutang station with no precipitation (2014/6/9-2014/6/10)
Fig. 5 Filtering results of the real time observational water level data stream obtained at Huanggutang station under rainfall weather (2014/6/25-2014/6/29)
Maximum Level
Minimum Level
Maximum Level
Minimum Level
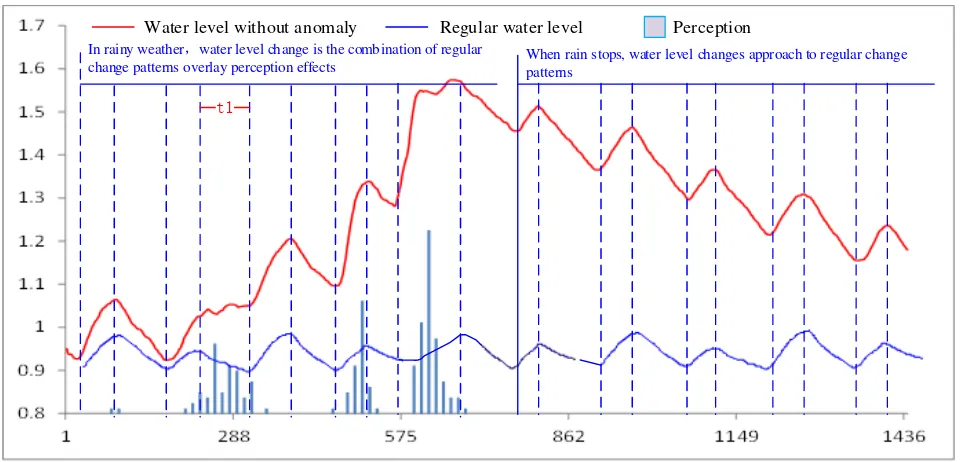
Perception Water level without anomaly Regular water level
When rain stops, water level changes approach to regular change patterns
In rainy weather,water level change is the combination of regular
change patterns overlay perception effects
t1
Fig. 6 Filtering results analysis of the real-time water level data stream obtained at Huanggutang station
Finally, it is worth noting that, projection of the current water levels estimated by our method are is reasonable, which shows high correlation with the regular water change patterns and impacts of weather. Fig. 6 shows the water level of the historical water level observations without rains (blue lines), the projected water levels after filtering of a rain (red lines) and the corresponding perception observations (blue bars). The observation is recorded once per 5 minutes, so each day has 288 observations accordingly. These patterns have defined the contextual semantics in the proposed method. Furthermore, the filtering and projection of the water level observations are also aware of the perception data. For example, in the time period of t1, which is the period with descending semantic and positive amount of perceptions, the constraints of the water level is smoothly rising or descending according to Table 1.
In order to evaluate the results, we have calculated three measures of quality widely used:
(1) Determinant coefficient, denoted as DC. This is a commonly used statistic value to evaluate the fitness between the projections and the ground truth observations. DC ranges from 0 - 1, where 1 denotes perfect fit between the projection and the ground truth. Equation (3) shows the detailed calculation of the DC as: observations of different days, observations with no outliers are chosen as ground truth.
w
ˆ
t denotes the projections of theKalman fiter and
w
tdenotes the mean of the ground truth.(2) Traditional evaluation statistics, including the ERMSE (Root
Mean Square Error) and the ENRMSE (Normalized Root Mean
Square Error), as the following Equations:
2 1/ 2Tab. 2 Performances comparison of our proposed and traditional methods
Table 2 compares the performances of the proposed method and the classical Kalman filters with regard to computational complexes and accuracies of the projections against ground truth observations. It can be noted that, the proposed methods requires lower runtime, because some observations are filtered using the slope threshold from the constraints of the contextual semantics and the observed perceptions. Furthermore, the proposed methods present a certain amount of enhancements in both DC and the error statistics. In the first dataset, because the ratio of the outliers is higher, the classical methods only observations. Furthermore, because the outliers are not filtered off, the results is also reflected in the RMSE and NRMSE,
where the proposed method is about 50% better.
4. CONCLUSION
Aiming at online data stream cleaning, this paper presents a change semantics constrained online filtering method. In summary, the proposed method has the following two innovative aspects. (1) A new efficient Semantic Awareness based real-time data stream change patterns detection function is used and embedded in the proposed study to explicitly semantic depict and quantitatively describe the data pattern changes in dynamic environments. (2) Dynamic semantic mapping between real-time data changing patterns and the rules of spatial-temporal geographic process evolution is implemented in the algorithm for adaptive threshold determination and Kalman filter model parameters optimizing. As a result, the misclassification error caused by this dynamic change is reduced. Further work may be can be done on the change detection step to handle more complicated observational datasets.
ACKNOWLEDGEMENTS
This study was supported by the National Key Basic Research Program of China (973 Program, No. 2015CB954103) and the National Natural Science Foundation of China (No. 41501421).
REFERENCES:
Bolton, R.J. and Hand, D.J., 2002. Statistical fraud detection: A review. Statistical science: 235-249.
Chandola, V., Banerjee, A. and Kumar, V., 2009. Anomaly detection: A survey. ACM Computing Surveys (CSUR), 41(3): 15.
Gama, J. and Gaber, M.M., 2007. Learning from data streams: Processing Techniques in Sensor Networks. Springer, 243 pp.
Ge, Z., Kruger, U., Lamont, L., Xie, L. and Song, Z., 2010. Fault detection in non-Gaussian vibration systems using dynamic statistical-based approaches. Mechanical systems and signal processing, 24(8): 2972-2984.
Goodchild, M.F., 2013. The quality of big (geo) data. Dialogues in Human Geography, 3(3): 280-284.
Hill, D.J., 2013. Automated Bayesian quality control of streaming rain gauge data. Environmental Modelling & Software, 40: 289-301.
Hill, D.J. and Minsker, B.S., 2010. Anomaly detection in streaming environmental sensor data: A data-driven modeling approach. Environmental Modelling & Software, 25(9): 1014-1022.
Huang, H., 2015. Anomalous behavior detection in single-trajectory data. International Journal of Geographical Information Science: 1-20.
Li, L. and Peng, J., 2014. Multiple Kalman filters model with shaping filter GPS real-time deformation analysis. Transactions of Nonferrous Metals Society of China, 24(11): 3674-3681.
Markou, M. and Singh, S., 2003. Novelty detection: a review— part 1: statistical approaches. Signal processing, 83(12): 2481-2497.
Montgomery, D.C., 2007. Introduction to statistical quality control. John Wiley & Sons.
Mounce, S.R., Mounce, R.B. and Boxall, J.B., 2011. Novelty detection for time series data analysis in water distribution systems using support vector machines. Journal of hydroinformatics, 13(4): 672-686.
Nativi, S. et al., 2015. Big Data challenges in building the Global Earth Observation System of Systems. Environmental Modelling & Software, 68: 1-26.
NSF, 2005. Sensors for Environmental Observatories: Report of the NSF-Sponsored Workshop, Arlington, VA.
Patcha, A. and Park, J., 2007. An overview of anomaly detection techniques: Existing solutions and latest technological trends. Computer Networks, 51(12): 3448-3470.
PhridviRaj, M. and GuruRao, C.V., 2014. Data mining–Past, present and future–A typical survey on data streams. Procedia Technology, 12: 255-263.
Rabatel, J., Bringay, S. and Poncelet, P., 2011. Anomaly detection in monitoring sensor data for preventive maintenance. Expert Systems with Applications, 38(6): 7003-7015.
Rahman, A., Smith, D.V. and Timms, G., 2014. A Novel Machine Learning Approach Toward Quality Assessment of Sensor Data. Sensors Journal, IEEE, 14(4): 1035-1047.
Ramanathan, N. et al., 2006. Rapid deployment with confidence: Calibration and fault detection in environmental sensor networks. Center for Embedded Network Sensing.
Sharma, A.B., Golubchik, L. and Govindan, R., 2010. Sensor faults: Detection methods and prevalence in real-world datasets. ACM Transactions on Sensor Networks (TOSN), 6(3): 23.
Sun, S. and Deng, Z., 2004. Multi-sensor optimal information fusion Kalman filter. Automatica, 40(6): 1017-1023.
Wang, Y., Song, B., Fu, H. and Li, X., 2011. Cleaning Method of RFID Data Stream Based on Kalman Filter. Journal of Chinese Computer Systems, 32(9): 1794-1799.
Yao, Y., Sharma, A., Golubchik, L. and Govindan, R., 2010. Online anomaly detection for sensor systems: A simple and efficient approach. Performance Evaluation, 67(11): 1059-1075.
Zhang, Y., Meratnia, N. and Havinga, P., 2010. Outlier detection techniques for wireless sensor networks: A survey. Communications Surveys & Tutorials, IEEE, 12(2): 159-170.