FROM GEOMETRY TO DIAGNOSIS: EXPERIENCES OF GEOMATICS IN
STRUCTURAL ENGINEERING
B. Riveiroa*, P. Ariasb, J. Armestob, J.C. Caamañoa, M. Sollab a
Dept. of Material Science, Applied Mechanics and Construction, University of Vigo, Vigo, 36310, SPAIN (belenriveiro, jccaam)@uvigo.es
b
Dept. Natural Resources Engineering and Environmental Engineering, University of Vigo, University of Vigo, Vigo, 36310, SPAIN (parias, julia, merchisolla)@uvigo.es
Commission V, WG V/4
KEY WORDS: Terrestrial Photogrammetry, Terrestrial Laser Scanning, Infrastructures, Data Integration, Monitoring.
ABSTRACT:
Terrestrial photogrammetry and laser scanning are technologies that have been successfully used for metric surveying and 3D modelling in many different fields (archaeological and architectural documentation, industrial retrofitting, mining, structural monitoring, road surveying, etc.). In the case of structural applications, these techniques have been successfully applied to 3D modelling and sometimes monitoring; but they have not been sufficiently implemented to date, as routine tools in infrastructure management systems, in terms of automation of data processing and integration in the condition assessment procedures.
In this context, this paper presents a series of experiences in the usage of terrestrial photogrammetry and laser scanning in the context of dimensional and structural evaluation of structures. These experiences are particularly focused on historical masonry structures, but modern prestressed concrete bridges are also investigated. The development of methodological procedures for data collection, and data integration in some cases, is tackled for each particular structure (with access limitations, geometrical configuration, range of measurement, etc.).
The accurate geometrical information provided by both terrestrial techniques motivates the implementation of such results in the complex, and sometimes slightly approximated, geometric scene that is frequently used in structural analysis. In this sense, quantitative evaluating of the influence of real and accurate geometry in structural analysis results must be carried out.
As main result in this paper, a series of experiences based on the usage of photogrammetric and laser scanning to structural engineering are presented.
* Corresponding author: Tel.: +34 986 813499;
E-mail address: [email protected] (B. Riveiro).
1. INTRODUCTION
Terrestrial photogrammetry and laser scanning are technologies that have been successfully used for metric surveying and 3D modelling in many different fields (archaeological and architectural documentation, industrial retrofitting, mining, structural monitoring, road surveying, etc.). In the case of structural applications, these techniques have been successfully applied to 3D modelling and sometimes monitoring; but they have not been sufficiently implemented to date, as routine tools in infrastructure management systems, in terms of automation of data processing and integration in the condition assessment procedures.
The accurate geometric information provided by both terrestrial techniques motivates the implementation of such results in the complex, and sometimes slightly approximated, geometric scene that is frequently used in structural analysis. In this sense, quantitative evaluating of the influence of real and accurate geometry in structural analysis results must be carried out.
Many authors have focussed their investigations towards the structural stability of masonry arches (Oliveira, 2010; Drosopoulos, 2008) and all of them used geometry as data source when performing their structural analysis. For example, in Huerta (2008) a review of the evolution of the structural
study of masonry vaults is presented. Additionally, he demonstrated the graphical methods to evaluate the masonry arch stability, since the line of trust can be graphically represented through the equation of equilibrium. Jaques Heymann (1969) proposed a Modern Theory of Limit Analysis where a geometric factor is obtained through the comparison between the current masonry arch and the geometry of the limit arch supporting only dead loads.
Geometry is also present when considering modern concrete or steel bridges. In this sense, the equation of elasticity represents the expected deformation of structures under some particular loads. For the case of prestressed concrete bridges, beams are regularly pre-deformed so they acquire a camber which is monitored over time in order to check the serviceability of the structure.
According to the previous paragraphs, this paper presents a series of experiences in the usage of terrestrial photogrammetry and laser scanning in the context of dimensional and structural evaluation of structures. These experiences are particularly focused on historical masonry structures, but modern prestressed concrete bridges are also investigated. The development of methodological procedures for data collection,
and data integration in some cases, is tackled for each particular structure (with access limitations, geometrical configuration, range of measurement, etc.).
The first group of experiences are related to the usage of photogrammetric and laser scanning products towards its implementation in planar structural analysis procedures, which are based on the theories of Limit Analysis.
Based on the results obtained in the above methodologies, a new tool for the routine inspection of masonry arch bridges was developed. Such tool consists of a mobile inspection unit which is constituted of a photogrammetric module that incorporates algorithms for 2D projective transformation of images and an auxiliary tool with control points that allows the images to be transformed. After the metric document is obtained, the mobile inspection unit also incorporates software for structural analysis specifically developed for this tool.
Not only 2D structural analyses were performed from geometric models obtained by geomatic techniques but also more advanced analysis in a 3D environment. In this case, the 3D models of bridges and their vaults obtained by photogrammetry were used to perform structural analysis through finite elements based modelling (FEM).
Although performing structural analysis in 3D means a more realistic scenario when tackling the stability of structures, this assumption is not completely exact when evaluating masonry structures. This kind of structures normally presents an “envelope” of mechanized masonry that usually contains irregular materials internally. In fact, stability analysis that consider arch geometry normally assumes that the barrel contain an uniform voussoir’s thickness. Nevertheless, most of the roman and medieval structures present irregular thickness and this irregularity must be known in order to perform accurate and safe structural evaluations. In this sense, last methodology was improved through the construction of integral 3D models composed of external geometry measured by visible geomatic methods (photogrammetry) and inner geometry estimated by non-visible methods such as Ground Penetrating Radar (GPR).
So this paper basically summarized the above methodologies as well as their more relevant results, demonstrating the potential of the integration of real geometry collected by geomatic methods in the complex field of structural engineering.
2. ORTHOPHOTOS AND LIMIT ANALYSIS OF MASONRY ARCHES.
The firsts experiences collected here shows the potential of both photogrammetric and laser scanning techniques for the production of 2D accurate products in the form of orthoimages. From such geometric and radiometric data, a methodology for stability analysis of bridges, based on the principles of planar limit analysis theory, was developed. Riveiro et al. (2011a) presented the results obtained by this methodology ejected in a mediaeval masonry arch bridge: Cernadela Bridge.
2.1 Geomatic survey of masonry bridges.
Before the structural analysis of the bridge can be done, it was necessary to survey the structures by geomatic techiques. Both photogrammetry and terrestrial laser scanning (TLS) are adequate methods to produce the metric product: orthoimages.
The procedures to obtain such metric product from masonry arch bridges are presented in (Riveiro et al, 2008).
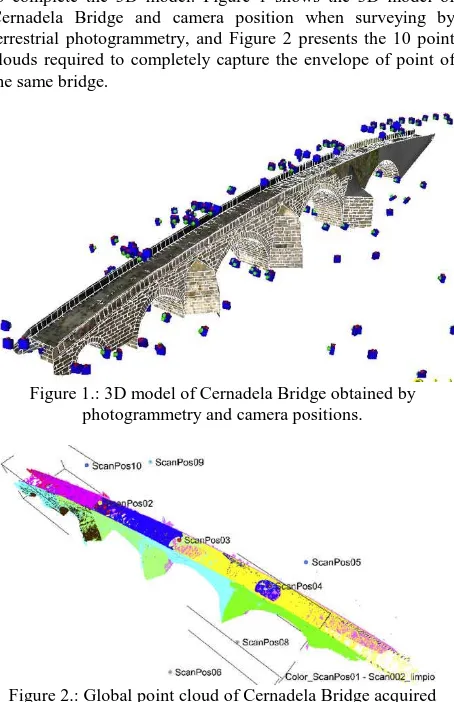
In general, when using the whole geometry of the bridge the utilization of TLS systems is recommended due to the amount of data that is required. For the case of Cernadela Bridge, more than 150 images are required to construct the 3D model of the whole structure. When performing the survey with the TLS Riegl LMS Z-390i, only 10 different scan positions are required to complete the 3D model. Figure 1 shows the 3D model of Cernadela Bridge and camera position when surveying by terrestrial photogrammetry, and Figure 2 presents the 10 point clouds required to completely capture the envelope of point of the same bridge.
Figure 1.: 3D model of Cernadela Bridge obtained by photogrammetry and camera positions.
Figure 2.: Global point cloud of Cernadela Bridge acquired from 10 different scanner stations.
After collecting point clouds by both photogrammetry (Photomodeler Scanner®) and by TLS (Riegl LMS Z-390i), they were converted into surfaces through a process of triangulation. Point clouds were previously filtered and noise was removed from the point cloud of the model.
Once the 3D model of surfaces was created it was textured. For the case of 3D model generated by photogrammetry the images used for the geometry reconstruction were used as textures for the model as well. In the case of the 3D model created by TLS, images that were independently acquired from the structure were subsequently externally oriented regarding to the coordinate system of the point cloud so textures were projected onto the triangles. After texturing the models, othoimages were produced so they could be subsequently implemented in the next step of the methodology.
2.2 Structural analysis
Once the orthoimages are ready, they are imported into an application specifically developed for the stability analysis of
masonry arch bridges. This module is based on planar analysis of arches according to the limit analysis theory (Heyman, 1969).
The method is implemented according to rigid blocks method proposed by Livesley (1978) who developed a method for the computational analysis of masonry assuming it is a rigid-plastic solid. The load carrying capacity of bridge is estimated on the basis of the failure load for the critical arch where a load factor is computed through the equilibrium equations and the criteria for failure imposed at the voussoir interfaces.
The masonry arch is a hyper-static structure in third grade so this assertion involves infinity possible thrust lines. For a pure compression structure to be in equilibrium with the applied loads there must be a line that lies entirely within the masonry section (voussoir’s thickness). Therefore, equilibrium in a masonry arch can be visualized with a line of thrust. On the basis of the geometric information of the bridge and the characteristics of the material, different mechanisms of collapse are analysed for each arch. These different mechanisms of collapse (and potential hinges) are due to the variation in the positioning of the load. The results that the software produces are the value and position of the collapse load. Additionally, the result is graphically illustrated through a line of thrust and potential hinges having into account the contours of the arch ring.
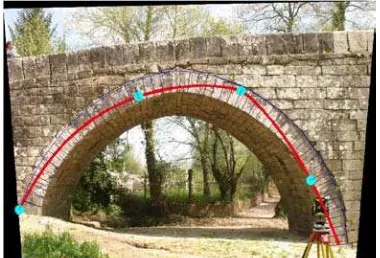
Orthoimages generated in the previous steps are automatically read by an application specially developed for the extraction of arch contours (intrados and voussoir’s thickness). Through this accurate source of information, the structural evaluation can be carried out. Figure 3 shows an example of analysis for the second arch of Cernadela Bridge.
Figure 3. Results of structural analysis in the second arch of Cernadela Bridge (Riveiro et al, 2011).
3. IN-SITU DIAGNOSIS OF MASONRY ARCH BRIDGES: TOOLS FOR ROUTINE INSPECTION.
Several bridge management system (BMS) are currently available, being Pontis (Thompson et al., 1998) or BRIDGIT (Hawk and Small, 1998) the most commonly used. But there are very few BMS that more or less deeply consider the study of masonry structures. In general, although those systems consider masonry structures and incorporates modules for inventory and visual inspection (without exhaustive geometry information), they do not allow the structural analysis to be performed. So, this information cannot be directly used to produce the diagnosis of the structure.
According to this, the purpose of the following methodology was to develop a masonry BMS that, first contains accurate
geometry of all the structural elements of the structure as well as of all the damages that appear on the body of the bridge, and second, that also incorporates a module for the structural analysis of the bridge, so load carrying capacity can be estimated attending to its current condition.
Due the potentiality of the previous methodology, a low cost photogrammetric technique for the 2D metrical inspection of masonry arch bridges was developed towards its implementation in such bridge management system. A surveying tool was developed, based on a simple 2D projective coordinate transformation, in order to be implemented in a mobile inspection unit. This tool provides not only the metrical document but also the input data for the structural evaluation of arches based on limit analysis modern theory through the rigid blocks method.
3.1 Photogrammetric approach
To perform a complete geometric modelling of masonry bridges such as those shown in the previous methodology is not efficient when the purpose of the survey is just a routine inspection of the structure. For that reason, the previous methodology evolved towards a simplified one where geometry was acquired in a quite simpler way (due to metrical analysis of structures are normally done in 2D space).
The basis of this project consisted in the development of a mobile inspection unit (MIU) that allows to perform the inventory and inspection of masonry bridges based on the geometry obtained by the photogrammetric approach and that also allow performing the structural analysis in situ.
The photogrammetric measurement system is based on plane rectification. In this situation, the photogrammetric tool consists of a digital camera and a crosshead auxiliary tool with known distances for image rectification.
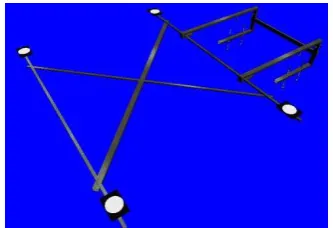
3.2 Auxiliary tool
Figure 4. Auxiliary crosshead to assist planar projective transformation.
To calculate the eight parameters of a projective transformation it is necessary to know a minimum of four 2D point correspondences. For the present methodology it is possible thanks to an auxiliary tool designed as a folding crosshead with four targets or control points that is calibrated in the laboratory before being used in the field. To achieve the planar projective transformation three of the four points cannot be collinear, so the final design of the tool was the one shown in Figure 4.
This instrument was machined in aluminium (coefficient of linear thermal expansion with negligible metric effects in
normal conditions) in order to have a light tool that could be easily mounted in each surveyed structure. Additionally, to avoid displacements of joins of the crosshead it incorporates a St Andrew’s Cross that constrains the potential displacements. Targets consist of reflective circular targets with a diameter of 10 cm that can be easily identified from distances farer than 20 m with standard digital cameras (with enough pixel representation for the automatic marking of the targets).
This application was implemented using C# programming language that is an object-oriented language for the development of applications for Microsoft .NET compatible platforms. All the data transfer involved in this bridge management system data is managed through Extensible Markup Language (XML).
The metric extraction of the structure is possible after acquiring single images of it with convectional digital cameras that contain the auxiliary tool vertically hanged up and in touch with the main plane of the structure.
Once targets are detected, the transformation is ejected so a rectified image of the vertical planes of the structure is obtained as shown in Figure 5.
Figure 5. Rectified image of an arch with application for metric inventory.
Figure 6. Main menu of the masonry BMS after rectifying and referecing all the structural elements that must be inspected.
3.3 Structural analysis
The same application for structural analysis that was described for the previous methodology was implemented into this masonry BMS. As it was exposed, this application was implemented using Matlab software and the data transfer between photogrammetric module and structural analysis is done through XLM.
When the rectified image is read, the contours of voussoirs that compose the end of the vault are outlined so the structural analysis can be done after defining the mechanical properties of the materials (masonry) as well as the boundary conditions.
Figure 7 presents the graphical results of the structural analysis that corresponds to the collapse load. As it can be seen, for the inspector is quite easy focus his attention to those point that potentially contains hinges of the arch for such mechanism of collapse, so the procedure of inspection is optimized. Apart of the graphic results the load carrying capacity (value of collapse load and position) is stored with the rest of the inspection data.
Figure 7. Graphic results of the structural analysis. Representation of the thrust line as well as the four-hinges
mechanism.
4. NUMERICAL ANALYSIS OF MASONRY BRIDGES BASED ON PHOTOGRAMMETRIC MODELS.
The third group of experiences presented in this paper shows the potentiality of 3D real models, such as those obtained by terrestrial photogrammetry towards their implementation in more sophisticated analysis involving numerical analysis such as finite elements based modelling. According to this, it was possible to characterize both geometric and mechanical properties of masonry arches, and so, to perform complex, but more realistic, stability analysis of those structures.
As it was explained previously, the formulation of plastic analysis (or mechanism methods) applied to masonry arch structures can be posed in terms of the thrust line, whereby the failure of the structure occurs when the thrust line touches the boundary of an arch geometry, which forms joints in a sufficient number of points to convert the element into a mechanism. Livesley (1978) and Gilbert (1998) used computer-discrete formulations (where the model consists on a series of rigid blocks to idealise the behaviour of the voussoirs of the arch). As it was announced in the first methodology of this paper, the problem can be raised in terms of equilibrium or kinematic, in which case it can be resolved by linear programming in many cases.
Loureço (2002) presents information about numerical modelling methods for masonry structures where, two main types of models can be identified: discontinuum models (also called micro-models), whose units and interfaces (and mortar if it exists) are represented individually, and continuum models (or macro-models), in which masonry is represented by a homogeneous continuum that integrates units, mortar and interfaces in a continuous material.
According to this, the new method to find failure load of masonry arches uses a discontinuous model (micro-model), built from the precise geometry of each voussoir obtained by photogrammetry of deformed masonry arches. The interfaces are in direct contact between the units of stone with no mortar in the joints, and they do not transmit tension. The failure load can be estimated from the load-displacement diagram (or separation between voussoirs), which can be obtained by varying the loads in an iterative process by determining the peak load. In each voussoir and for each load level analysed, a finite element discretisation is performed, and the stress distribution inside and at the interfaces is obtained.
4.1 Mechanical modelling
The geometric model was generated by photogrammetry. The methodology for the creation of the 3D model was explained in section 1 for Cernadela Bridge. As main result of the photogrammetric process, a CAD wireframe model was obtained where each voussoir was separated as an individual unit. Each voussoir was exported to STEP format in order to be subsequently imported into the mechanical design software (Catia V5). The solid model of each voussoir was generated independently while considering the width defined for the calculated arch ring. The complete model of the arch was formed by assembling all its individual voussoirs and defining the material properties and constrains at the contact interfaces.
The stress and strain analysis by FEM was performed in the module 'Generative Structural Analysis' of Catia V5. The contact between voussoirs was modelled with constraints that only allowed the transmission of compressive stress (with infinite compressive strength of masonry); not sliding between voussoirs; no tensile strength at voussoirs interfaces; masonry deforms elastically; not fill at joins; and arch ductile behaviour under monotonic load variation is assumed.
Each individual model voussoir is discretised into finite elements. Generally, 10-node parabolic tetrahedrons have been used. The analysis module allows three degrees of freedom (translation) per node, which reduces the computing time at the expense of somewhat reducing the calculation accuracy (stresses and strains in the voussoirs). Contact defined between voussoirs allows connection of a finite element mesh node with the face of a contiguous element.
4.2 Estimation of failure load
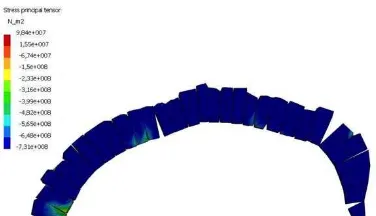
Figure 8 shows a micro-model of an arch geometrically modelled by photogrammetry converted into a FEM. This model represents the distribution of stress after the structural analysis with hinges formation.
Figure 8. Distribution of stress and aperture of hinges during the formation of the mechanism of collapse of the arch under study.
4.3 Estimation of non-visible voussoirs thickness
Even the potentiality of the realistic and accurate geometric models obtained by photogrammetry and laser scanning, there is still an important limitation when using that information for structural modelling: the knowledge of properties of inner materials.
It is clearly demonstrated the importance of voussoirs thickness into the stability of masonry arch bridges, but, as expected, conventional geomatic methods do not allow this parameter to be measured of non-visible areas. One of the most demanded parameters by structural engineers is the arch thickness at the central part of the vaults, so the last experience that is presented here, tackles the creation of integral 3D models built with photogrammetric 3D models of visible faces of vaults and information about voussoir’s thickness at the central part of the vaults by Ground Penetrating Radar.
The main steps of the proposed methodology are summarized in: first, defining the global bridge geometry, and each particular arch in detail. For data acquisition, a network of convergent images was designed. In such configuration the configuration of masonry blocks is registered from different points of view with optimum convergent angles of 90º between cameras and object’s points so the field of view and accuracy of the model is optimized.
The orientation of photographs is achieved after identifying an transfer a minimum number of common points between homologous images. Those points may be natural marks or artificial targets for the orientation of models, but for the present method a number of organized control points were placed on the intrados surface of the vault in order to fix the trajectory of the antennas during GPR data acquisition so this way this trajectory (and subsequent GPR profiles (perpendicular to intrados surface)) could be registered with the global 3D model generated by photogrammetry in the same coordinate system.
GPR is a geophysical method that produces an overall qualitative internal image and provides a higher penetration depth than optical methods. Data were collected around the internal surface of the arch vault (intrados) using 800 MHz antennas. The depth of penetration with the 800 MHz antenna is only 3 meters, but it provides much higher spatial resolution (approximately 4.5 cm) than other antennas with higher depth or penetration. Spatial resolution is the most important parameter to be considered for the correct estimation of voussoir’s thickness. Several parallel profiles were gathered in the longitudinal direction to the bridge structure, through the entire vault intrados surface. The 800 MHz profiles were carried out using a 1 cm trace-interval with a 54 ns time window and 554 samples per trace, and an odometer wheel is attached to the antenna so the profile length can be measured. Having into account the irregularities of masonry fabric, this length was corrected with the coordinates of control points that define the GPR trajectory. All the collected radargrams were consequently corrected for topography considering the precise arch geometry provided by photogrammetric methods.
Figure 9 shows a processed radargram (after topographic correction) where the interface between voussoirs and next material layer is clearly identified.
Figure 9. Processed radargram of first arch of Cernadela Bridge
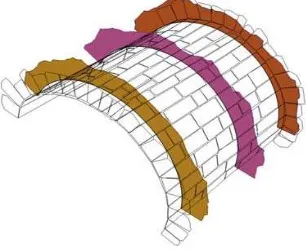
The integral model of the same vault of Cernadela bridge is shown in Fig. 10. In this figure, visible contours were accurately measured by photogrammetry and the profiles for arch thickness were estimated after processing the GPR data.
Figure 10. 3D model of one of the vaults of Cernadela Bridge: visible contours acquired by photogrammetry and voussoir’s
thickness at inner parts of the vault by GPR.
Thanks to this method it was possible to identify a smaller thickness at the central parts of the vault (compared with vault ends) so the structural analysis could be more accurately done, but, above all, in a safer manner.
5. CONCLUSIONS
Finally, we can conclude that through this group of different application cases, both 3D models and 2D representations produced by geomatic techniques (photogrammetry and laser scanning) were adapted for its implementation in structural calculations and routine inspection tools.
Additionally, they were also integrated with non-visible information obtained by geophysical prospection, particularly by means of using remote sensing equipment such as ground penetrating radar technology.
This group of experiences validate the employment of geomatics in the complex field of structural engineering since the outcomes produced can be used for direct structural evaluation and, consequently, provide a diagnosis of the current state of this kind of structures.
These experiences demonstrates that geomatic is a powerful tool that can successfully improve the task of structural evaluation and diagnosis of build up structures, but the main aspect that deserves to be mention is the performance of more accurate but,
above all, safer studies of condition state, that will consequently benefit the civil service of such constructions.
ACKNOWLEDGMENTS
This study was supported by research grants from the Spanish Ministry of Economy and Competitiveness and the Spanish Centre for Technological and Industrial Development (Grants No. BIA2009-08012 and No. IDI-20101770).
6. REFERENCES
References from journals:
Drosopoulos, GA, Stavroulakis, GE, Massalas, CV. 2008. Limit Analysis of a Single Span Masonry Bridge with Unilateral Frictional Contact Interfaces, Engineering Structures, 28 pp. 1864-1873.
Hawk, H.&Small, E. P. 1998. The BRIDGIT bridge management system. Structural Engineering International,
IABSE, 8, 309–14.
Heyman J. 1969. The safety of masonry arches. International
Journal of Mechanical Sciences 11 pp.363-385.
Huerta S. The analysis of masonry architecture: A historical approach. 2008. Architectural Science Review 51(4) pp.297-328.
Livesley, RK. 1978. Limit analysis of structures formed from rigid blocks, International Journal of Numerical Methods in
Engineering, 12 pp.1853-1871.
Oliveira DV, Lourenço PB, Lemos C. 2010. Geometric issues and ultímate load capacity of masonry arch bridges from the northwest Iberian Peninsula. Engineering Structures;
32(12): 3955-3965.
Riveiro B, Morer P, Arias P, De Arteaga I. (2011a)Terrestrial laser scanning and limit analysis of masonry arch bridges.
Construction and building materials 2011; 25(4), p.
1726-1735.
Thompson, P. D., Small, E. P., Johnson, M. & Marshall, A. R. (1998), The Pontis bridge management system. Structural
Engineering International, IABSE, 8, 303–8
References from Other Literature:
Gilbert, M. 1998. On the analysis of multi-ring brickwork arch bridges, Proccedings of the 2nd
International Arch Bridges Conference, Venice, pp. 109-118.
Riveiro, B.; Arias, P. Armesto, J.; Rial, F.I.; Solla, M. 2008. Multidisciplinar Approach to Historic Arch Bridges Documentation. The International Archives of the Photogrammetry, Remote Sensing and Spatial Information Sciences. Beijing, China, Vol. XXXVII. Part B5. pp. 247-252.