COASTAL SEDIMENT MONITORING BY SPECTRAL ANALYSIS
W. Muttitanon
Faculty of Engineering, Mahidol University, Thailand [email protected]
Commission VI, WG VI/4
KEY WORDS: Suspended, Band Math, Band Ratio, Sediment, Turbidity Reflectance
ABSTRACT:
Water monitoring is important to environment control and ecosystem studies which not only scientifically relevant but also legally binding in several countries. Suspended sediment concentration is one of the main parameters for the water monitoring and can be roughly detected from satellite. In the present study, the Chao Phraya River mouth was used as a case study to assess the suspended measuring using water quality index with Landsat TM imagery. A turbidity map was obtain by applying band math and convert to turbidity backscattering. This solution can be used for water quality index and applying with all satellite data.
1. INTRODUCTION
Water quality of the coastal is a very significant factor for sea monitoring. Many animals live in areas close to the coastline because the principal volume of nutrients is found in these areas. Coastal waters are composed of salt water, particles, living animals, dissolve organic matter, suspended sediments. All these are named suspended material (SM). The suspended sediment and dissolves organic matter can affect detect by changing the scattering and absorption properties of water (Fiuza Borges et al, 2011). Many factors such as suspended particle size, shape and color can have large influences on spectral properties of water. Remote sensing can be used to monitor the occurrence and estimate the concentration of algae. Satellite Remote sensing data, which are a useful source of information and provides timely and widespread coverage of any specific areas, have demonstrated useful in assessing the natural resources and monitoring the land use and land cover (Muttitanon and Tripathi, 2005). Remote sensing can be applied to water bodies because energy is absorbed, as well as reflected by water. The reflectance properties of water are a function of the water and the material in the water (organic and/or inorganic material). If the water has a large amount of suspended sediment present, than a higher visible reflectance result compared to clearer waters. Turbulent water will also affect the amount of energy absorbed and transmitted. The amount of chlorophyll will also affect the amount of water reflectance. An increase in chlorophyll will result in a decrease of blue wavelengths and increase in green wavelengths. Base on the complexity of water properties there is no universal algorithm to determine suspended material in water. The spectral response pattern of the suspended materials is distinguished on the image. (Lillesand and Kiefer, 1979)
2. MATERIAL AND METHOD
2.1 Study site
The area of study covers Chao Phraya river mouth. It is located in the Central of Thailand, whose sediments travel from north to the river mouth by Chao Phraya River. Deposited sediments alter the estuary and coastal properties, especially high suspended sediment concentration in the Chao Phraya river mouth (Cheevaporn and Menasveta, 2003). Besides the ocean, the other water area is also found as swamps, paddy field, salt field and agriculture farming. All water area can be applied to water body.
2.2 Data used
Landsat 5 Thematic Mapper (TM) data, path 129 row 51 was used in this study. A near infrared band (band 4; 0.76– 0.90 mm) and a short-wave infrared band (band 5; 1.55-1.75 mm) were extracted from original TM data sets because of their vegetation/land cover characterization. Topographic maps from RTSD (Royal Thai Survey Department) at 1:50,000 were used as reference.
2.3 Water sampling
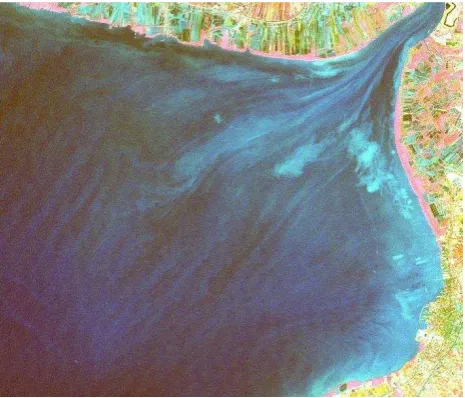
The Landsat TM images were georeferenced to the digitized map at 1:50,000 map scale from Royal Thai Survey Department of the corresponding area using first-order polynomial transformation and nearest neighborhood resampling in Figure 1.
The International Archives of the Photogrammetry, Remote Sensing and Spatial Information Sciences, Volume XL-8, 2014 ISPRS Technical Commission VIII Symposium, 09 – 12 December 2014, Hyderabad, India
This contribution has been peer-reviewed.
Figure 1. The Landsat TM image: 4:3:2 (RGB)
2.4.2 Band Math
The Landsat TM satellite images are converted to the top-of atmosphere (TOA) reflectance, and then corrected for Rayleigh scattering and molecular absorption, In a previous work, a simple aerosol and glint correction procedure by subtracting the reflectance of the near-infrared (NIR) band from the visible bands. This process assumed that the water was dark in the NIR band. But, this hypothesis was not useable in inland and near-shore coastal waters with great turbidity due to scattering by suspended sediment in the NIR band. The reflectance in short-wave infrared (SWIR) band to implement atmospheric correction. After correction for atmospheric effects and surface glints. The water reflectance is converted to the reflectance. The reflectance is related to the absorption coefficient ai and backscattering coefficient bbi at the i-th spectral band by the expression
��≈ � + � �� �� (1)
where the parameter �� is
��= ��
� + �� (2)
and values suggested for great scattering waters for the two coefficients in (1) are used, i.e. � ≈ . 4, � ≈ . (Lee et.al, 1999). The backscattering coefficient at the NIR band can be calculated using the equations (1,2) and the NIR backscattering coefficient due to suspended particles can be acquired by detracting away the backscattering coefficient due to pure water. The absorption coefficient of water is estimated by that of water at the NIR band in Figure 2. The water turbidity value usually measured in the
Nephelometric Turbidity Units (NTU) and the
concentration of total suspended sediment (TSS), laboratory controlled experiments were achieved using suspensions of turbid particles in a water tank. Turbidity backscattering coefficient was taken from the reflectance
measurements and compare with the NTU and TSS. An NTU meter was used to measure the water turbidity and a spectroradiometer was used to measure the water reflectance. The relations obtained were applied to the Landsat TM satellite measurements to obtain a turbidity map in coastal
Figure 2. The turbidity map
2.4.3 Field verification
A field check or accuracy test was conducted in November 2012 on random sample sites. 20 random sites were selected to cover variety of changes that took place in the study.
3. RESULTS AND CONCLUSION
3.1 Results
The relationship between NTU and turbidity backscattering, 20 samplings were investigated and plotted in Figure 3. The correlation gave R2 as 0.8741.
Figure 3. Correlation between turbidity backscattering and NTU
y = 0.0183x - 0.1629
The International Archives of the Photogrammetry, Remote Sensing and Spatial Information Sciences, Volume XL-8, 2014 ISPRS Technical Commission VIII Symposium, 09 – 12 December 2014, Hyderabad, India
This contribution has been peer-reviewed.
3.2 Conclusion
The correlation of turbidity and NTU were found in linear related. On this result indicated the turbidity map those from satellite data are able to apply to observing the water turbidity which is an indicator of water quality index by using band math/band ratio equation.
REFERENCES
Cheevaporn, V. and Menasveta, P. 2003. Water pollution and habitat degradation in the Gulf of Thailand. Marine Pollution Bulletin, 47, pp. 43-51.
Fiuza B. et al, 2011. Detection of suspended sediments in Grande River and Ondas River-Bahia/Brazil, Federal University of Bahia Institute of Environment Sciences and Sustainable Developments, Brazil.
Lee, Z.P., et al, 1999, Hyperspectral remote sensing for shallow waters: 2. Deriving bottom depths and water properties by optimization, Applied Optics, 38, 18, pp. 3831-3843.
Lillesand, T.M. and Kiefer, R.W., 1994, Remote Sensing and Image Interpretation, 3rd Ed., John Wiley and Sons,
Inc.: Toronto.
Muttitanon, W. and Tripathi, N.K., 2005, Land use/land cover changed in the coastal zone of Ban Don Bay, Thailand using Landsat 5 TM data, International Journal of Remote Sensing, 26(11), pp. 2311-2323.
The International Archives of the Photogrammetry, Remote Sensing and Spatial Information Sciences, Volume XL-8, 2014 ISPRS Technical Commission VIII Symposium, 09 – 12 December 2014, Hyderabad, India
This contribution has been peer-reviewed.