STATISTICAL BUILDING ROOF RECONSTRUCTION FROM WORLDVIEW-2
STEREO IMAGERY
T. Partovi a, *, H. Huang b, T. Krauß a, H. Mayerb, P. Reinartz a
a Remote Sensing Technology Institute (IMF), German Aerospace Center (DLR), 82234 Wessling, Germany-
{tahmineh.partovi, thomas.krauß, peter.reinartz}@dlr.de
b Institute of Applied Computer Science, Bundeswehr University Munich, 85577 Neubiberg, Germany- {hai.huang,
helmut.mayer}@unibw.de
Commission III, WG III/4
KEY WORDS: Building Roof Reconstruction, DEM, Statistical Approach, Urban Area, Worldview-2 Imagery
ABSTRACT:
3D building reconstruction from point clouds is an active research topic in remote sensing, photogrammetry and computer vision. Most of the prior research has been done on 3D building reconstruction from LiDAR data which means high resolution and dense data. The interest of this work is 3D building reconstruction from Digital Surface Models (DSM) of stereo image matching of space borne satellite data which cover larger areas than LiDAR datasets in one data acquisition step and can be used also for remote regions. The challenging problem is the noise of this data because of low resolution and matching errors. In this paper, a top-down and bottom-up method is developed to find building roof models which exhibit the optimum fit to the point clouds of the DSM. In the bottom up step of this hybrid method, the building mask and roof components such as ridge lines are extracted. In addition, in order to reduce the computational complexity and search space, roofs are classified to pitched and flat roofs as well. Ridge lines are utilized to estimate the roof primitives from a building library such as width, length, positions and orientation. Thereafter, a top-down approach based on Markov Chain Monte Carlo and simulated annealing is applied to optimize roof parameters in an iterative manner by stochastic sampling and minimizing the average of Euclidean distance between point cloud and model surface as fitness function. Experiments are performed on two areas of Munich city which include three roof types (hipped, gable and flat roofs). The results show the efficiency of this method in even for this type of noisy datasets.
* Corresponding author.
1. INTRODUCTION
Automatic generation of 3D building models is an essential pre-requisite in a wide variety of applications such as tourism, urban planning and automatic navigation. Although over the last decades, many approaches of building detection and reconstruction from 3D point clouds and high resolution aerial images have been reported. The fully 3D building reconstruction is still a challenging issue due to the complexity of urban scenes. There are basically two strategies for building roof reconstruction: bottom-up/data-driven and top-down/model-driven methods. The bottom-up methods (e.g. region growing (Rottensteiner and Briese, 2003), Hough transform (Vosselman and Dijkman, 2001), RANSAC (Tarsha-Kurdi et al., 2008)) extract roof planes and other geometrical information from the point clouds. For roof reconstruction, the corresponding planes are assembled and vertices, ridges and eaves are determined (Sohn and Huang, 2008). Sampath and Shan (2010) used a bottom-up approach to segment the LiDAR points to planar and non-planar planes using eigenvalues of the covariance matrix in a small neighborhood. Then, the normal vectors of planar points are clustered by fuzzy k-means clustering. Afterwards, an adjacency matrix is considered to obtain the breaklines and roof vertices of corresponding planes. This method is used for reconstruction of moderately complex buildings. Rottensteiner et al. (2005), presents an algorithm to delineate building roof boundaries from LIDAR data with high level of detail. In this method, roof planes are initially extracted
by region growing segmentation based upon surface normal vectors of a digital surface model. Then, in order to reduce user-defined thresholds in the procedure of step edge detection and increasing the robustness of the method, statistical reasoning about geometrical relations between neighboring entities (homogeneous co-ordinates and variance-covariance matrices of these coordinate) is taking into account. In addition, the effect of occluded parts of roof polygons is eliminated by considering domain specific information.
The top-down methods use pre-defined parameterized roof models to fit optimum models to the given point cloud, where the quality of the fitness is evaluated by a cost function. Kada and McKinley (2009) proposed a 2D partitioning algorithm that splits the building’s footprint into the non-intersecting and quadrangular cells. The shape of roof in each cell is detected by the directions of normal vectors. Lafarge (2010) used a structural approach to reconstruct 3D building models from DSM of satellite imagery using rectangular building footprints. The simple urban structures are extracted from the library of 3D parametric block and assembled. Then, they are controlled by stochastic Gibbs models. A Bayesian decision finds the optimal configuration of 3D-blockes using a Monte Carlo sampler. Huang et al., (2013) developed top-down combined with bottom-up approaches to reconstruct 3D building models from LiDAR points cloud. Based on a pre-defined primitive library, a generative statistical modelling is conducted to reconstruct roof models. Selection of roof primitives and sampling of their The International Archives of the Photogrammetry, Remote Sensing and Spatial Information Sciences, Volume XL-3/W2, 2015
parameters are driven by the Reversible Jump Markov Chain Monte Carlo (RJMCMC) technique.
Airborne and terrestrial laser scanner data are widely used in state of the art approaches for building reconstruction due to having high accuracy and density. Overviews are given by (Haala and Kada (2010) and Brenner (2005)). Currently, due to the improvement in spatial resolution of satellite imagery and the launching of numerous satellites there is an arising interest in developing algorithms for 3D point cloud generation by stereo satellite image matching. Although the accuracy of the 3D point clouds from satellite images is generally lower than that of LiDAR data, we assume that they are still sufficient for building recognition and reconstruction. Therefore the challenge is to achieve plausible results from such relatively low quality data.
The existing noise in the point cloud data which generated from satellites imagery causes difficulties in the computation of the geometrical features, e.g., normal vectors based on information of neighboring points. Thus, bottom-up methods, e.g., finding roof planes based on the point cloud segmentation, is considered to have low feasibility because of the number of incomplete and irregular roof planes which need geometric constraints to reconstruct plausible roofs.
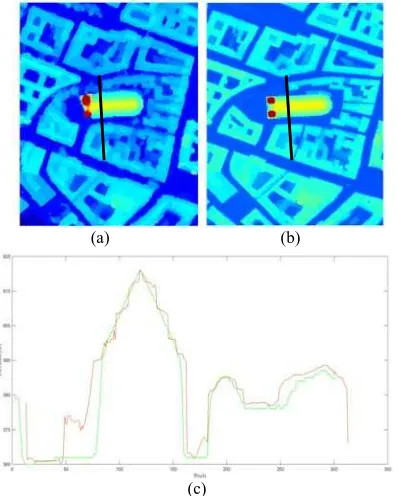
The quality of DSM from satellite imagery is compared visually with LiDAR-DSM, which are also used as reference data. Figure 1 shows elevation profiles for DSM of WorldView-2 and DSM of LiDAR data. In figure 1 (c) red colour represents DSM from satellite image and green colour represents DSM of LiDAR point clouds for a selected profile (black line) in figure 1 (a) and (b).
Figure 1. Comparison for profiles of buildings in two datasets: (a) WorldView-2-DSM, (b) LiDAR-DSM and (c) elevation profiles reconstructed from imagery (red) and LiDAR (green)
In this paper, a top-down method is developed to find building roofs which exhibit the optimum fit to the point clouds of Digital Surface Model (DSM) from satellite images. The DSM is generated from Digital Globes’ WordView-2 panchromatic
data, with 0.5 m ground sampling distance, by means of Semi-Global-Matching (SGM) (Hirschmüller 2008, d’Angelo et al. 2008). The selected area for the experimental results is located in Munich city centre.
The goal of this work is to generate Level of Detail 2 (LOD2) models consisting of the basic roof types. For this purpose, first a bottom-up approach is used to detect the building mask. Then, the pitched and flat building roofs are discriminated by means of detection of mean curvature and Gaussian curvature. Afterwards, the ridge lines of pitched roofs are extracted according to the local maximum (of heights) of the DSM in each building mask. Then, a top-down approach is presented for 3D modeling. A primitive library is defined to compose roof models. Using the ridge lines and height values, the roof parameters such as length, width and orientation are initialized. The sampling of primitive parameters is driven by the Markov Chain Monte Carlo (MCMC) technique. A simulated annealing methodology is developed to find the optimum parameters and model which fit to the data iteratively. After reconstruction of the roof primitives, the neighboring primitives are merged according to regularization rules. In this step, a geometrical adjustment is considered to combine the neighboring primitives. Preliminary results on the Munich test dataset show the potential of the proposed approach in dealing with low quality point clouds from satellite imagery. The primitive-based top-down reconstruction achieves plausible models despite data artefacts.
The paper is organized as follows. In section 2, bottom-up efforts including building mask detection, building roof type selection and ridge line extraction are presented. Section 3 introduces the top-down approach consisting of the definition of the roof primitive library and the MCMC sampling using simulated annealing algorithm. Section 4 provides the results for two datasets and discussions. Section 5 presents conclusions and future works.
2. BOTTOM-UP METHOD
In roof modeling, a bottom-up approach may suffer from incomplete and irregular roof parts using noisy data. Geometric constraints can be imposed to ensure plausible results. For large urban scenes, however, the roof complexity as well as the number of parameters is too high. A search within the whole area is time-consuming and cannot guarantee the appropriate results. Therefore an efficient way is to find the balance between bottom-up and top-down methods. The following bottom-up methods are used in order to limit the search space and, thus, reduce the computational complexity for the subsequent top-down reconstruction (Section 3).
2.1 Building Mask Detection
Satellite images of urban scenes contain a wide range of objects such as trees, lawn, buildings, river and road. The proposed work focuses on the detection and reconstruction of buildings.
The DSM is generated from Digital Globes’ WordView-2 data by using SGM. The experimental selected area is Munich city centre, containing large and complex buildings. In order to approximately recognize the location of buildings, first a normalized DSM (nDSM) is utilized which contains only above ground objects to discriminate the ground level objects from the higher level ones. An advanced rule-based fuzzy spectral classification is further applied (Krauss et al., 2012) to distinguish surface classes. In this method, fuzzy rules are (a) (b)
(c)
employed to determine the parameters for spectral classes (vegetation, water, shadow and soil) to classify the objects of pan-sharpened satellite images. Using the nDSM and imposing threshold on these parameters the buildings are separated from other objects like trees and road.
2.2 Roof type classification
Surface curvature is used to recognize the surface type. One way for the computation of surface curvature is based on the detection of curves on the surface. At each point on the surface there is a direction of maximal normal curvature (k )1 and a
direction of minimal normal curvature (k2) for all space curves (Besl and Jain, 1986).Thus, k1 and k2 are computed based on the first and second fundamental forms in local coordinates, respectively. In terms of these principal curvatures, the most important features of surface are Gaussian curvature (K) and mean curvature (H), which can be computed as follows:
2
Surfaces are categorized to the eight types: Peak, Ridge, Flat, Minimal Surface, Pit, Valley, and Saddle Valley depending on the sign combinations of H and K (Table 1).The DSM in the building area is, thereby, classified into flat or pitched roof, according to the sign of H and K.
Table 1. Surface classification based on sign of H and K
2.3 Ridge line extraction
Ridge lines of roofs are of great interest as they indicate the initial values of parameters such as length, width, orientation, and position of the building. The extraction of ridge lines helps to reduce the search space for fitting a model (from a predefined library, cf. Section 3.1) into the points cloud by statistical sampling (Section 3.2).
Ridge lines are determined for pitched roofs and planes are considered for flat roof. For ridge line extraction, three features are used. Local maximum is an important feature to extract the building ridge points. Reconstruction based geodesic dilation operator is used to extract local maximum of the DSM in building areas. For this purpose, this morphological operator dilates a marker image and then masks it by a mask image iteratively (Arefi, 2009). The second feature is ridge points of orthorectified panchromatic image using the canny operator. The third feature is building mask which is generated by method mentioned in section 2.1. These three features are combined and ridge points are extracted roughly. The RANSAC method is used to fit the line to each group of these points. In case of flat roofs, a hypothetical line in the middle of the roof plane is assumed. Evaluation of height values close to the end points of ridge lines results in discriminating gable roofs from hipped roofs. For hipped roofs the changes of the height from
two end points of the ridge line are low and the roof height decreases gradually. For gable roofs, the two end points of the ridge line are followed by a vertical wall (Partovi et al., 2013).
3. TOP-DOWN METHOD
In our top-down approach, a library of primitives is pre-defined and a statistical search based on MCMC with simulated annealing is conducted to sample roof parameters. The generated candidate models are evaluated by comparing them with the input DSM. The goal is to find the optimal combination of parameters for roof model reconstruction.
3.1 Library of roof primitives
In general, the reconstruction strategy is conducted depends on the data resolution. Although the resolution of aerial images is higher, the DSM of stereo satellite image matching is rather noisy even if it has up to 4pt/m2 density. In this work we, employ only five basic roof primitives (flat, shed, gable, hipped and mansard) for the modeling.
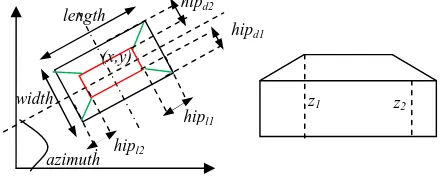
A library of primitives (Figure 2) is the basis of top-down approaches. As mentioned above, we propose a simplified library containing five primitives in two groups with planar shapes and rectangular footprints. Planar roof and rectangular footprints are used not only because they have less shape parameters but also they are basic forms which cover the majority of the buildings in urban area. The parameters of library primitives are defined as:
}
where the parameter space
consists of position parameters }, ,
{x y azimuth
P and contour parameters C{length,width}. Shape parameters ( S ) include ridge/eave height and the depth of hips. Primitives of library consist of two groups (F) and (H). Group F includes shed and flat roof and group H consist of all variants of pitched roofs such as gable roof, hipped roof and mansard roof. The roof components such as vertices, edges and facets and their relationships are determined from the parameters of primitives. Then, these roof features are used for primitive merging, calculating reconstruction errors and extracting building footprints (Huang and et al, 2011).
(1)
Figure 2. The library of roof primitives
3.2 Statistical building roof modeling
3.2.1 MCMC: MCMC is a class of stochastic sampling techniques which is efficient for data evaluation in high-dimensional solution spaces (Green, 1995). In the proposed method, the numbers of primitive parameters are considered fixed for each type of roof. In each iteration, the proposed candidate model is evaluated by the cost function evaluating to receive the highest quality of fit for the roof model to the data. The cost function computes the deviation from the points to their corresponding facet of roof. The MCMC search ends when the deviation converges and the candidate model is accepted if the deviation is lower than a predefined threshold. In the proposed work, ridge line extraction (cf. Section 2.3) speeds up the MCMC search and improves the efficiency and robustness.
3.2.2 Simulated annealing: Within the developed methodology, simulated annealing is used for an important variant of MCMC algorithm to solve the global optimization problem to avoid local minimum. In this work, simulated annealing is searching for a minimum of the cost function by ‘cooling the temperature’ slowly. The cost function E is defined by the summation of the orthogonal distances of the 3D DSM points to the candidate roof model, 2D horizontal distances of the point cloud to the boundary of the building mask and the number of points covered within each building model. Each function Fi has identical weight wi in computation procedure.
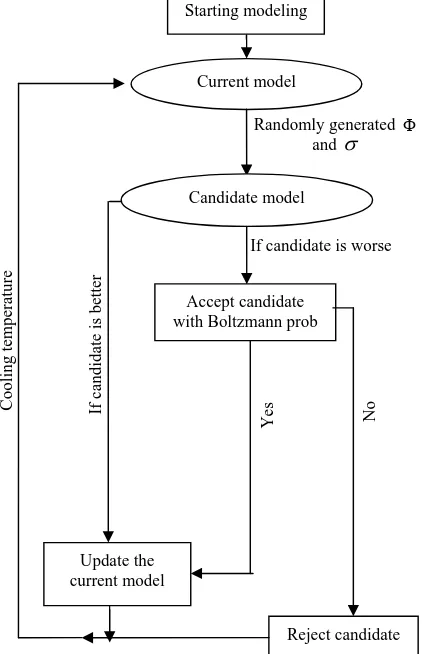
In this fashion, first the cost function is computed with initial parameters. Each roof type is parameterized according to the library and these parameters are sampled using normal distributions. In each step, the cost function of current value is compared with the previous minimum value. If it is lower than the latter, the latter will be updated. In the other case, it may still be accepted according to the Boltzmann probability.
Boltzmann equation of simulated annealing is presented as below (Parkinson and et al., 2013):
)
where, P is the probability that a higher cost function value, i.e., a worse candidate, to be accepted. E is the cost function difference between the current value and the previous minimum value. T is a temperature and Eavg is the running average value of the E . This equation means if the energy of the cost function value increase, the probability of accepting of that gets smaller. Furthermore, in the simulated annealing algorithm reducing the ‘temperature’ gradually leads to decreasing the probability of accepting worse candidates in the search. The flowchart of the proposed simulated annealing scheme is shown in Figure 3.
Figure 3. Simulated algorithm for roof parameters selection
The search is conducted until the convergence criterion is reached, i.e., the difference between two sequential cost values is less than a given threshold (0.2) in a certain period (100 iterations).
4. EXPERIMENTS AND DISCUSSION Experiments are performed on WorldView-2 stereo image data for urban areas in Munich, Germany.
(3)
If candidate is worse
Accept candidate
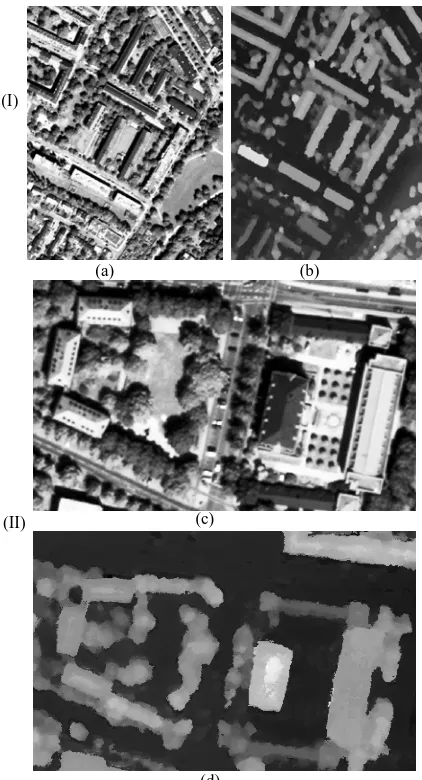
The resolutions of panchromatic images and reconstructed DSM are 0.5 m. In the figure 4, DSMs for two test areas are shown.
Figure 4. Test dataset of areas I and II. (a) and (c) orthorectified pansharpened images. (b) and (d) DSM.
4.1 Roof type classification
Mean curvature and Gaussian curvature are important curvature features which can be used to classify the surface. In this work, we take advantage of these features for distinguishing pitched roofs from flat roofs in the urban areas. In the procedure of building mask generation, some buildings are excluded based on height threshold. Then, the classification is only applied on the remaining building roofs. Also complex roofs are not covered in this work. Figure 5 shows the pitched roof by red and flat roof by white color.
Figure 5. Roof type classification for areas I and II: reference images (a),(c) from © Google Maps and the classification
results (b),(d).
A quality assessment is manually performed by comparing the classified roof and the reference images. In the proposed method for area I, 12 roofs from 16 roofs and for area II, 3 roofs from 5 roofs are classified correctly.
4.2 Ridge lines extraction
In order to initialize the roof primitives’ parameters, ridge lines of individual building parts are extracted. Roof primitives’ parameters consist of width, length, orientation, centroid, lateral and longitudinal hip. Lateral hip is almost half of the width because all roofs are considered symmetric. Longitudinal hip is computed based upon distance between end point of ridge line and end point of mask in direction of ridgeline. Figure 6 illustrates that these parameters are computed by ridge line (green lines), extended line (blue lines) and extracted points in perpendicular direction of the ridge line (red lines) in the mask area.
(a) (b)
(c)
(d) (I)
(a) (b)
(c)
(d) (II)
Figure 6. Extracted ridge lines and roof parameters
4.3 Roof reconstruction
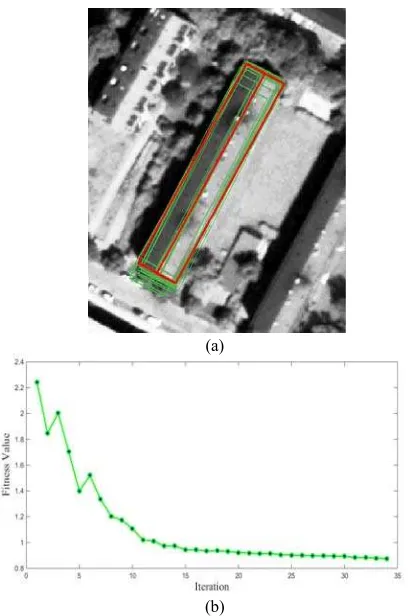
A primitive library is pre-defined to compose roof models that fit the data. Using the ridge lines and height values, the roof parameters such as length, width and orientation are initialized as shown in the previous section. The sampling of primitive parameters is driven by the MCMC technique with simulated annealing scheme. An example of a reconstruction process is presented in Figure 7(a) showing intermediate candidate models (green) during the statistical search. The final optimum building model is indicated in red color. Figure 7(b) shows the convergence of the fitness value.
Figure 7. Statistical roof reconstruction: (a) search of optimum model (red) and (b) the convergence of cost function
Figure 8 presents the final reconstruction results in the two test areas in the forms of projection on DSM (top) and 3D model (bottom).
Figure 8. Reconstruction results of the areas I (a, b) and II (c, d). Flat roofs and pitched roofs are shown in purple and green
color, respectively.
The experiments demonstrate the potential of the proposed method to deal with the challenges of using satellite image data for urban scenes, i.e., (1) relatively low data resolution, (2) high noise in the reconstructed DSM and (3) the occlusion through trees in dense urban area. Several buildings, however, have not been correctly classified and reconstructed. (Figure 5, highlighted building with red color). In addition, in Figure 5 (c) the highlighted building with yellow color could not be (a)
(b)
(b)
(c)
(d) (a)
classified correctly due to having a complex shape and a prismatic model has been considered to reconstruct it. Problematic are mostly small buildings with adjacent trees, where the data noise has a larger influence on the stability of reconstruction.
5. CONCLUSION
In this paper a hybrid method is proposed based on top-down and bottom-up strategies. This method finds the roofs optimally fitting the DSM derived from stereo satellite images. The satellite data derived DSM has low quality in comparison with LiDAR data and DSM from aerial images. In a bottom-up approach building roof types are firstly classified to pitched and flat roofs. Ridge lines are extracted and roof primitives’ parameters are initialized according to the extracted ridge lines. In the proposed scheme, the results of bottom-up approaches help to speed up the following top-down step and improve the efficiency and robustness. In the top-down approach, first a primitives library is defined, which contains the five most popular roof types (flat, shed, gable, hipped and mansard roofs). MCMC with simulated annealing is applied for the sampling of parameters until a stop criterion is fulfilled. For each iteration the average of Euclidean distances between model and points clouds with the number of mask points inside the model is computed as fitness function. Fitness values are compared between two sequential iterations. If the fitness values of further iterations do not show any more changes, the algorithm is stopped. The experimental results in two datasets of Munich city prove the potential of the proposed algorithm in dealing with noisy and low quality DSM of satellite data.
For the future work, model selection methods can be improved to distinguish the roof types automatically and will be integrated into the statistical search process. The proposed method can be extended for complex roofs by enriching the primitive library and conducting primitive merging.
REFERENCES
Arefi., 2009. From LiDAR points to 3D building models. Institute for Applied computer science, PhD Thesis.
Besl, P. and McKay, N., 1992. A method for registration of 3-d shapes, Pattern Analysis and Machine Intelligence 14(2), 239 – 256.
Brenner, C., 2005. Building reconstruction from images and laser scanning. International Journal of Applied Earth Observation and Geoinformation, Theme Issue on Data Quality in Earth Observation Techniques 6 (3–4), 187–198.
d’Angelo, P., Lehner, M., Krauss, T., Hoja, D. and Reinartz, P., 2008. Towards automated dem generation from high resolution stereo satellite images. IAPRS XXXVII (B4), pp. 1137–1342.
Green, P., 1995. Reversible jump Markov chain Monte Carlo computation and Bayesian model determination. Biometrika 82, pp. 711–732.
Haala, N., and Kada, M., 2010. An update on automatic 3D building reconstruction. ISPRS Journal of Photogrammetry and
Remote Sensing, pp. 570-580.
Hirschmuller, H., 2008. Stereo processing by semiglobal matching and mutual information. IEEE Trans. Pattern Anal.
Mach. Intell. 30(2), pp. 328–341.
Huang, H., Brenner, C. and Sester, M., 2013. A generative statistical approach to automatic 3D building roof reconstruction from laser scanning data. ISPRS journal of
photogrammetry and remote sensing, pp. 29-43.
Kada M., and McKinley L., 2009. 3D building reconstruction from LIDAR based on a cell decomposition approach,
International Archives of Photogrammetry, Remote Sensing and
Spatial Information Sciences,38 (Part 3/W4), pp. 47–52
Krauss, T., Sirmacek, B., Arefi, H. and Reinartz, P., 2012. Fusing stereo and multispectral data from worldview-2 for urban modeling. In: Proc. SPIE Defense, Security and Sensing, Vol. 8390, pp. 83901X–83901X–15.
Lafarge, F., Descombes, X., Zerubia, J., and Pierrot-Deseilligny, M., 2010. Structural approach for building reconstruction from a single DSM. IEEE Transactions on
Pattern Analysis and Machine Intelligence 32 (1), 135–147.
Parkinson, A.R., Balling, R., and Hedengren. J.D., 2013. Optimization methods for engineering design, Brigham Young University.
Partovi, T., Arefi, H., Krauß, T., and Reinartz, P., 2013. Automatic model selection for 3D reconstruction of buildings from satellite imagery. ISPRS Archives, XL-1/W, SMPR
Conference Tehran. pp. 315-320.
Rottensteiner F., and Briese C., 2003. Automatic generation of building models from LIDAR data and the integration of aerial images. International Archives of Photogrammetry, Remote
Sensing and Spatial Information Sciences, 34 (Part 3-
W13), pp. 174–180
Rottensteiner, F., Trinder, J., Clode, S., and Kubik, K., 2008. Automated delineation of roof planes in lidar data. The
International Archives of the Photogrammetry, Remote Sensing and Spatial Information Sciences 36 (Part 3/W19), pp. 221–
226.
Sampath, A., and Shan, J., 2010. Segmentation and reconstruction of polyhedral building roofs from aerial lidar point clouds. IEEE Transactions on Geoscience and Remote
Sensing, 48 (3), pp. 1554–1567.
Sohn G., Huang X., and Tao V., 2008. A data-driven method for modelling 3d building objects using a binary space partitioning tree. In: Topographic Laser Ranging and Scanning:
Principles and Processing, CRC Press, Taylor Francis Group,
New York, NY, USA, pp. 479–50.
Tarsha-Kurdi F., Landes T., and Grussenmeyer, P., 2008. Extended RANSAC algorithm for automatic detection of building roof planes from LIDAR data. The Photogrammetric
Journal of Finland, 21 (1), pp. 97–109.
Vosselman G., and Dijkman E., 2001. 3D building model reconstruction from point clouds and ground plans.
International Archives of Photogrammetry, Remote Sensing and Spatial Information Sciences, 34 (Part 3/W4), pp. 37–43.