SATELLITE-BASED DROUGHT MONITORING IN KENYA IN AN OPERATIONAL
SETTING
A. Klisch a, *, C. Atzberger a, L. Luminari b
a University of Natural Resources and Applied Life Sciences (BOKU), Institute of Surveying, Remote Sensing and Land Information (IVFL), Peter-Jordan-Straße 82, 1190 Wien, Austria - (anja.klisch, clement.atzberger)@boku.ac.at
b National Drought Management Authority (NDMA), Lonrho House -Standard Street , Nairobi, Kenya - [email protected]
Commission VI, WG VI/4
KEY WORDS: Drought monitoring, Kenya, Whittaker smoother, MODIS, NDMA, Drought Contingency Funds
ABSTRACT:
The University of Natural Resources and Life Sciences (BOKU) in Vienna (Austria) in cooperation with the National Drought Management Authority (NDMA) in Nairobi (Kenya) has setup an operational processing chain for mapping drought occurrence and strength for the territory of Kenya using the Moderate Resolution Imaging Spectroradiometer (MODIS) NDVI at 250 m ground resolution from 2000 onwards. The processing chain employs a modified Whittaker smoother providing consistent NDVI “Monday-images” in near real-time (NRT) at a 7-daily updating interval. The approach constrains temporally extrapolated NDVI values based on reasonable temporal NDVI paths. Contrary to other competing approaches, the processing chain provides a modelled uncertainty range for each pixel and time step. The uncertainties are calculated by a hindcast analysis of the NRT products against an “optimum” filtering. To detect droughts, the vegetation condition index (VCI) is calculated at pixel level and is spatially aggregated to administrative units. Starting from weekly temporal resolution, the indicator is also aggregated for 1- and 3-monthly intervals considering available uncertainty information. Analysts at NDMA use the spatially/temporally aggregated VCI and basic image products for their monthly bulletins. Based on the provided bio-physical indicators as well as a number of socio-economic indicators, contingency funds are released by NDMA to sustain counties in drought conditions. The paper shows the successful application of the products within NDMA by providing a retrospective analysis applied to droughts in 2006, 2009 and 2011. Some comparisons with alternative products (e.g. FEWS NET, the Famine Early Warning Systems Network) highlight main differences.
1. INTRODUCTION
Drought is a recurrent natural phenomenon in many arid and semi-arid regions of the world. The resulting stress depends primarily on the strength, duration, timing and spatial extent of the dry spell. At the same time, different communities and economic sectors may show varying vulnerabilities and resiliencies to drought events, as available coping strategies and previous (environmental) conditions differ.
For drought-prone countries, it is important to monitor droughts and affected communities to prevent disastrous results. For this purpose, Kenya established in 2011 a National Drought Management Authority (NDMA) which mandate is to exercise general supervision and coordination over all matters relating to drought management in Kenya. In 2014, the NDMA received some Drought Contingency Funds (DCFs) from the European Union to facilitate early response to drought threads. DCFs are disbursed by the NDMA to drought-affected counties in order to implement response activities that can help mitigating the worst impacts of droughts. MODIS satellite images are used to determine the drought status of a county in an objective and reproducible way. For near real-time processing of the data, BOKU University developed and implemented an advanced filtering method for NDVI images. The processing yields reliable drought indicators at county and sub-county levels and for various aggregation times and livelihood zones. Image analysis is complemented at NDMA by field-based (socio-economic) indicators. The innovative DCF disbursement mechanisms of NDMA ensure a timely support of drought-affected counties and communities.
The present paper describes the MODIS processing chain implemented at BOKU. Through comparison with the well-established FEWS NET data, we highlight and quantify main differences between the two datasets.
2. STUDY AREA
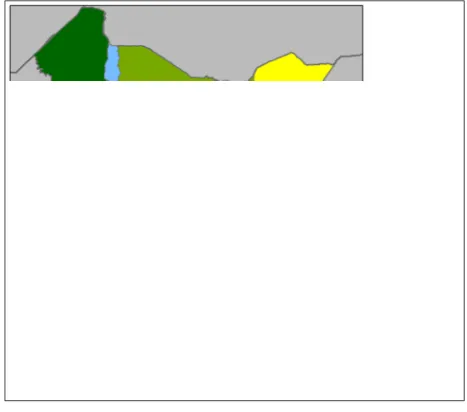
The study covers an area of 10° x 11° centred over Kenya. We focus on the arid and semi-arid land (ASAL) mainly located in the northern and eastern parts of the country (see Figure 1). These areas are characterised by high temperatures (except elevated areas), low rainfall amounts and therefore often relatively low biomass/NDVI. This low biomass is seen in Figure 1 as average annual NDVI ≤0.4 (brownish colour).
3. METHODOLOGY
3.1 Data Processing at BOKU
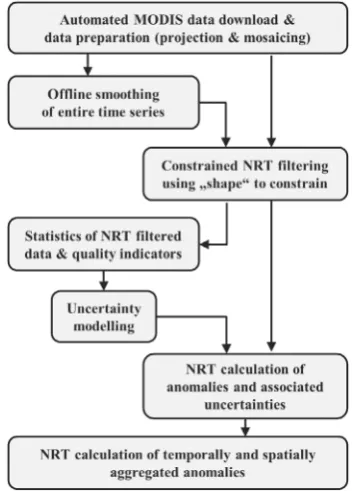
The University of Natural Resources and Life Sciences (BOKU) in cooperation with the National Drought Management Authority (NDMA) has setup an operational processing of MODIS images with the aim of providing consistent NDVI and anomaly “Monday-images” in near real-time (NRT) with a 7-day update interval. The main processing stages are depicted in Figure 2.
Note that tasks shown on the left side are only run once (“offline”), whereas the remaining processes are repeated every week. To ensure a temporally consistent NDVI time series, the weekly processing steps were initiated with the start of the time series.
Figure 1: Average annual NDVI for ASAL counties of Kenya. Non-ASAL counties are shown in grey. The map also shows the
1° x 1° tiling system in which MODIS data is processed
3.1.1 MODIS Data: The NDMA drought indicators are derived from MOD13Q1 and MYD13Q1 NDVI collection 5 products of the MODIS Terra and Aqua satellites from LP DAAC (from 2000 onwards). These products are gridded level-3 data in approximately 250m spatial resolution in Sinusoidal projection with a (combined) temporal resolution of 8 days. The level-3 data are calculated from the level-2G daily surface reflectance gridded data (MOD09 and MYD09 series) using the constrained view angle – maximum value composite (CV-MVC) compositing method (Solano et al., 2010).
Figure 2: Processing chain of BOKU’s near real-time (NRT) filtering of MODIS NDVI time series. The steps on the left side
are done only once. The processes shown on the right side are repeated every week. Together the processing leads to filtered NDVI images with associated uncertainties. Based on this
primary information anomaly indicators are derived and aggregated over time and for different administrative units
3.1.2 Data Acquisition and Preparation: The MODIS data are downloaded, mosaicked and re-projected to geographic coordinates (datum WGS84) with a spatial resolution of approximately 0.002232° (ca. 250 m) using nearest neighbour resampling. The images are cropped to a dedicated tile system (see Figure 1). These steps are performed on a daily basis using the R MODIS package (Mattiuzzi et al., 2012).
3.1.3 NRT Filtering: To minimize the possible impact of undetected clouds and poor atmospheric conditions, a standardized procedure temporally filters the NDVI time series based on two distinct steps: offline smoothing (only once) and near real-time filtering (every week).
The offline smoothing step uses the Whittaker smoother (Eilers, 2003), (Atzberger and Eilers, 2011a) and (Atzberger and Eilers, 2011b). It smoothes and interpolates the data in the historical archive (2000 to 2012) to daily NDVI values. The smoothing takes into account the quality of the data and the compositing day for each pixel and time step based on the MODIS VI quality assessment science dataset (Solano et al., 2010). For a detailed description of the filtering procedure and settings, see (Atzberger et al., 2014). Only every 7th image corresponding to “Mondays” is stored. The 7-day interval reduces the storage load of the archive but permits at the same time an easy restoration of daily data whenever needed. From the smoothed data, weekly statistics are calculated describing the typical NDVI paths for a given location and time. This information serves for “constraining” the Whittaker smoother during the NRT filtering.
The near real-time (NRT) filtering step also uses the Whittaker smoother. However, the filtering is executed every weekend and only uses available observations of the past 175 days. Filtered NDVI images of the successive Monday are stored but also for the past four Mondays, representing different consolidation phases of the filtered NDVI (see Figure 3 “output 0” to “output 4”). Obviously, “output 4” is more reliable (e.g. better constrained through available data) compared to the “output 0” which is always extrapolated as (reliable) MODIS observations become available only after some days.
Figure 3: Principle of BOKU’s constrained near real-time (NRT) filtering. Black asterisks are the observed (raw) MODIS values from 16-day MVC (both Terra and Aqua). The blue line is the fitted curve of the (unconstrained) Whittaker smoother.
The five coloured dots are the final (constrained) “Monday” images, representing different consolidation phases. These “Monday” images are stored every weekend. To constrain these
Note that the missing constraints may lead to arbitrary high or low values, particularly, at times of the year, where rapid NDVI changes take place. Thus, we apply a pixel specific constraining procedure that limits the NDVI change between consecutive “Mondays” according to weekly statistics of the offline-smoothed data. In Figure 3, the effect of the constraining can be seen as the difference between the blue line (the unconstrained Whittaker) and the coloured dots (e.g. the final output that is stored and used for drought mapping).
3.1.4 Calculation of Statistics of NRT Data and Uncertainty Modelling: Saving every weekend the five output NDVI images plus quality information (e.g. number and quality of observations within the 175 days temporal window), allows us to keep a consistent archive of the different consolidation phases. Before starting the operational production of NDMA data, the archived NRT data are compared to a filtered “reference” time series where all observations were available (e.g. central point of the blue curve in Figure 3). The difference between “reference” time series and NRT estimates gives the error of the NRT filtering. We model this error using the stored quality information. In our operational setting, the uncertainty of a pixel filtered in NRT is estimated based on those previously established models. This is done for each output product, pixel and time step in NRT.
3.1.5 Anomalies: From the filtered NDVI data, a weekly vegetation condition index (VCI) is calculated at pixel level (Kogan et al., 2003):
,
, , (1)
where VCIi= vegetation condition index at time step i NDVIi = normalized difference vegetation index
observed at time step i
NDVImin,w, NDVImax,w = lowest / highest 7-day values observed from 2003 to 2012 at week w
Conceptionally, the VCI enhances the inter-annual variations of a vegetation index (e.g. NDVI) in response to weather fluctuations while reducing the impact of ecosystem specific response (e.g. driven by climate, soils, vegetation type and topography). Other anomaly indicators are also calculated (e.g. Z-score) but will not be presented here as NDMA restricts its analysis to VCI.
To get a more concise picture of the vegetation development in the ongoing season and to identify drought-affected areas, we temporally and spatially aggregate the weekly VCI maps. Temporal aggregation includes 1-monthly and 3-monthly weighted VCI averages using the VCI images of the recent 4 and 12 weeks of the according month, respectively. During the temporal aggregation, the modelled uncertainty is taken into account down-weighting the impact of less reliable observations. Spatial aggregation averages the VCI at pixel level according to administrative units (e.g. counties, constituencies of Kenya) and/or livelihood zones. All data are imported at NDMA into SPIRITS (Eerens et al., 2014) for production of seasonal graphs, etc. Additional web-tools were developed by BOKU for educational purposes (BOKU, 2015).
3.2 Comparison with FEWS NET Data
We used for comparison the eMODIS NDVI data provided by the FEWS NET (USGS, 2013). The downloaded FEWS NET
data are pentadal NDVI at 0.002413° spatial resolution (Datum WGS84) covering the area of East Africa.
The eMODIS dataset is generated by the U.S. Geological Survey (USGS) Earth Resources Observation and Science (EROS) Center from the Level 1B MODIS products of Terra (MOD09, MOD03, MOD35_L2) (USGS, 2011). The output includes near real-time and historical NDVI products that are composited in 10-day intervals every 5 days at about 250m spatial resolution. This results in 72 composite periods per year (pentades).
The historical NDVI dataset (2001-2010) is temporally smoothed by USGS with a “modified” weighted least squares linear regression approach (Swets et al., 1999). As current-year composites become available, they are added to the time series and smoothed, resulting in a smoothed composite for a given 10-day period (updated every 5 10-days). The eMODIS data available for download are updated during six composite periods, only after which the images become definitive (USGS, 2013). Hence, the most recent five images are produced using climatological information. For our study, only the consolidated FEWS NET data were used covering the period of 2001 to 2014.
To compare BOKU and FEWS NET datasets, temporally and spatially aggregated VCI anomalies are calculated from the FEWS NET NDVI data. First, NDVI images were cropped and resampled to the BOKU grid. Pentadal statistics (minimum, maximum) of the NDVI were derived for each pixel and the period of 2003 to 2012 similar to the BOKU dataset (see section 3.1.4). Next, pentadal VCI images were calculated using the derived statistics (Equation 1). Temporally aggregated VCI images (1 and 3 month) were obtained by averaging 6 and 18 pentades, respectively. Finally the spatial aggregation was conducted in the same way as for the BOKU data. It has to be noted that the FEWS NET indicators derived in this way, are not available in near real-time, but only after six pentades (e.g. one month). This contrasts with the NDMA data, which are derived in NRT.
4. RESULTS AND DISCUSSION
In this section, we focus on 3-monthly VCI data (VCI3M) aggregated at county level and provided on a monthly basis. The VCI3M anomalies are compared with FEWS NET anomalies. Both datasets are evaluated against food security assessment reports.
The linear regression between 3-monthly VCI datasets from BOKU and FEWS NET shows generally a good agreement between both datasets with a coefficient of determination (R²) of 0.89 (see Figure 4). The VCI observations regularly scatter around the 1-to-1 line with a slope close to one and a (slight) positive intercept. As expected, the majority of the points (highest density, dark red points) are found in the range of 30% and 55% corresponding to near “normal” conditions. The majority of observations (88%) fall well within a range of ± 10%.
Despite the generally good agreement between the two VCI datasets, larger differences appear if the analysis is repeated month-by-month. The resulting intra-annual coefficient of determination (R²) varies between 0.77 and 0.94 (see Figure 5 – green line). Local minima of R² (and maxima of RMSE) are visible in April and November. This coincides very well with Kenya’s long and short rains that normally occur in March–June and October–December.
Figure 4: Scatterplot of 3-monthly aggregated VCI (VCI3M) derived from FEWS NET and BOKU datasets of ASAL counties across all months between 2003 and 2014. 1-to-1 line
(red) and regression line (black)
The two seasons are captured by the average monthly NDVI profile derived from the weekly NDVI values between 2003 and 2012 for all ASAL pixels (orange line in Figure 5). Obviously, the largest differences in the VCI3M anomalies occur in parallel to significant NDVI changes - these are periods of prime interest for image interpreters and NDMA.
The inter-annual agreement/disagreement between the two datasets is depicted in Figure 6. Results show some variability from year to year. Interestingly, the RMSE slightly drops down to local minima for the years of 2005, 2009 and 2011. According to assessment reports of the Kenya Food Security Steering Group (KFSSG, 2005), (KFSSG, 2006), (KFSSG, 2011a) and (KFSSG, 2011b), the years 2005 and 2011 coincide well with major droughts. In 2009, a poor performance of the long rains was reported (KFSSG, 2009b). Consequently, our current assumption is (to be validated) that the two datasets show a better agreement in years with (extreme) droughts.
Figure 5: Intra-annual agreement/disagreement between monthly updated FEWS NET and BOKU VCI3M values. (green) coefficient of determination (R²), (blue) root mean square error (RMSE) between the two data sets. In (orange) time course of the average NDVI of ASAL counties. Lines are
only shown for reader's convenience
Figure 6: Inter-annual agreement/disagreement between monthly FEWS NET and BOKU VCI3M values. (green) coefficient of determination (R²), (blue) root mean square error
(RMSE). Lines areonly shown for reader's convenience
The spatial variation of RMSE for the ASAL counties is shown in Figure 7. The RMSE values were calculated across all months and years of the two datasets. The resulting RMSE ranges between 4% and 9% and show some spatial coherence. Large arid counties (e.g. Turkana, Marsabit, Wajir) as well as southwestern semi-arid counties (e.g. Narok, Kajiado) show a relatively good agreement between the FEWS NET and BOKU anomalies (see Figure 7, green and dark-green).
Largest variations occur in the centre (e.g. Kitui) as well as in Mandera. Although the counties seem to build spatial groups, no obvious relation to aridity can be seen.
To further reveal county-specific differences, we prepared a detailed analysis for the counties of Laikipia, Mandera and Kitui. Laikipia represents a semi-arid county with a very good agreement (low RMSE), whereas Mandera belongs to the arid counties exhibiting medium RMSE values. Kitui is again semi-arid, but shows larger RMSE values of slightly more than 7%. All counties experienced major droughts during the period of 2003 and 2014. We employ matrix plots to display the monthly
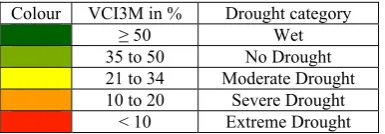
Colour VCI3M in % Drought category
≥ 50 Wet
35 to 50 No Drought 21 to 34 Moderate Drought 10 to 20 Severe Drought
< 10 Extreme Drought
Table 1: Thresholds for monthly updated VCI3M and related drought categories
VCI3M anomalies for all years per county and dataset. Analysts at NDMA operationally use these matrix plots for their monthly bulletins distinguishing five drought categories (Table 1).
The results for Laikipia are displayed in Figure 8 (top) for FEWS NET and in Figure 8 (bottom) for BOKU anomalies. The low RMSE of Laikipia is confirmed by the very similar seasonal pattern throughout all years between both datasets. Major droughts can be observed for the years of 2006, 2009 and 2011 classified in both datasets as severe and extreme droughts. In 2005 and 2010 short rains failed in the region (KFSSG, 2006) and (KFSSG, 2011a), which led to the detected low VCI in February and March.
A particular situation is captured by the VCI3M anomaly in 2009. In 2009 (KFSSG, 2009b) reported poor long rains but still classified the situation in Laikipia as not exceptionally bad. BOKU data, as well as FEWS NET, reveal on the contrary an extreme drought in 2009, which is for example also confirmed by (Zwaagstra et al., 2010) employing NOAA AVHRR data.
For Laikipia, the only visible difference between BOKU and FEWS NET data relates to the evolution of the drought in 2009; the BOKU data show a gradual degradation of the situation (from dark green to red), whereas FEWS NET saw “wet” conditions in January 2009 (dark green) immediately followed by “moderate” drought in February (yellow). Despite this, the overall agreement between the two datasets is very good for Laikipia.
Figure 8: Seasonal matrix plot of categorised monthly VCI3M anomalies for the county of Laikipia (2003-2014) derived from
(top) FEWS NET dataset and (bottom) BOKU dataset
The drought detected for Mandera is displayed in Figure 9. One can observe slight differences between the drought categories of both datasets, but the differences never exceed more than one drought category. The overall pattern is still quite similar.
Mandera experienced unfavourable long rains in 2005 as well as late, poorly distributed and early ending short rains in 2005 (KFSSG, 2005) and (KFSSG, 2006). As a result, Mandera was affected by a major drought at the end of 2005 and the beginning of 2006 as depicted in Figure 9.
A complete season failure of the short rains 2010 and the long rains 2011 (partially less than 10% of normal rains) was reported for the central and northern part of Kenya including Mandera (KFSSG, 2011a) and (KFSSG, 2011b). Again, this is well reflected by both datasets.
The matrix plots of Kitui are displayed in Figure 10. We added the differences between the FEWS NET and BOKU datasets at the bottom of Figure 10.
For 2005/2006 a moderate to severe drought is captured in both datsets (see Figure 10 top and centre) for the same reasons as in Mandera (KFSSG, 2005) and (KFSSG, 2006).
The 2008 short rains in the southeast including Kitui were exceptionally poor, delayed by 20-40 days and lasted less than three weeks (KFSSG, 2009a). Parts of Kitui received on average only 10-20% of normal long rains in 2009 (KFSSG, 2009b). The situation is depicted in 2009 by both datasets. However, the BOKU anomalies show a clear offset reaching a VCI difference of more than 10% in October 2009 (see Figure 10 bottom), which might be explained by the NRT filtering.
The drought of 2011 was again caused by unfavourable rains both in the short and long season of 2010/2011 but to a lesser extent than for e.g. Mandera (KFSSG, 2011a) and (KFSSG, 2011b). In particular, Kitui hardly experienced rainfall onsets
Figure 9: Seasonal matrix plot of categorised monthly VCI3M anomalies for the county of Mandera (2003-2014) derived from
(top) FEWS NET dataset and (bottom) BOKU dataset
Figure 10: Seasonal matrix plot of categorised monthly VCI3M anomalies for the county of Kitui (2003-2014) derived from (top) FEWS NET dataset, (centre) BOKU dataset and (bottom)
difference between both datasets (FEWS NET minus BOKU)
but had very short episodes of 10-20 day rainfall. The rains ceased unusually early in late April. Consequently, both datasets show severe droughts starting from June 2011. BOKU anomalies recover a little early than the one derived from FEWS NET as indicated by the negative VCI differences in September to December 2011 in Figure 10 (bottom).
5. CONCLUSIONS
FEWS NET provides relevant and well established data for drought monitoring based on satellite observations. With our research, we aimed to studying to which extent we can re-produce the drought indicators provided by FEWS NET in near real-time that is without waiting for the end of the consolidation period. The BOKU data analysed in this paper are provided within 2-3 days after the last Monday in a given month. The data are operationally used by NDMA for their monthly drought bulletins and for triggering the disaster contingency funds (DCF) of Kenya.
In summary, our results clearly show an overall good correspondence between the two chosen datasets. An RMSE in the order of 6 was found for the more closely investigated 3-monthly VCI products. Some larger differences were observed at the onset of vegetation growth that is before the short and the long rains in Kenya. Generally, the driest years were modelled best. Interestingly too, the spatial pattern of the differences between FEWS NET and BOKU-derived VCI was non-random.
Together, these findings indicate some potential systematic differences between the two datasets, which deserve more research. In our future work, we will also focus to quantify how much the FEWS NET data quality degrades if delivered in near real-time.
ACKNOWLEDGEMENTS
The MODIS MOD13Q1, MYD13Q1 and MCD12Q1 data processed in BOKU’s NRT processing chain were obtained through the online Data Pool at the NASA Land Processes Distributed Active Archive Center (LP DAAC), USGS/Earth Resources Observation and Science (EROS) Center, Sioux Falls, South Dakota (https://lpdaac.usgs.gov/get_data). The eMODIS NDVI data were obtained through the Famine Early Warning Systems Network (FEWS NET) data portal provided by the USGS FEWS NET Project, part of the Early Warning and Environmental Monitoring Program at the USGS Earth Resources Observation and Science (EROS) Center. This is acknowledged.
We further acknowledge the support of Matteo Mattiuzzi for R code development and Francesco Vuolo and Martin Siklar (all from BOKU) for setting up the web-tool for data display (http://ivfl-geomap.boku.ac.at/html/demo_WG/kenya/).
Some of the computations of BOKU have been done using the Vienna Scientific Cluster (VSC). This is acknowledged.
REFERENCES
Atzberger, C., Eilers, P. H. C., 2011a. Evaluating the effectiveness of smoothing algorithms in the absence of ground reference measurements. International Journal of Remote Sensing 32, pp. 3689–3709.
Atzberger, C., Eilers, P. H. C., 2011b. A time series for monitoring vegetation activity and phenology at 10-daily time steps covering large parts of South America. International Journal of Digital Earth 4, pp. 365–386.
Atzberger, C., Klisch, A., Mattiuzzi, M., Vuolo, F., 2014. Phenological metrics derived over the European continent from NDVI3g data and MODIS time series. Remote Sensing 6, pp. 257–284.
BOKU, 2015. Web-tools for displaying drought indicators in Kenya, BOKU //ivfl-geomap.boku.ac.at/html/demo_WG/kenya/ (24 Mar 2015).
Eerens, H., Haesen, D., Rembold, F., Urbano, F., Tote, C., Bydekerke, L., 2014. Image time series processing for agriculture monitoring. Environmental Modelling & Software 53, pp. 154-162.
Eilers, P. H. C., 2003. A perfect smoother. Analytical Chemistry 75, pp. 3631–3636.
KFSSG, 2005. Kenya long rains assessment report 2005. Tech. Rep., Kenya Food Security Steering Group (KFSSG) http://documents.wfp.org/stellent/groups/public/documents/ena/ wfp083955.pdf (24 Mar 2015).
KFSSG, 2009a. The 2008/’09 short-rains season assessment report. Tech. Rep., Kenya Food and Security Steering and Group (KFSSG) http://reliefweb.int/report/kenya/200809-short-rains- season-assessment-report-kenya-food-security-steering-group-kfssg (24 March 2015).
KFSSG, 2009b. Kenya long rains assessment report 2009. Tech. Rep., Kenya Food Security Steering Group (KFSSG) http://documents.wfp.org/stellent/groups/public/documents/ena/ wfp208056.pdf (24 Mar 2015).
KFSSG, 2011a. Kenya short rains assessment report 2010. Tech. Rep., Kenya Food Security Steering Group (KFSSG) http://home.wfp.org/stellent/groups/public/documents/ena/wfp2 41326.pdf (24 Mar 2015).
KFSSG, 2011b. Kenya long rains assessment report 2011. Tech. Rep., Kenya Food Security Steering Group (KFSSG) http://documents.wfp.org/stellent/groups/public/documents/ena/ wfp240180.pdf (24 Mar 2015).
Kogan, F., Gitelson, A., Zakarin, E., Spivak, L., Lebed, L., 2003. AVHRR-based spectral vegetation index for quantitative assessment of vegetation state and productivity: calibration and validation. Photogrammetric Engineering & Remote Sensing 69, pp. 809–906.
Mattiuzzi, M., Verbesselt, J., Hengl, T., Klisch, A., Evans, B., Lobo, A., 2012. Modis: Modis download and processing package. processing functionalities for (multi-temporal) MODIS grid data. First International Workshop on “Temporal Analysis of Satellite Images” Mykonos Island, Greece, May 23-25, 2012 (Poster).
Solano, R., Didan, K., Jacobson, A., Huete, A., 2010. MODIS vegetation index user’s guide (MOD13 Series), version 2.00, May 2010 (collection 5). Vegetation Index and Phenology Lab, The University of Arizona. http://vip.arizona.edu/documents/-MODIS/MODIS_VI_UsersGuide_01_2012.pdf (24 Mar 2015).
Swets, D. L., Reed, B. C., Rowland, J. D., Marko, S. E., 1999. A weighted least-squares approach to temporal NDVI smoothing. In: Proceedings of the 1999 ASPRS Annual Conference from Image to Information Portland Oregon.
USGS, 2011. eMODIS Africa product guide version 1.0. USGS EROS Data Center: Sioux Falls, SD, USA.
USGS, 2013. eMODIS TERRA Normalized Difference Vegetation Index (NDVI). http://earlywarning.usgs.gov/fews/-africa/web/readme.php?symbol=zd (24 Mar 2015).
Zwaagstra, L., Sharif, Z., Wambile, A, de Leeuw, J., Said, M.Y., Johnson, N., Njuki, J., Ericksen, P., Herrero, M., 2010. An assessment of the response to the 2008-2009 drought in Kenya. A report to the European Union Delegation to the Republic of Kenya. Tech. Rep., ILRI (International Livestock Research Institute), Nairobi, Kenya.