EXAMINATION ABOUT INFLUENCE FOR PRECISION OF 3D IMAGE
MEASUREMENT FROM THE GROUND CONTROL POINT MEASUREMENT AND
SURFACE MATCHING
T. Anai a, N. Kochi a.d, *, M. Yamada a, T. Sasakia, H. Otanib, D. Sasaki b, S. Nishimura c, K. Kimotoc, N.Yasui c
a General Technology Div., R&D Dept., TOPCON CORPORATION, 751, Hasunuma, Itabashi, Tokyo [email protected]
b Smart Infrastructure Company, Technology Development Dept., TOPCON CORPORATION, 75-1, Hasunuma, Itabashi, Tokyo
c Keisoku Research Consultant Co.,Ltd.Creative design group
d R&D Initiative, Chuo University, 1-13-27, Kasuga, Bunkyo-ku, Tokyo, Japan
WG IV/7 and WG V/4
KEY WORDS: 3DModeling, Accuracy, Matching, Orientation, Surface measurement, UAV
ABSTRACT:
As the 3D image measurement software is now widely used with the recent development of computer-vision technology, the 3D measurement from the image is now has acquired the application field from desktop objects as wide as the topography survey in large geographical areas. Especially, the orientation, which used to be a complicated process in the heretofore image measurement, can be now performed automatically by simply taking many pictures around the object. And in the case of fully textured object, the 3D measurement of surface features is now done all automatically from the orientated images, and greatly facilitated the acquisition of the dense 3D point cloud from images with high precision. With all this development in the background, in the case of small and the middle size objects, we are now furnishing the all-around 3D measurement by a single digital camera sold on the market. And we have also developed the technology of the topographical measurement with the air-borne images taken by a small UAV [1~5]. In this present study, in the case of the small size objects, we examine the accuracy of surface measurement (Matching) by the data of the experiments. And as to the topographic measurement, we examine the influence of GCP distribution on the accuracy by the data of the experiments. Besides, we examined the difference of the analytical results in each of the 3D image measurement software. This document reviews the processing flow of orientation and the 3D measurement of each software and explains the feature of the each software. And as to the verification of the precision of stereo-matching, we measured the test plane and the test sphere of the known form and assessed the result. As to the topography measurement, we used the air-borne image data photographed at the test field in Yadorigi of Matsuda City, Kanagawa Prefecture JAPAN. We have constructed Ground Control Point which measured by RTK-GPS and Total Station. And we show the results of analysis made in each of the 3D image measurement software. Further, we deepen the study on the influence of the distribution of GCP on the precision.
* Corresponding author. This is useful to know for communication with the appropriate person in cases with more than one author.
1. INTRODUCTION
As the 3D image measurement software is now widely used with the recent development of computer-vision technology, the 3D measurement from the image is now has acquired the application field from desktop objects as wide as the topography survey in large geographical areas.
However, for the measurement of higher accuracy, we must make the control point measurement on those images, as well as the geometric correction by orientation devices. When we make the topographical measurement of the air-borne images by a small UAV, often times we cannot obtain the sufficiently accurate coordinates by GPS-IMU boarded on a small UAV. Thus, the model obtained would be not of the real scale but of the relative scale. To solve this problem, we can put lots of Ground Control Points (GCP) and level up the accuracy of the orientation by measuring the GCP on the display. But at the time of natural disaster, often times it is difficult to place
enough GCP and it has not in the idealistic distribution. Besides, among the each of the software of 3D measurement, the method of orientation is different and it could create the difference in the results.
by Total Station (TS) to photography and analyse. To find the effect of different ways of distributing control points, we made 3 patterns of distribution: total area, straight line and pinpoint and assessed their accuracy.
Now first we would dwell on the measuring flowchart of the each software and their features, then report on the accuracy of surface measurement (stereo-matching) as well as on the accuracy verification of different ways of the distribution of control points. And at the end we would summarize the whole system.
2. EXPERIMENTAL ASSESMENT
2.1 The flowchart of measuring process of each software
In our research, as a software which makes 3D measurement and modelling, we chose following 3 kind: Agisoft PhotoScan, Accute3D Smart3DCapture, Topcon ImageMaster UAS. PhotoScan and Smart3DCapture have sfm (structure from motion) of computer vision, as the basic principle. Whereas, ImageMaster UAS has photogrammetry as the basic principle. Each has greatly different process, method of calculation and GUI of its own. Table 1 shows the general specification of software we used.
Table 1. General specification of software
In all software manual process for the production of 3D model is required, but automatic process is possible. So, it does not demand much labour. The big difference in the software lies in the control-point-measurement function, in camera-calibration function (all software parameters input is possible), in point cloud editing function, and in 3D model measuring function. The control points setting is laborious, if the images are numerous. But this work is indispensable to obtain the result highly accurate and reliable.
2.1.1 Accute3D Smart3DCapture[6]: This time we used the ver.3.1 of Accute3D Smart3DCapture expert edition. Figure 1 shows its flowchart. As in the Figure, the process of Smart3DCapture is simple. But the measurement of control points is manual and much laborious, especially the images are
Figure 1. Measuring flowchart of Smart3DCapture
numerous as in the case of UAV. Unless we get at least 3 images the analysis is not possible. As this software perform the camera-calibration automatically, it does not have software for it, but the input of camera parameters is possible. But once the model is made, we can use other software (Smart3DCapture viewer), though limited to confirmation of the result and some simple measurement points. This software works only for minimum necessity, i.e. model production.
2.1.2 Agisoft PhotoScan[7]: In standard edition, there is no control points inputting function. So, we used PhotoScan professional edition ver.1.0.4. As this software is highly flexible, we can make 3D model very easily. But, in order to make the precise measurement by inputting the control points, first we have to fully understand the settings and handling order and then work on measurement. At one glance, we might feel we could make any kind of model, but if we want to measure without error, we have to very attentive. Figure 2 is the flowchart of measurement.
Figure 2. Measuring flowchart of PhotoScan
The measurement of control points is manual, but if the number of control points increases, the possible candidate points are automatically indicates. However, to decide the candidate points individually as one by one, the manual operation is required. The measurement result can be made and output automatically.
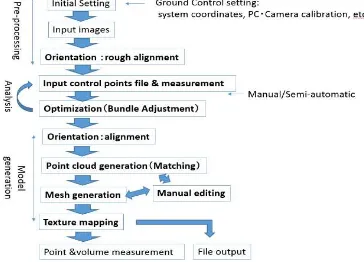
2.1.3 Topcon ImageMasterUAS[8]: As to the Topcon’s ImageMasterUAS is especially defined for UAV, it has the software called Logger and Planner. And as this software is basically for the photogrammetry[1,4,5,9,10], it puts importance more on measurement, comparing with other software First, by Logger we determine the correspondence of the site with the images and information obtained by GPS mounted on UAV. By this function, we can determine, on the spot, the flight position of UAV and the distribution of the control points and we can exclude the wrong coordinate system as well as the misunderstanding of the photographing position. Figure 3 shows the flowchart of the process.
As to the function of control-points measurement, if we use the round target, the image measurement by image processing become feasible [9]. When the images are numerous, as in the case of UAV, the measurement of control points with no personal influence is possible. Besides, it is also labour-saving. In the control point measurement, when we measure manually several points, the automatic measurement becomes available. As the result of automatic measurement is shown in a table, we can amend it by looking at it, if necessary. And on the 3D model thus produced, we can make editing or perform the shape measurement such as the cross-section and contour lines.
2.2 The accuracy of surface measurement
For the assessment of accuracy on surface measurement, we used the test plane and test sphere of AIST (national institute of Advanced Industrial Science and Technology, Japan). Also, with the point cloud of the mannequin which we measured with contact type 3D measuring machine as a yardstick, we compared and assessed the point cloud of mannequin which we were measured by image measuring. The verification of these data is to make a thorough examination of the effect of the presence of pre-calibration which is the element of inner orientation in each software and also the effect of autofocus. So, we starts the test with minimum of 2 images.
Because of the limited capacity of the software: For Smart3DCapture we used at least 3 images and did not work on pre-calibration. For ImageMaster we used 2 images and worked on pre-calibration. For PhotoScan we used 2 images and more, and worked on both with and without pre-calibration. As seen in Figure 4, the measurement was done by projecting random dot pattern [10] and changing camera position we took picture with scale bar. The camera we used was Sony digital SLR ILCE(Alpha) 6000, and lens was macro-lens f 30mm.
Figure 4. Scene of measurement
2.2.1 Test plane measurement: Figure 5 shows the
measured test plane. The deviation from flatness was 2.3 micron.
Figure 5. Test plane
In this experiment the measurement resolution is 0.38mm/pixel. Assessment scale is the deviation from flatness, i.e., we have set it to be the maximum of error of flatness. The unit is mm. We checked the effect of the pre-calibration by looking at the result when it is done and when it is not done by 2 images. Also we checked whether, in the case of plural number of pictures, the
effect of autofocus exist or not by changing photo-angles in various manner. As seen from Table 2, when we made pre-calibration, the flatness of pixel resolution was obtained. So, there was no trouble. When we did not perform the pre-calibration, the result was unstable and not trustworthy. Table 3 shows the result (deviation from flatness) of autofocus picture-taking by automatic calibration. From this result, we found out that as the number of pictures increases there is the case where the accuracy increases, but also decreases.
Table 2(left). With and without pre-calibration, Table 3(right). Autofocus
The result of test plane measurement (unit: mm)
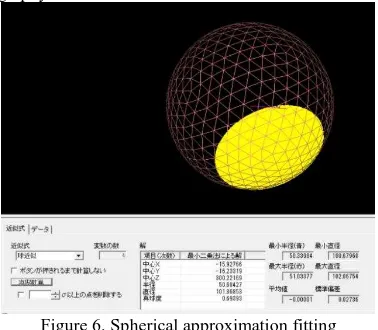
2.2.2 Test sphere measurement: From the point cloud
obtained by matching, we calculated the maximum diameter and minimum diameter by spherical approximation fitting. And we compared its average value with the diameter of the sphere, which was measured by the contact type 3D measuring machine. The accuracy of measuring of contact type 3D measuring machine (Zeiss Accura-J5) was 5 micron and the diameter of the sphere was 101.29mm. Table 4 shows the result when the pre-calibration was used and when it was not used by stereo photography.
Figure 6. Spherical approximation fitting
In this experiment, the depth resolution was 0.21mm. Evidently the accuracy was better when we made pre-calibration. Table 5 shows the result of autofocus photographing. We can confirm the accuracy change by photographing. When we detect the diameter of sphere from point cloud, the size of the area where we make spherical approximation fitting (Figure 6: the area we could make matching) and even very minute error or aberration affects the result greatly. And for this reason, the assessment was difficult and had to be performed very carefully.
Table 4(left). With and without pre-calibration Table 5(right). Autofocus
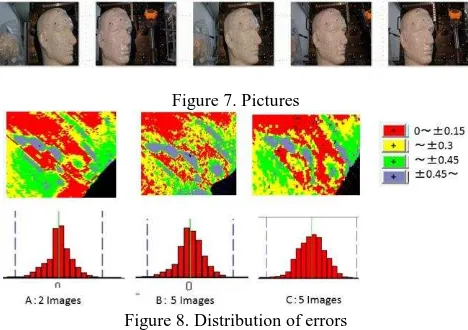
2.2.3 Mannequin measurement: For the measurement of
test plane and test sphere, their shape is converted into numerical values and if they are dispersed, their average is used for comparison. For this reason, in some case much noise is created and, depending on the size of the area, the numerical values fluctuate greatly. And in reality we cannot see the details of the point cloud. Thereupon, we measured at mannequin at 2014 points with contact type 3D measuring machine and same parts were correlated to each other through their point cloud. Especially we compared the difference at the area of eyes, where local variation is great. For registration we used ICP method [11] with points to areas. For photographing, we first fixed focal length and took pictures. As to A, we took 2 pictures. As to B and C, we took 5 pictures. And as shown in Figure 7, we photographed and performed the surface measurement. Figure 8 shows the distribution of errors in the result. Also Table 6 shows the quantity of errors (standard deviation: mm). In this measurement, depth resolution was 0.17mm. While from the Table 6, we cannot see the difference numerically, but from histogram we can see how much the part of the eyes, where its inclination is sharply changed, can be expressed.
Figure 7. Pictures
Figure 8. Distribution of errors
Furthermore, in order to investigate the influence of autofocus on the measurement, we compared the difference when we made 4 images of autofocus set up and when we added one more image to those pictures, The result is shown in the Table 7.
Table 6. Distribution of errors Table 7. Result of autofocus
This result shows that the standard deviation is not much, but the range of errors is widely dispersed (for example: the width of table 7 is 14.09mm). As the number of pictures and feature points became numerous and process number (feature quality) became great, average making effect became also great.
2.2.4 Recapitulation of surface measurement: The assessment of surface measurement required greatest prudence and care, because there are so many things are involved, such as, photographing process, feature patterns projection, orientation stabilization, wide measuring area, noise conquering etc. However, when the number of pictures is small, definitely better result was obtained when we had performed pre-calibration. Again, when we increased the number of pictures and when we performed autofocus, the result was different in each case:
sometimes positive (became better), and at the other times negative (became worse). This indicates that as sfm works on the principle of multi-baseline stereo, the more we have the images the better becomes the resolution. But when the change of pictures is great (change of focal distance, or change of the amount of features), the system cannot absorb them all and brings out various values. Therefore, before we take up a work, we have to sturdy carefully the condition of camera and subject, because these elements affect essentially the final accuracy of the result.
2.3 Sturdy on the distribution of control points: UAV image
2.3.1 Outline of the measurement: The verification by UAV
on the orientation accuracy of the distribution of control points was performed in Yadorigi test site in Kanagawa prefecture in Japan (110m x110m). On this site we had previously set up the control points and measured them by Total Station (TS) and RTK-GPS. Then we flew UAV and analysed its image data. Figure 9 shows the test site on which modelling was performed and control points for measuring. Table 8 shows the measuring conditions.
Table 8. Measuring conditions Figure 9. Test site
The camera used was Sony’s digital SLR ILCE (Alpha)-6000 (6000x4000) with lens (f 20mm). Flight 1~4 were performed at about 40m high above the ground, overlapping about 80%, with the base length 9m. With this condition, the plane resolution is about 8mm and depth resolution is about 24mm. And the accuracy of observation of GCP was about 11mm. Figure 10 shows an example of 3D model produced.
Figure 10. Example of 3D reconstruction of topography
2.3.2 Result of measurement: Table 9 shows the standard
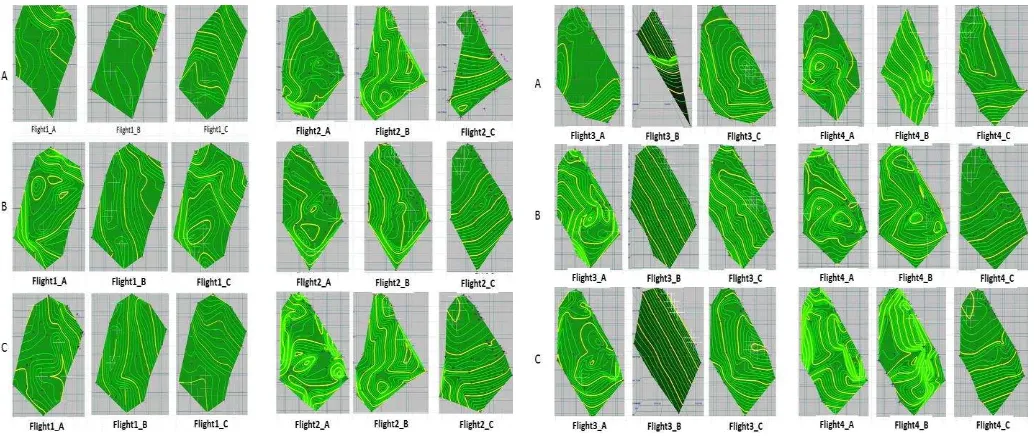
deviation and RMSE of the error of the coordinates x,y,z of verification points in each flight. What comes out over 40mm is written in bold. In most of cases we can measure within 40mm. However, as this value is not sufficient to grasp the result. Figure 12 shows it by contour lines after the residual of verification points were put into 3 dimension. From the pictures we can obtain the trend of the distribution of errors in the placement of control points.
Flight pattern_ A (control points spread in the entire area):
with the minimum error at the control points, errors spread in the entire areas.
Flight pattern_B (control points forming a straight line):
control points glow as a straight line with minimum error, and contour line is a straight line (error appear as a curved surface).
Flight pattern_C (control points unevenly distributed at
pinpoint): here each of the control points has the least possible liability of error (center), but totally viewed, error trends to increase as it gets remote from the center, on the form of contour lines.
In the Flight pattern_A, we can see the difference in error distribution corresponding verification point among software. In the software A, error distribution is uniform for each control point, forming comparatively gentle error curved surface. Whereas, with the software B and C, while the accuracy around the control points is satisfactory, the error rapidly changes, if it gets remote from the control points. But judging from the result of the flight pattern_B and _C, while all the software A,B,C get effect of the unevenly distribution of the control points, especially in the flight pattern_B errors are numerous. The feature of the flight pattern_B is particularly manifested in the flight3_B, as control points are in the end of image, in all A,B,C the errors range from 133mm to several meters. Each of A,B,C has different value but as their errors are numerous, they are not useful for measurement. Especially the case of B in the flight3_B, other than the value Z, at a first glance looks satisfactory, but we cannot use it as measurement data in practical work. So, in this way, as we often tend to overlook, we have to be careful when we verify the result.
3. CONCLUSION
From our sturdy, we learned the following points.
1. In the measurement when the number of image is less than 2 images, it is indispensable to perform pre-calibration. But when it is numerous, it is not. The quality of measurement depends on the amount of the features of the object.
2. When we use autofocus, especially when the number of the images is small, we can no longer disregard the influence on the accuracy of the measurement (sudden change in focal length, photographing position, photographing angle). To make highly accurate measurement fixed focus should be used.
3. The distribution of control points has to be done evenly as a whole after having fully studied the necessary accuracy while abstaining desire for excessive quality.
4. When it is not possible to distribute evenly, it is better to distribute like encircling the area. This time, in the example of measurement, we obtained the sufficient accuracy below 2cm by encircling area.
5. When the distribution of control points becomes straight line, in the area remote from the straight line, the errors tend to become bigger by forming an inclined plane. So, we have to be careful. And if an object has abundant features, we can easily make 3D model. As a result, it became possible to evaluate and measure the reconstructed model from many angles. But the quality of the product basically depends on the distribution of the control points and the photographing condition. To make the product useful to the purpose for which it was made (not to fail in measurement), we must examine very carefully its photographing condition and measurement condition to satisfy the necessary accuracy. After making the photographing plan, and distributing the control points, we must confirm them by simulation test. And only then, we must work on the actual photographing and measuring.
References
[1]N.Kochi, ”Photogrammetry”, Handbook of Optical Metrology, “ Principles and Applications, Yoshizawa,T.’(Ed.), Taylor and Francis, Chapter 22 (2009)
[2]M. Naumann. et. al., 2013. Accuracy Comparison of Digital Surface Models Created by Unmanned Aerial Systems Imagery and Terrestrial Laser Scanner, ISPRS, Volume XL-1/W2, uav-g 2013 , Rostock, Germany, pp 281-286
[3]M. Bolognesi, et. al., 2014. Accuracy of Cultural Heritage 3d Models by Rpas and Terrestrial Photogrammetry, Volume XL-5, ISPRS Technical Commission V Symposium, 2014, Riva
[9]N.Kochi, et. al., PC-based 3D Image Mesuring Station with Digital Camera An Example of Its Actual Application on a Historical Ruin : ISPRS, Vol. XXXIV,Part 5/W12, pp. 195-199. July 2003
[10]N. Kochi, et. al., “3D-Measuring-Modeling- System based on Digital Camera and PC to be applied to the wide area of Industrial Measurement”, SPIE Optical Diagnostics, August, pp.588015-1-10 (2005)
[11]P.J.,Besl and N.D. McKay, 1992. A Method for Registration of 3-D Shapes. IEEE Transaction on Pattern Analysis and Machine Intelligence, vol.14, no.2, pp.239-256, [12]M. Hess, et. al., 2014. A Contest of Sensors in Close Range 3D Imaging: Performance Evaluation with a New Metric Test Object, Volume XL-5, ISPRS Technical Commission V Symposium, 2014, Riva del Garda, Italy, pp277-284
[13]E. Dall’Asta, R. Roncella, 2014. A Comparison of
Semiglobal and Local Dense Matching Algorithms for Surface Reconstruction, Volume XL-5, ISPRS Technical Commission V Symposium, 2014, Riva del Garda, Italy, pp187-194
Figure 11. The distribution of control points in each flight
Table 9. Accuracy in the distribution of control points (unit m)