3D IMAGE BASED GEOMETRIC DOCUMENTATION OF THE TOWER OF WINDS
M. S. Tryfonaa, A. Georgopoulosb*
aFaculty of Architecture and the Built Environment, TU Delft
Laboratory of Photogrammetry, School of Rural & Surveying Engineering National Technical University of Athens, Greece
Special Session SpS1, CIPA
KEY WORDS: Geometric Documentation, three dimensional, Digital images, Structure from motion
ABSTRACT:
This paper describes and investigates the implementation of almost entirely image based contemporary techniques for the three dimensional geometric documentation of the Tower of the Winds in Athens, which is a unique and very special monument of the Roman era. These techniques and related algorithms were implemented using a well-known piece of commercial software with extreme caution in the selection of the various parameters. Problems related to data acquisition and processing, but also to the algorithms and to the software implementation are identified and discussed. The resulting point cloud has been georeferenced, i.e. referenced to a local Cartesian coordinate system through minimum geodetic measurements, and subsequently the surface, i.e. the mesh was created and finally the three dimensional textured model was produced. In this way, the geometric documentation drawings, i.e. the horizontal section plans, the vertical section plans and the elevations, which include orthophotos of the monument, can be produced at will from that 3D model, for the complete geometric documentation. Finally, a 3D tour of the Tower of the Winds has also been created for a more integrated view of the monument. The results are presented and are evaluated for their completeness, efficiency, accuracy and ease of production.
* Corresponding author
1. INTRODUCTION
During the recent years, the technological evolutions have helped a lot the field of geometric documentation of cultural heritage through the production of more immediate, informative and accurate results. One such significant technological advancement was the development of automated algorithms for determining corresponding points on overlapping images (Szelicki 2010). Thus it has been possible to produce fast, accurate and coloured point clouds from digital images without spending a fortune on costly and heavy equipment like terrestrial laser scanners. It has been observed that the international scientific community involved in heritage documentation has gladly accepted this advancement, albeit with some questionable results. Applying structure from motion and multi-view stereo algorithms is easy, but the raw data should be very carefully collected for ensuring the production of the final results according to the required strict specifications. In general, the specifications of a geometric documentation of a monument are related to a variety of factors, such as its size and position, the intended use of the documentation products, the users’ needs and, of course, the cost of the project.
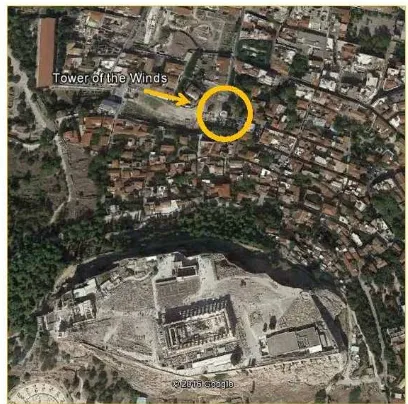
This paper describes the process of the geometric documentation of the Tower of the Winds, which is a very important and unique monument, located in the Roman Agora, in the heart of Athens (Figure 1). The main purpose of this paper is to record the position, size and shape of the monument in the three dimensional space, mainly from coloured point clouds that are created almost entirely using digital images and through the implementation of such automated algorithms. That technology is combined with the establishment of a
trigonometric network, i.e. a local reference system, around the monument, for the georeference of the images and the definition of the sectional planes.
Figure 1: The location of the Tower of Winds in relation to the Acropolis hill
A large number of digital images of the entire monument have been taken in different ways and in different shooting conditions resulting to a multitude of image scales. With the help of a piece of commercial software, i.e. Photoscan® by Agisoft, which implements Structure from motion and Multi
View Stereo algorithms, point clouds of the object were created through the orientation of the images. The corresponding meshes were generated and the orthophotos were produced. The specifications for the geometric documentation of the Tower of the Winds were determined, in order to document all the features of the monument with the minimum number of drawings, while ensuring the necessary precision and level of detail.
In section 2, the history and the characteristics of the Tower of the Winds are analysed. Then in section 3, the specifications for the proper geometric documentation of that monument are presented. The methodology that is used is described in section 4 and the results are presented and are evaluated for their completeness, efficiency, accuracy and ease of production. The problems that arose during the process are discussed in section 5. Finally, in section 6, some brief conclusions and recommendations are suggested.
2. THE MONUMENT AND ITS HISTORY
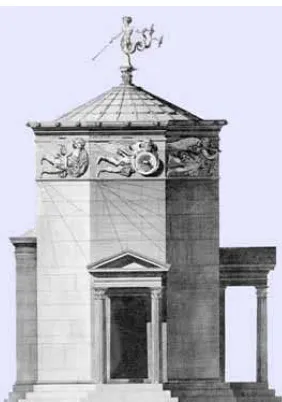
The Tower of the Winds is located in the Roman Agora of Athens, which is situated on the northern foot of the Acropolis hill and east of the Ancient Agora (Figure 1). Its name is related to its form and appearance, because it gives the impression of a tower-like eight sided structure with a wide frieze decorated by relief figures of the Winds. According to Vitruvius, at the top of the roof there was a rotating brass Triton that indicated the direction of the wind, as shown in Figure 2. It probably functioned as a sundial, when there was sunlight. When the weather conditions did not permit that operation, there was a hydraulic system for counting the time. On the south side of the tower, a cylindrical water tank, connected to the interior space of the building, functioned as a hydraulic time measuring mechanism. The tank was provided with water from the Klepsydra (Greek word for hour glass) spring of the Acropolis hill through a complicated pipe system. The external form of the monument is classified in the Corinthian order, mainly due to the column capitals, while the inside is classified of the Doric order, which is more austere and rigid in forms (Mastrapas, 1992, Wikipedia, 2015).
Figure 2: The Tower of the Winds in Athens, as reimagined in 1762 (Wikipedia, 2015)
The astronomer Andronicus from Cyrrhus town, in ancient Syria, was the one who designed and built the Tower of the Winds. Its foundation is believed to have taken place in the middle of the 1st century B.C. In the early Christian times, it became a Christian Orthodox church or a baptistery of a neighbouring church, while in the 15th century it is referred as the temple of Aeolus. In the second half of the 18th century, the building was renamed to Brahimi’s Tekke, because it had been turned into an Islamic prayer shrine (Tekke) for Dervishes, who used it until 1821. The Tower of the Winds was, for a century, the focal point of the spiritual Islam in the centre of Hellenism. This peculiarity of the area saved the monument from Lord Elgin, who was planning to transport the whole building to England in 1805 (Mastrapas, 1992).
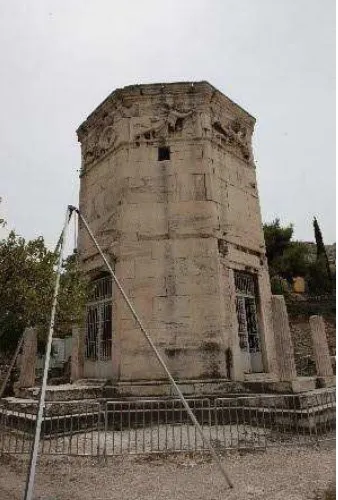
The Tower of the Winds is a 12m tall octagonal building with 8m external diagonal, a slab roof of ingenious construction and large reliefs depicting the personifications of the winds on each one of the eight sides, which are approximately 3m in length. It rests on a crepidoma with a three level stylobate and it is covered with marble slabs from nearby mountain of Penteli, thus forming the octagonal prism. The figures of the Winds appear as reliefs on the top of each side of the tower, on the frieze. It is easy to recognize them by their characteristics, but also their names, which can be easily read close to each figure. The building has two entrances, one to the right and one to the left of the north side. In front of both entrances there are crowning pediments, which are based on a small porch (Figure 3) supported by two Corinthian columns (Wikipedia, 2015).
3. SPECIFICATIONS
The three dimensional geometric documentation was required to serve as a basis for restoration works. The Ephorate in charge of the monument requested specific drawings at a scale of 1:50 in order to geometrically document it and provide the basis for their restoration studies. This request combined with the accuracy requirements of the large scale, dictated the use of appropriate instrumentation and processing procedures. For the complete geometric documentation of the Tower of the Winds, the following drawings were requested:
Figure 3: Image of the Tower of the Winds in the 21st century
1. Three horizontal section plans of the monument at different levels (Figure 4), i.e. at 1.0m, 7.2m and 9m from the stylobate.
2. Top view of the roof, i.e. the bird’s eye view.
3. Eight vertical cross section plans of the monument, intersecting each side in the middle and including orthophotos of both sides of the interior of the monument (Figure 5).
4. Eight elevations with orthophotos of the eight exterior facades.
Figure 4: The positions of the horizontal section plans
Figure 5: Example of the position of two of the vertical cross section plans of North-South (A-A’) and
South-North (B-B’)
The specified scale (1:50) requires an accuracy of at least 15mm and the related orthophotos should have a ground pixel size of maximum 5mm. This latter restriction should be seriously taken into account during the image acquisition phase.
4. METHODOLOGY
The main objective of this project was to meet the above requirements, mainly through the production and exploitation of coloured point clouds produced almost entirely from high resolution digital images of the entire building, with the help of the Structure from Motion (SfM) and Multi View Stereo (MVS) algorithms. It was decided to produce a textured three dimensional model first and from that to extract all required orthophotos and 2D elevation drawings. Hence the methodology used was based on performing as few surveying measurements as possible and taking and processing a large number of digital images of the monument. Consequently the geometric documentation has been based almost entirely on
processing suitably taken high resolution digital images, which introduces an innovative practical approach.
4.1 Structure from Motion
Structure from motion (SfM) is a range imaging technique, which refers to the process of estimating three-dimensional structures from two-dimensional image sequences whose positions are also determined. The SfM achieves the reconstruction of the scene geometry and camera motion from two or more images of the object, as it is shown in Figure 6. It tracks 2D features, such as corners and line segments, and finds correspondences between frames (Westoby et al., 2012). Moreover, the SfM algorithm determines 3D information, by estimating the motion of the camera in relation to the structure. SfM actually performs a bundle adjustment and reconstructs the surfaces with image-based triangulation and multi-view stereo (Weng et al., 2012).
Figure 6: Example of the positions of the camera for multiple and overlapping photographs, to reconstruct scene geometry
and camera motion (Westoby et al., 2012)
4.2 Data Acquisition
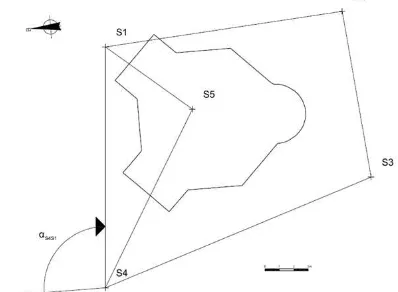
A simple, but accurate, survey network (Figure 7) was established to ensure the connection of each side of the monument in 3D space and to provide the minimum geodetic information for the proper geometric documentation, while at the same time ensuring the required accuracy. The network refers to an arbitrary local coordinate system to avoid deformations of the shape or the size of the Tower of the Winds that can be caused by implementing the map projection of the national mapping reference system (Lambrou & Pantazis, 2011).
Figure 7: The traverse stations in relation with the monument
The few necessary control points for the horizontal and vertical plans and sections and the necessary ground control points were measured and determined in reference to this network. The main bulk of data were, as already mentioned, the digital images. They were taken using a pre calibrated Canon 1Ds MIII full frame DSLR camera with two fixed lenses (24mm, 50mm) and a zoom lens (16-35mm). For the images taken with the zoom lens, care was taken to fix the lens zoom ring to a certain value throughout the taking sequence. These images were taken with the camera either handheld or on a photographic tripod for stability, but also from a special aluminium tripod (Figure 8) able to hoist the camera at a height of approximately 7.50m with the axis either vertical or horizontal.
As the data acquisition progressed, scaffolding was deployed around the monument for the restoration works and thus it was possible to reach and photograph details that could not otherwise be imaged and were important for the completion of the geometric documentation. These details concerned mainly the roof and the corresponding interior higher parts of the construction. In total 1211 images were selected from the many more that were taken of both the exterior and the interior of the monument.
Figure 8: The special tripod for hoisting the camera
4.3 Data Processing
The coordinates of all the surveyed points were calculated and their coordinates were subsequently transformed, i.e. rotated and translated, in order to enable the orthogonal projection of all different elevations of the interior and the exterior of the monument without deformations. The acquired images were too many to be processed together, therefore they were inserted to the SfM software in groups (chunks), the main ones being one for the exterior (Figure 9) and one for the interior (Figure 10) of the monument. Processing for each chunk was performed using masks, in order to assist the algorithm to avoid determining redundant information and, thus, deleting unnecessary images.
Figure 9: The dense point clouds and the positions of the cameras (blue rectangles) of the exterior of the Tower of the
Winds
The point cloud for each chunk was created with the highest precision possible, in order to keep all the necessary details of the monument. The point clouds were carefully edited by deleting unnecessary points and unwanted noise and then, the chunks were merged together, resulting in the creation of two integrated parts, which include the exterior (Figure 9) and the interior (Figure 10) of the monument.
Figure 10: The sparse point cloud of the interior of the Tower of the Winds
The raw digital image data contained images with a wide range of image scales and, consequently, very different ground sampling distances. This posed an additional difficulty for the implementation of the above described automated algorithms. Inherently the automated algorithms which are looking for matches take for granted that from image to image scale does not differ a lot. However, here that was not 100% the case, and this posed certain technical problems, which were confronted by exploiting the implementation of the algorithms in the software. Specifically, the various groups of images with similar image scale were aligned separately and the fusion of the dense point clouds was performed later using carefully selected common detail points, not necessarily control points, i.e. with known coordinates. Thus gradually a common point cloud of the object has been created, by means of the Structure from Motion (SfM) and the Multi View Stereo (MVS) algorithms.
A small number of the points that were measured in the field were identified in the point clouds to achieve the georeference. Thus both, i.e. exterior and interior, point clouds acquired coordinates (X, Y and Z) in the common arbitrary coordinate system that was defined at the beginning. This enabled the
separation of some georeferenced chunks, from the georeferenced point clouds (exterior and interior), in order to further process them. This separation was necessary, because of the low availability of computer memory (8GB RAM) and the large amount of information necessary to be processed. Subsequently, the creation of the surface for each chunk followed and the inevitable holes were filled using another piece of software, i.e. Geomagic v.13. To sum up, the generated surface and the digital images enabled the production of the orthophotos for each required surface. Some radiometric corrections were necessary and were performed using standard image processing software.
Although this work was performed within the framework of a Diploma Thesis, a fact which inevitably increases the time needed for acquisition and processing, some indications may be given for the time required to collect and process the data for achieving the described results taking into account the learning curve. The estimation of times needed for completing this
Section lines from point clouds 5
TOTAL 5 42
Table 1: Time estimation for data acquisition and processing
One may see from Table 1 that processing time tends to be far longer than acquisition time, in this case 8.4 times. However, experience has shown that this factor may vary from 1:6 to 1:15 depending on the quality of the raw data and the computing power available.
4.4 Results
As specified at the beginning of this project, the textured point cloud was produced and used as the main source from which all required two dimensional drawings have been produced. These drawings traditionally include on one hand a specific section specific plane each time. The innovative approach in this case is that all necessary data were extracted from the image based 3D model. For the generation of the orthophotos a ground pixel size of 3mm has been chosen.
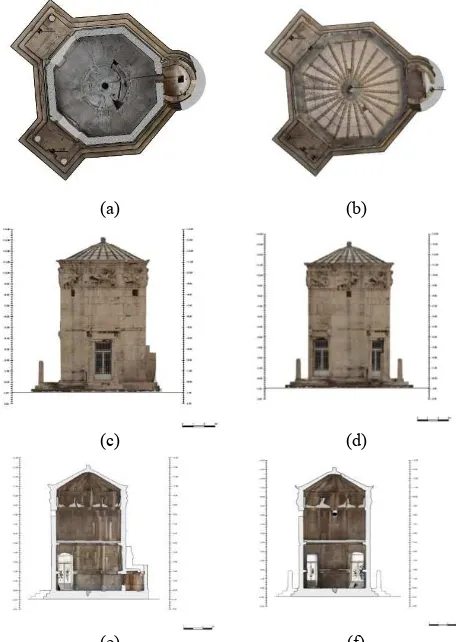
For the complete geometric documentation of the Tower of the Winds, 20 drawings were produced, as already mentioned in detail in section 3. In Figure 11 some representative samples of these products are shown.
These drawings contain all the necessary detail information in form of raster images, i.e. the orthophotos. Consequently they are complete and in fact they contain more information than necessary for any kind of application. This means that they could serve as a basis for producing further specific products e.g. line drawings of the pathology or of the geometry or of the materials used etc. However, this requires the careful interpretation by the interested experts each time.
If further drawings are required, e.g. additional horizontal sections or elevations, they may easily be produced from the three-dimensional texture model in the same way. In that sense the approach implemented is efficient and offers ease of production for further geometric documentation products.
As for their accuracy, these products guarantee the necessary precision dictated by the working scale, in this case 1:50. This may be deduced from the adjustment results given by the software, which were within the required accuracy. Actually the adjustment of the images results to the orientation of the images in space, which is defined by the control points introduced to the solution. After the adjustment the coordinates of the control points are determined photogrammetrically and compared to the geodetically measured ones. The differences give a rough idea about the precision of the adjustment, which in this case is somewhat biased. For a more objective estimation check points have been used, i.e. points of known coordinates that were not involved in the adjustment. Both the above results were within the required accuracy limits, thus guaranteeing that all
(a) (b)
(c) (d)
(e) (f)
Figure 11: Samples of the final drawings. A horizontal section (a) and the bird’s eye view of the roof (b), tow outside elevations
(c) and (d) and two vertical sections (e) and (f)
geometric documentation products ensure the required accuracy.
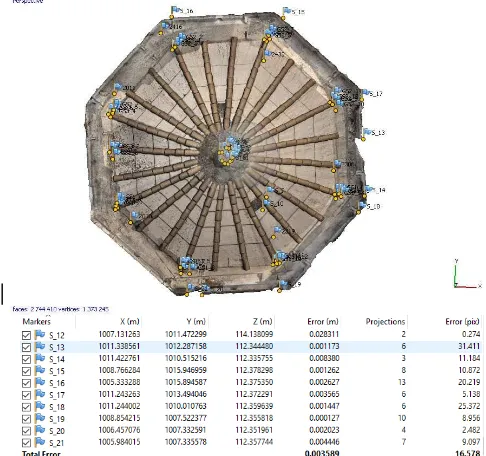
As an indication the results of the adjustment for the images of the slab roof, taken from the scaffolding, are presented in Figure 12. The results show that for the check points, a mean error of 3mm has been achieved, which well satisfies the scale limit accuracy. Of course this is attributed to the large scale of the images in this case. More representative results are the ones presented in Figure 13. In this case the mean error is 11 mm, which, also satisfies the scale accuracy (15mm) and is more realistic considering the data acquisition conditions.
Figure 12: The adjustment results for the images of the slab roof
Figure 13: The adjustment results for the images of the exterior elevations
The required products for the geometric documentation of the Tower of the Winds were produced by combining the
processing of the images, the creation of the point clouds and the meshes, the production of the orthophotos and the extraction of the section and projection lines. The accuracy of such lines extracted from point clouds has already been checked (Bariami et al., 2012) and is guaranteed. Georeferencing was performed based on control points, whose coordinates were determined using precise surveying measurements with a total station. Their coordinates were determined with an accuracy of ±8mm.
Moreover the produced documentation drawings (Figure 11) were thoroughly checked against each other. This implies that all drawings were compared within the CAD environment, e.g the elevations against the horizontal sections, the neighboring elevations to each other, the interior and exterior elevations again to each other and so forth.
5. SOLUTIONS TO PROBLEMS
The problems encountered for this project were many and attributed to various sources. They could be distinguished to problems due to the image acquisition and due to the data processing methodology.
5.1 Image acquisition problems
Firstly, due to the size and structure of the monument, it was very difficult to take images at certain elevations, despite the use of the aluminum tripod (Figure 8). The scaffolding which was gradually erected to enable the restoration works, provided the opportunity for taking images from a higher vantage point, but very close to the structure. This increased the number of images necessary and also drastically changed the GSD of the images.
Since there were some omissions for the completeness of the sections, i.e. projections and other details, some extra shots were taken, to cover these omissions. Again the scaffoldings that were placed at the latter stage on the exterior and the interior of the monument for restoration works facilitated the photo shooting of the details.
Also, certain problems occurred during the aligning of the images. Due to the small overlap and because of focusing and lighting problems, some images could not be aligned. This problem was solved again with additional shots that had greater overlap and with the use of special artificial lighting and a tripod, for better illumination and stability.
5.2 Data processing problems
For the processing stage, the drastically different image scales and GSD’s posed a severe problem, which is attributed to the inability of the algorithm to accommodate such differences. This problem was solved by dividing the large number of images to groups and processing them separately. These groups were connected later to form a unique point cloud based on carefully identified common points. A facility offered by the software.
Moreover, some difficulty arose while creating the surface, i.e. the mesh, of outside and inside parts of the monument from the merged and georeferenced point clouds. On account of the large volume of information (>10 GB), the data processing was not able to be performed with the available computing power. The
solution again came with the sectioning of the georeferenced point clouds, exterior and interior, into smaller chunks, with less volume.
The facility offered by the software for applying masks to the images enabled the faster and more accurate processing. By using masks, the software is guided to exclude from all processing stages those areas of the images that -according to the user’s experience- would cause misalignments and determination of unnecessary points in the cloud.
Additionally, after the creation of the surface in the software, there were some holes that needed treatment. This was decided to be remedied using another piece of software, as Photoscan is not ideal for that. In this case the appropriate software chosen to elaborate the mesh and fill the holes was Geomagic v.13. The same software was also employed in order to extract the section lines from the generated mesh.
For georeferencing the point clouds, i.e. for relating them to the local reference system, a few control points were geodetically measured. These points were selected very carefully on the object in order (a) to be well determined and visible on the images and (b) to be well distributed in order to achieve the best result for the georeference. Their number was more than the least necessary, in order to keep some of them as check points and to assess the precision of the final drawings.
Finally, some radiometric issues occurred in the orthophotos. There were lighting problems, shadows and redundant information, which were also fixed with appropriate image processing software.
6. CONCLUDING REMARKS
It has been shown that it is possible to diminish surveying measurements and rely almost entirely on digital images, in order to complete a full geometric documentation of a monument. To this end, contemporary advancements in technology and the availability of software implementing photogrammetric and computer vision algorithms have greatly contributed. However, these automated techniques should always be applied and used with extreme caution. Deep photogrammetric knowledge is of utmost importance, as the results may seem attractive, but very often they contain serious flaws, which will wrongly be attributed to Photogrammetry.
The caution starts with taking the images, which being the raw data, are quite decisive for the quality of the outcome in the end. It is not enough to read the manual of the software, in order to take appropriate images. Furthermore, the selection of the various parameters during all stages of the processing phase should be a careful action, based on knowledge of the algorithms, their pitfalls and their limitations.
In conclusion, it has been shown that the rapid evolution of technology can greatly help mapping in such great detail and accuracy. The geometric documentation of the Tower of the Winds, based almost entirely on digital images, is concluded with the required accuracy and within a relatively short time. For achieving even better results with such a process, the following actions are proposed:
Uniform distribution of measured ground control points, as in some areas there was an excess of information and in other areas lack of observations.
Better lighting and focusing when acquiring the images in the field, for a better monitoring of the object and less need for image processing of the final orthophotos.
More available RAM and computing power for faster results.
ACKNOWLEDGEMENTS
The help of the staff of the Ephorate of the Antiquities at all stages of the project is acknowledged.
REFERENCES
Bariami, G., Faka, M., Georgopoulos, A., Ioannides M. and Skarlatos D., 2012. Documenting a UNESCO WH Site in Cyprus with Complementary Techniques. Project paper in “Lecture Notes in Computer Science (LNCS)”, Springer Verlag. 4th International Euro-Mediterranean Conference (EUROMED), 29/10 – 03/11 2012 Limassol Cyprus.
Lambrou, E., Pantazis, G., 2011. Applied Geodesy, Ziti publications, Athens.
Mastrapas, A., 1992. Monumental Topography of Ancient
Athens, Kardamitsa publications (in Greek), Athens.
Szelicki, R., 2010. Computer Vision: Algorithms and Applications. Springer Verlag.
Weng, J., Huang, T. S., Ahuja, N., 2012. Motion and Structure
from Image Sequences, 1st Edition. ISBN: 9783642776458.
Springer Publishing Company, Incorporated. url: http://dl.acm.org/citation.cfm?id=2408279.
Westoby, M.J., Brasington, J., Glasser, N.F., Hambrey, M.J., Reynolds, J.M., 2012. Structure-from-Motion photogrammetry:
A low-cost, effective tool for geoscience applications,
Geomorphology, Volume 179, p. 300-314, Elsevier B. V.
http://el.wikipedia.org,