TESTING OF LAND COVER CLASSIFICATION FROM MULTISPECTRAL AIRBORNE
LASER SCANNING DATA
K. Bakuła a, *, P. Kupidura a, Ł. Jełowicki a
a Warsaw University of Technology, Faculty of Geodesy and Cartography, Department of Photogrammetry, Remote Sensing and Spatial Information Systems, Warsaw, Poland – (k.bakula, p.kupidura)@gik.pw.edu.pl, [email protected]
Commission VII, WG VII/4
KEY WORDS: multi-wavelength ALS, textureanalysis,classification, data fusion, laser intensity, land cover mapping
ABSTRACT:
Multispectral Airborne Laser Scanning provides a new opportunity for airborne data collection. It provides high-density topographic surveying and is also a useful tool for land cover mapping. Use of a minimum of three intensity images from a multi-wavelength laser scanner and 3D information included in the digital surface model has the potential for land cover/use classification and a discussion about the application of this type of data in land cover/use mapping has recently begun. In the test study, three laser reflectance intensity images (orthogonalized point cloud) acquired in green, near-infrared and short-wave infrared bands, together with a digital surface model, were used in land cover/use classification where six classes were distinguished: water, sand and gravel, concrete and asphalt, low vegetation, trees and buildings. In the tested methods, different approaches for classification were applied: spectral (based only on laser reflectance intensity images), spectral with elevation data as additional input data, and spectro-textural, using morphological granulometry as a method of texture analysis of both types of data: spectral images and the digital surface model. The method of generating the intensity raster was also tested in the experiment. Reference data were created based on visual interpretation of ALS data and traditional optical aerial and satellite images. The results have shown that multispectral ALS data are unlike typical multispectral optical images, and they have a major potential for land cover/use classification. An overall accuracy of classification over 90% was achieved. The fusion of multi-wavelength laser intensity images and elevation data, with the additional use of textural information derived from granulometric analysis of images, helped to improve the accuracy of classification significantly. The method of interpolation for the intensity raster was not very helpful, and using intensity rasters with both first and last return numbers slightly improved the results.
* Corresponding author
1. INTRODUCTION
Remote sensing images have been an important source of information of land cover and land use for few decades. Soon after the appearance of this type of images, methods for automatic and semi-automatic classification of their content were developed. The first such proposal based on pixel classification was presented by Robertson (1973). It took into account the spectral characteristics of pixels in multispectral images derived mostly from passive remote sensing optical systems. Hence, this type of classification is sometimes called the spectral classification (Campbell, 2008; Kupidura, 2015). In subsequent years, methods for classification have been developed: enriching the results by texture analysis (Darling, Joseph, 1968; Haralick, 1973; Lam, 1990; Kupidura, 2015), using Artificial Neural Networks (Benediktsson et al., 1990; Bosch, 1999), the contextual approach (Gurney, Townshead, 1983; Jackson, Landgrebe, 2002) and object-based (Beucher, Lantejoul, 1979; Blaschke et al., 2000) or knowledge-based approaches (expert classification) with use of other geospatial data (Chmiel, 2002; Pluto-Kossakowska, 2003; Campbell, 2008). The appearance of high-resolution elevation data from airborne laser scanning made possible the integration of optical image data, usually obtained on the basis of the classic passive photogrammetric cameras and, as a result, they have significantly increased the accuracy of the classification of land cover.
Modern airborne laser scanners have recently been able to scan in two or more wavelengths of the laser. This method allows the obtaining of diverse information about an area, with the different spectral properties of objects. A further direction of LiDAR technology is the diversification toward more than one laser wavelength, by selection of the best-suited wavelength or finding additional information owing to registration in a few wavelengths (Pfennigbauer and Ullrich, 2011). Such an application can be achieved by parallel registration using at least two scanners collecting data in three wavelengths, or by using a sensor that collects laser data in multispectral channels. The example of such a scanner is Titan by Optech (van Rees, 2015). This latest trend in the development of LiDAR technology considers a different approach to ALS point clouds, one that can create land cover maps more effectively than typical topographic ALS, providing a tool for high-density topographic surveying which can be useful for land cover/use classification. Such a data source can even be an alternative or a supplement to photogrammetric data collection. The potential of multispectral airborne laser scanning in land cover mapping was presented in a few publications (Bakuła, 2015; Wichmann et al., 2015)
2. DESCRIPTION OF EXPERIMENT
The experiment was carried out to analyse the capacity of multispectral airborne laser scanning in land cover/use mapping. The potential of these data may differ from the
potential of traditional multispectral data collected using passive remote sensing sensors, primarily due to the different geometry of lighting the imaged area (point), but also the opportunity to register more than one return of the laser beam, and thus penetration though vegetation is possible via this active technique. As the possibilities of classical multispectral imagery are quite well known in this area, data from multispectral airborne laser scanning requires experimental confirmation. Besides spectral data, digital elevation models derived from the LiDAR system were used to improve the results of land cover/use classification. Additionally, different methods for the generation of reflection intensity rasters were tested, besides the application of morphological and granulometric processing in order to investigate the full potential of the analysed data in the presented experiment.
2.1 Test area and data used
In the presented experiment, testing data were acquired with the Titan scanning system by Optech. The data were collected in 2014 for the area of West Rouge, Toronto, Ontario, Canada. The data were measured in three independent scanning channels for the wavelengths of 532 nm, 1064 nm and 1550 nm. Such multi-wavelength registration allowed us to distinguish different land cove/use areas and, due to the registration of green channels, it is an effective tool for coastal zone mapping (van Rees, 2015). The tested data were collected at 400 m with a pulse repetition frequency (PRF) of 600 kHz for the whole system (200 kHz for each scanning channel). The analysed data were scanned with a maximum angle of 30°. The area is a suburban one along the shoreline of Lake Ontario, with mixed buildings and vegetation. The data were also collected over an area of shallow water and characteristic harbours. Figure 1 presents the described test area showing spectral information, shown as a colour composite overlaying the shaded digital surface model created from three intensities of laser reflectance rasters, registered with over-mentioned wavelengths. The scanning data were saved in separated files for three strips. Each strip consisted of three different .las files for three channels saved according to the ASPRS standard. The density of the whole point cloud was over 60 points per square metre – over 20 points for each channel and about six points as the average density of one scanning strip for one channel. During pre-processing, data from multispectral airborne laser scanning digital elevation models were generated: digital terrain model (DTM) and digital surface model (DSM). The DTM was generated from points classified as ground points in three different laser wavelengths channels. The DSM was created based on all three channels, filtering only the first return from the point cloud. Elevation data were additional data in the presented research, which provide information
about land cover by using the normalized digital surface model (nDSM) created as the difference between the above mentioned models, as follows (Formula 1):
nDSM = DSM - DTM (1)
The impact of the elevation models on a positive result of classification was tested in the experiment. The last elevation product was the raster of the DTM, taking into account the lakebed’s surface. Such a digital terrain model was used to improve the distinction of water’s surface in classification by calculating the water depth from minus values of difference, of elevation models: model from the last echo of near-infrared channel, and the last echo from the green channel.
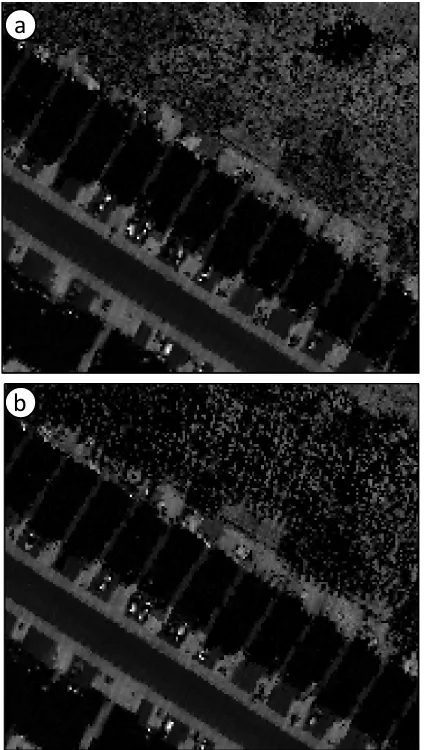
Figure 2. Reflection intensity rasters of the first (a) and last (b) return of a multispectral ALS laser beam.
Figure 1. Test area: colour composition of multispectral laser scanning intensity (R-NIR, G-SWIR, B-G) overlaying the shaded digital surface model
a
b
Another decision to be made was selection of the method for intensity raster preparation. Various options for the generation of an intensity reflectance raster were considered, using filtering the ALS data by return number and selecting a different interpolation method (i.e., nearest neighbour, average, maximum) for intensity value determination in a process of resampling. The image intensity of the first return shows the spectral properties of objects relevant to the classification of land cover/use. Further rasters of reflection intensity can be generated from subsequent returns (second, third, fourth, etc.). Nevertheless, the successive return for the intensity raster creation will be selected; the areas where no pulse was recorded would be wider. Successive returns are in the minority. It was decided, therefore, to generate reflection intensity rasters of last returns and to check their usefulness, which can offer information about areas covered by vegetation. Finally, it was decided that the first return will be used for basic experiments and, additionally, the influence of the intensity raster of the last return will be evaluated during tests. Multispectral ALS data, then, provide three intensity rasters for the first, and three for the last return. As an interpolation, the nearest neighbour method was selected to avoid using the spectral values of laser beam responses other than the original ones, as a basic option. The influence of the other interpolation method was checked during the experiment. In occluded areas in which no data were noted, the linear void fill method was used.
2.2 Class number definition
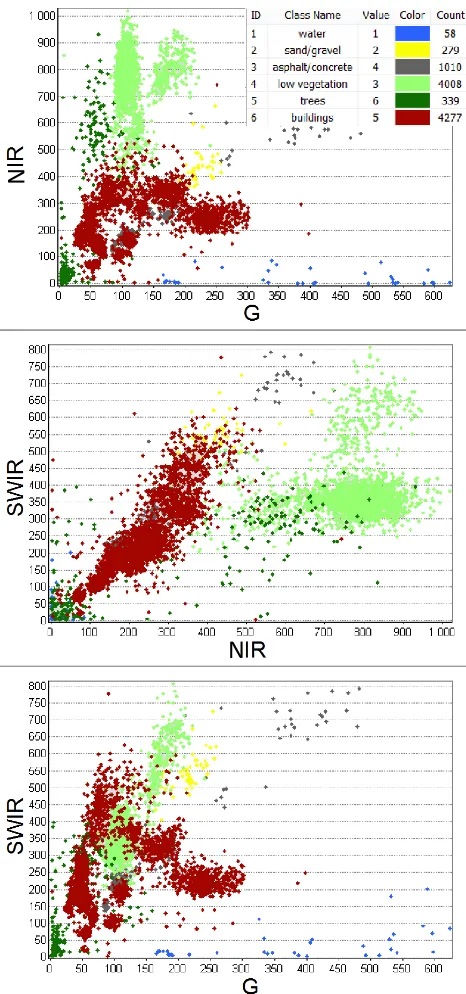
In analysing the colour composition of a laser beam intensity image, few objects can be distinguished visually (Figure 1). Buildings with roofs made of various materials and of different colours can be clearly seen. In visual interpretation, pools of water are much better distinguished than water in a lake, which is characterized by diverse spectral information. Many kinds of impervious surfaces, and also uncovered ground, are presented in this composition. Airborne laser scanning datasets are usually the subject of geometric classification including multispectral ALS data (Witchamnn et al., 2015). Classified point clouds, with distinguished surfaces, i.e., ground, low, medium and high vegetation, buildings and water surfaces, do not fully comply with the requirements of mapping land/use cover. To take up the challenge of spectral classification of information provided by multispectral laser scanning technology and the potential of these data indicated by Bakuła (2015), it was decided to take a closer look at skater plots showing the intensity values of reflections achieved from objects vectorized as training fields (Figure 3). On analysing the graphs, a large variety of reflections for “water”, “trees” and uncovered areas were noted. “Buildings” are aggregated in a visible groups of objects, some of which represent quite similar spectral characteristics as the road. These findings coincide with the visual interpretation of the composition prepared from multispectral ALS data.
After the analysis of scatter plots, visual interpretation and additional pre-processed supervised classification, it was decided that six land cover/use classes could be distinguished: (1) “water”, (2) non-vegetation permeable area (“sand/gravel”, etc.), (3) non-vegetation impermeable area (“asphalt/concrete”, etc.), (4) “low vegetation”, (5) “trees” and (6) “buildings”.
Figure 3. Scatter plots for laser intensity reflections at different wavelengths of multispectral ALS for training fields
2.3 Approaches in classification
The usefulness of the analysed data to create land cover/use maps has been examined in several variants, to evaluate the influence of the type of data and the method of their processing on the classification results. The following approaches leading to the final method were investigated:
Approach 1. Spectral classification of the ALS intensity raster: supervised classification using the maximum likelihood rule. Performed in the following variants:
based on the intensity of the first return – variant 1a; based on the intensity of the last return – variant 1b;
based on the intensities of the first and last return – variant 1ab.
N
N
The purpose of this part of the study was to evaluate the efficacy of using only ALS spectral data, and to examine the effects of the use of data from rasters containing a reflection intensity from a return other than the first.
Approach 2. Spectral classification with the additional use of elevation data: in this variant, the results of the first approach and elevation data – nDSM – were used. The classification model consists of the following steps: (1) extraction of high and low classes of objects based on the nDSM; (2) extraction of target classes based on training fields developed for Approach 1, according to the following rules:
high objects (greater than 2m): buildings and trees,
low objects: other classes.
Just as in Approach 1, the rating was made in three versions depending on the intensity of the various intensity rasters using information from various returns (variant 2a – for the first return, variant 2b – for the last return, variant 2ab – for the use of both the first and last returns). In both approaches, various interpolation methods for the creation of intensity rasters were also tested using the nearest neighbour, average and maximum options.
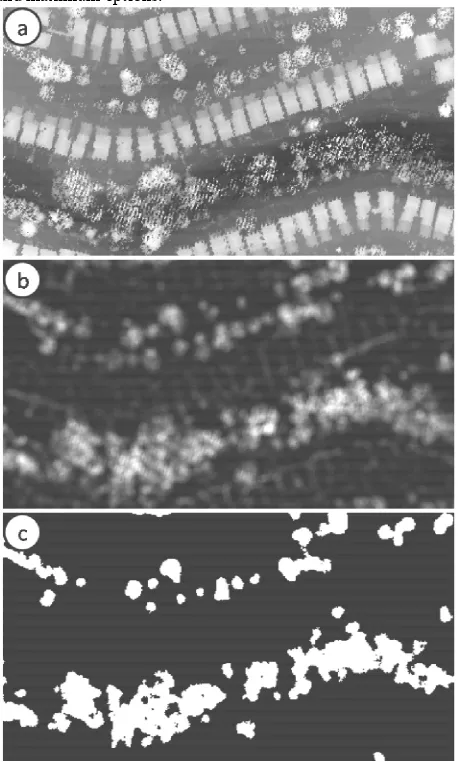
Figure 4. a) Elevation model built using the last return; the specific high-textured form of trees can be seen; b) granulometric map – the result of the granulometric analysis of
the image “a” – bright pixels mark the high texture in the image; c) binary mask of the granulometric map, indicating areas with a high texture, used to remove pixels misclassified
as buildings from the class of trees
Approach 3. Classification with the use of additional information on water depth: typically, in the case of using classic multispectral images, generated using optical remote sensing systems, water is one of the easiest land cover classes to extract, especially because of the strong absorption of infrared. In the tested case, the situation is different; hence the need for the mask of water, based on elevation data. In our experiment, we used a model based on the information regarding the bathymetric information received using green band ALS data. The water depth has been determined on the basis of the following formula (2):
water depth = DTM (G) - DTM (NIR) (2)
where:
DTM (G) is the DTM generated from points acquired with a green laser wavelength from the classes: ground and lakebed, last return
DTM (NIR) is the DTM generated from points acquired with an near-infrared laser wavelength from the classes: ground and water, last return
Areas in which the water depth reached a value of less than -1 m were assigned to the mask water, to increase the detection of a class of “water”. The mask replaced the “water” class extracted in Approach 2. In this way, the best classification variant from Approach 2 was improved, resulting in variant 3 ab.
Approach 4. The classification approach using additional morphological and granulometric transformations: the use of additional processing based on, among other things, the specific characteristics of elevation data, may allow an additional increase in classification accuracy. Due to the relatively high similarity of the registered intensity, there were problems with the distinction between two classes: trees and buildings. Use of the elevation data could not be a solution, because of the similar height of objects belonging to both classes. In order to improve the misclassification, the elevation model built using the last return was used. In such a model, the trees, due to their structure, are imaged with a great diversity, causing the high texture of the image of the elevation model (Figure 4a). This image was processed using granulometric analysis (Mering, et al., 1996; Mering, Chopin, 2002; Kupidura et al., 2010; Kupidura, 2010, 2015), allowing the effective localization of areas with a high texture. The result of the analysis – a granulometric map (Figure 4b) – was binarized to obtain the mask of areas with a strong structure (Figure 4c):
variant 4 ab m. In the following step, an alternate filtration by reconstruction (Serra, 1982; Soille, 1999) increased the classification accuracy by removing the single misclassified pixels in other classes of land – variant 4 ab m + f. This is a morphological filtering, which consists of alternating use of the opening and closing operations by the reconstitution. These operations allow us to remove small objects from the image, while not changing the shape of the objects that are not deleted.
2.4 Evaluation methods
In order to estimate the accuracy of the results for individual variants of classification, the reference map was vectorized for the whole test area with the separation of all required classes (Figure 5b). Subsequently, by comparing analysed results of the classification with the reference map, a matrix of errors was formed to calculate the following parameters: overall
accuracy (Congalton, 1991) and kappa index (Cohen, 1960; Congalton, 1991), allowing us to estimate the efficiency of the classification as well as Producer's Accuracy - PA (completeness) and User's Accuracy - UA (correctness).
3. RESULTS
The results of the introduced approaches of multispectral ALS data classification are presented in Appendix. The visual effect of the classification is presented in Figure 8.
3.1. Results of Approach 1: spectral classification of reflectance intensity rasters
Spectral classification results are of a very low accuracy. Depending on the variant resampling method of intensity raster, the kappa varied from 0.244 to 0.312. This was caused by a large spectral similarity between three classes:
"sand/gravel", "asphalt/concrete" and "buildings", which is also a typical problem with land cover classification using optical, multispectral images. In addition, the accuracy of “water” determination is very low in this approach. In classical (passive) spectral classification – using images obtained with an optical system – water is usually easy to distinguish, particularly with using near-infrared or mid-infrared images. In this case, even though infrared channels were used, the diversity of the reflection intensity of the laser beam for “water” was very high, which resulted in a huge problem with the distinction of this class. The second of the observed differences between the outcomes and the results of a typical (optical) spectral classification is a relatively high error of classification of “trees” as “buildings”, which was caused by the similarity of the intensity of the reflection “trees”, even in the infrared wavelength, and consequently a texture in the raster resulting in a geometric structure of the “trees”.
Figure 5. a) colour composition R-IR, G-SWIR, B-G, b) reference mask, c) Approach 1ab, d) Approach 2ab, e) Approach 3ab, f) Approach 4ab m+f; “water” – blue, “sand/gravel” – yellow, “low vegetation” – green, “asphalt/concrete” – grey, “buildings” –
brown, “trees” – dark green
Figure 6. Producer’s and User’s accuracy of land cover/use classification for the different interpolation methods of multispectral ALS intensity rasters, in approaches using spectral classification (variants of Approach 1) supported by the nDSM (variants of
Approach 2)
Figure 7. Producer’s and User’s accuracy of land cover/use classification for approaches using first (a), last (b) and both: first and last (ab) echo number of laser beams from multispectral ALS data, during intensity raster creation approaches using spectral classification of ALS intensity rasters (variants of Approach 1) supported by the nDSM (variants of Approach 2)
3.2. Results of Approach 2: using the nDSM
Use of additional elevation data significantly improved (by more than two and even three times) the accuracy of classification in all tested scenarios. The improvement is mainly due to a much better distinction between buildings and sand/gravel or asphalt/concrete, but also due to the better distinguishing of trees from low vegetation. Accuracy of the extraction of the water class (very low completeness in Approach 1) also improved significantly. The problem of misclassification of areas of the classes "sand/gravel" and "asphalt/concrete" remained largely unresolved, because of the
lack of distinctive features allowing us to clearly distinguish these two classes from each other; these areas are very similar in the context of both spectral and elevation data. The accuracy of these classes improved, however, as a result of the higher accuracy of other classes (mainly "buildings").
3.3 Impact of the interpolation method and different returns of the laser beam in the generation of reflection intensity rasters
It was observed that the interpolation method in resampling has had an influence on the results. In the case of using a
single return of the laser beam, the best result was obtained for the maximum method (MAX), due in large part to the highest accuracy of “water” extraction. It should be noted, however, that despite the noticeable improvement as compared to the interpolation with the nearest neighbour method (NN), the results are still fairly low in the approach using only spectral information (Approach 1). Similarly, in Approach 2, using additional elevation information, differences in the classification accuracy were observed (the best resampling interpolation method was MAX; the worst was NN). In this approach, these differences were less than in Approach 1. This was caused by the much more accurate extraction of water in all variants.
Figure 6 presents the results of classification with different interpolation methods for distinguished land cover/use class. For the maximum value interpolation method, better results of completeness for “water” can be noted, besides an increase in the accuracy for “asphalt/concrete” as well as the decrease in correctness for low vegetation. The influence is much higher for the approach using only spectral information (Approach 1). For Approach 2 where elevation information was included, large differences between the results for various interpolation methods for intensity rasters were not noticed.
Analysis of the influence of alternative uses of the last return intensity raster, or both first and last return intensity raster, is presented in Figure 7. The slight increase in classification accuracy has also been observed in both the intensity of the first and last return of laser beam (Figure 5c), wherein the improvement is even less significant in Approach 1 (kappa increased from 0.248 to only 0.254 in Approach 1, and from 0.808 to 0.831 in Approach 2). Analysing the impact of the use of first and last return to specific classes of land cover/use uncovered a significant improvement in PA for "trees" and slightly better results for "sand/gravel" in both approaches. Improvement of the UA for buildings was also noticed for Approach 2, where elevation information was included. Among the variants tested in this analysis, the best results were achieved with a combination of both intensity rasters: the first and last of all three laser wavelengths (variant of ab; Figure 5d). Therefore, this variant was selected for further work on the model of classification.
3.4. Result of Approach 3: using an additional water depth mask
The solution proposed in this approach was studied only on the best variant obtained in Approach 2: ab. The difference consisted in the approach to the water class extraction. Instead of a spectral approach using elevation data, we generated mask water, based only on the elevation data, i.e., the raster water depth model (Formula 2). As a result, we observed the improvement in accuracy of extraction of this class and also of other classes, partly mistaken for “water” (Figure 5e). A noteworthy result is the very high accuracy of the separation of water quality on the basis of the proposed approach: with a Producer's Accuracy of 98.6% and a User's Accuracy of 99.8%. This approach also managed to extract most of the pools, which were very problematic in the previous approaches. Overall accuracy increased from 87.3% to 88.5%, a kappa of 0.831 to 0.846.
3.5. Result of Approach 4: using additional morphological and granulometric transformation
In the first step of this approach, we applied a granulometric analysis on the image of the elevation model generated from the last return. This allowed us to improve the accuracy of the separation of both "high" classes, buildings and trees, by eliminating pixels misclassified as buildings in the class of trees. This resulted in the improvement of classification accuracy. The improvement is not very large, but it is unambiguous (with kappa = 0.846 for kappa = 0.854).
The second step of Approach 4 was morphological alternate filtration by reconstruction. It allowed further improvement of the classification accuracy: from kappa = 0.854 to kappa = 0.878 (the resulting image is presented in Figure 5f). The improvement in results occurred in virtually all classes, apart from the class of water.
4. CONCLUSION
The presented research proved the usefulness of multispectral airborne laser scanning in land cover and land use mapping. Additional use of elevation data (nDSM) was a key factor in increasing the accuracy of the classification, especially to distinguish objects for which height is a distinctive feature. Use of the nDSM allowed us to separate the buildings from the other two similar classes (“sand/gravel” and “asphalt/concrete”), increasing the accuracy of the separation of “trees”, but also for the “water” surface. All this contributed to the significant, almost three-fold, improvement of the classification accuracy.
Selecting different interpolation methods during the creation of a reflection intensity raster has an impact on the results, particularly when only spectral information (only intensity rasters) is considered. For the method of raster intensity pixel interpolation, the methods of average and maximum appeared to be slightly better (by approximately a few hundredths of kappa) than nearest neighbour. In the case of the classification also using elevation data, this factor did not have a significant influence on the evaluated accuracy of the results. Separation of the intensity, particularly the use of data from both the first and last reflection, helped to increase the classification accuracy. This is due to the different characteristics of the different returns, especially in the case of high vegetation (trees) that enhanced the ability to distinguish that class from the others. However, the spectral classification accuracy in the test scenario was very low. The most important cause of this was the selection of classes, partly very similar to each other, spectrally (“sand/gravel”, “asphalt/concrete” and “buildings”), but also problems with the separation of “water”. The first problem is typical for spectral classification, whereas in the case of conventional optical spectral images, the extraction of water is usually very easy, due to the strong absorption of radiation in the infrared. In the present case, images of the ALS intensity absorbing effect do not occur to an extent that would allow for efficient separation of this class.
Using information about the depth of the water supplied by the green ALS allowed for high precision (approximately 99%), clearly better than the water separation based on the spectral approach combined with the use of the nDSM. It was observed that trees, due to their diverse geometrical structures, were characterized by a large variety of DNs on the intensity of reflection images, which resulted in the difficulty of
distinguishing them from other classes, particularly the class of buildings. However, the same phenomenon is the cause of high texture of trees in the image of elevation data that are built based on the last return. Texture analysis, using granulometric operations, conducted on this image provided promising results. The technique helped to improve this distinction significantly. Additionally, morphological filtering enabled the further increase of classification accuracy.
In comparing the characteristics of ALS intensity to classic optical multispectral images, we noticed some important differences – mainly disadvantages when only spectral information is considered – potentially affecting the use of ALS intensity data in a classification of land use/cover. However, the additional use of elevation data, primarily the nDSM but also other characteristics of selected objects in images of various reflections, can compensate for the deficiencies observed, which makes the multispectral ALS data useful for the classification of land use/cover.
ACKNOWLEDGEMENTS
We would like to thank Optech Inc. for providing the data from the Titan scanner. In particular, we would like to offer our thanks to Mr. Michael Zarzeczny for his presentation of the Titan system.
REFERENCE
Bakuła K. 2015. Multispectral airborne laser scanning - a new trend in the development of LiDAR technology, Archiwum Fotogrametrii, Kartografii i Teledetekcji, 27, pp. 25-44. Benediktsson, J.A., Swain, P.H., Ersoy, O.K. 1990. Neural Network Approaches Versus Statistical Methods in Classification of Multisource Remote Sensing Data. IEEE Transactions on Geoscience and Remote Sensing, 28(4), pp. 540-552.
Beucher, S., Lanteujoul, C. 1979. Use of Watershed in Contour Detection. International Workshop on image processing: Real-time Edge and Notion detection/estimation.
Blaschke, T., Lang, S., Lorup, E., Strobl, J., Zeil, P. 2000. Object-Oriented Image Processing in an Integrated GIS/Remote Sensing Environment and Perspectives for Environmental Applications. Environmental information for planning, politics and the public, 2, pp. 555-570.
Bosch, E.H. 1999. Texture information and supervised classification of hyperspectral imagery by means of neural networks. GeoComputation 99.
Briese C., Pfennigbauer M., Ullrich A., Doneus M. 2013. Multi-wavelength airborne laser scanning for archaeological prospection. International Archives of Photogrammetry, Remote Sensing and Spatial Information Science, 40, pp. 119-124.
Campbell, J.B. 2008. Introduction to Remote Sensing, Fourth Edition. The Guilford Press, London, pp. 626.
Chmiel, J. 2002. Przykład wykorzystania sieci neuronowych w cyfrowej klasyfikacji pokrycia terenu. Archiwum Fotogrametrii, Kartografii i Teledetekcji, 12a, pp. 63-78. Cohen, J. 1960. A coefficient of agreement for nominal scales.
Educational and Psychological Measurement, 20(1), pp. 37-46.
Congalton, R. 1991. A Review of Assessing the Accuracy of Classifications of Remotly Sensed Data. Remote Sensing of Environment, 37, pp. 35-46.
Darling, E.M., Joseph, R.D. 1968. Pattern recognition from satellite altitudes. IEEE Transactions on Systems, Man and Cybernetics, SMC-4, pp. 30-47.
Gurney, C.M., Townshend, J.R.G. 1983. The use of Contextual Information in the Classification of Remotely Sensed Data.
Photogrammetric Engineering and Remote Sensing, 49, pp. 55-46.
Haralick, R.M., Shanmugam, K., Dinstein, I. 1973. Textural Features for Image Classification. IEEE Transactions on Systems, Man and Cybernetics, SMC-3 (6), pp. 610-621. Jackson, Q., Landgrebe, D. 2002. Adaptive Bayesian Contextual Classification Based on Markov Random Fields.
IEEE Transactions on Geoscience and Remote Sensing, 40(11), pp. 2454-2463.
Kupidura, P. 2010. Semi-automatic method for a built-up area intensity survey using morphological granulometry. The Problems of Landscape Ecology, 38, pp. 271-277.
Kupidura, P. 2015. Wykorzystanie granulometrii obrazowej w klasyfikacji treści zdjęć satelitarnych. Prace Naukowe, Geodezja, 55, Publishing House of Warsaw University of Technology, Warsaw.
Kupidura, P., Koza, P., Marciniak, J. 2010. Morfologia matematyczna w teledetekcji. Polish Scientific Publishers, Warsaw, pp. 250.
Lam, N.S.N. 1990. Description and Measurement of Landsat TM Images Using Fractals. Photogrammetric Engineering and Remote Sensing, 56(2), pp. 187-195.
Mering, C., Callot, Y., Kemmouche, A. 1996. Analysis and Mapping of Natural Landscapes from Satellite Images Using Morphological Filters. Microscopy, Microanalysis, Microstructures, 7, pp. 323-330.
Mering, C. Chopin, F. 2002. Granulometric maps from high resolution satellite images. Image Analysis and Stereology., 21, pp. 19-24.
Pfennigbauer M., Ullrich A. 2011. Multi-wavelength airborne laser scanning. Proceedings of the International Lidar Mapping Forum, ILMF, New Orleans.
Pluto-Kossakowska, J. 2003. Analiza metod przetwarzania i interpretacji zdjęć satelitarnych SPOT z punktu widzenia potrzeb systemu informacji o glebach. PhD thesis, Warsaw University of Technology.
Robertson, T.V. 1973. Extraction and Classification of Objects in Multispectral Images. LARS Symposia, Paper 21.
van Rees, E. (2015). The First Multispectral Airborne Lidar Sensor. GeoInformatics, 18(1), pp. 10-12.
Serra, J. 1982. Image Analysis and Mathematical Morphology, Vol. 1. Academic Press, London.
Soille, P. 1999. Morphological Image Analysis. Springer Verlag, Berlin.
Wichmann V., Bremer M., Lindenberger J., Rutzinger M., Georges C., Petrini-Monteferri F. 2015. Evaluating the potential of multispectral airborne LiDAR for topographic mapping and land cover classification. ISPRS Annals of the Photogrammetry, Remote Sensing and Spatial Information Sciences, 1, 113-119.
APPENDIX
The results of all approaches within the experiment, assessed by Producer’s and User’s accuracy, the kappa index and the overall accuracy index.
approach
Classes
kappa overall accuracy water sand/gravel low vegetation asphalt/
concrete buildings trees PA
[%] UA [%] [%] PA [%] UA [%] PA UA [%] [%] PA [%] UA [%] PA UA [%] [%] PA UA [%]
1a NN 2.9 78.7 27.6 40.2 52.7 81.3 50.5 24.8 46.9 29.2 79.8 34.4 0.248 37.2 1a AV 12.3 77.0 23.4 47.3 52.2 79.5 50.7 38.4 61.8 30.1 80.1 35.2 0.297 42.3 1a MAX 16.7 83.5 28.9 44.8 55.0 69.6 49.3 44.3 51.4 25.7 81.7 36.9 0.312 43.8
1b NN 8.4 64.8 25.8 43.3 57.3 91.0 53.3 23.2 46.5 30.1 65.4 31.8 0.244 37.4
1ab NN 2.9 79.2 24.7 49.8 50.1 91.9 44.9 28.1 38.6 20.8 92.6 36.5 0.254 38.0
2a NN 95.8 99.6 27.5 44.3 78.9 80.5 74.0 69.2 90.0 66.8 81.3 86.8 0.808 85.5 2a AV 96.0 99.2 23.3 51.7 78.6 82.7 78.0 69.7 91.3 67.6 82.8 88.4 0.819 86.4 2a MAX 96.2 98.8 28.8 50.3 77.2 83.0 76.6 69.1 89.6 73.1 87.0 87.8 0.826 86.9 2b NN 96.0 99.6 25.7 47.0 79.0 81.7 76.2 69.8 89.8 57.7 72.4 85.7 0.788 84.0
2ab NN 95.7 99.7 24.7 52.8 82.3 78.2 71.4 71.7 85.0 83.7 91.2 84.0 0.831 87.3
3ab 98.6 99.8 24.7 53.0 82.2 82.0 71.8 73.9 85.0 83.7 91.2 84.0 0.846 88.5
4ab m 98.6 99.8 24.7 53.0 82.2 82.0 71.8 73.9 84.5 90.2 94.3 84.2 0.854 89.1 4ab m+f 98.6 99.8 17.4 95.6 86.1 81.9 72.8 76.7 95.1 84.8 95.3 91.4 0.878 90.9