INFLUENCE OF RAW IMAGE PREPROCESSING AND OTHER SELECTED
PROCESSES ON ACCURACY OF CLOSE-RANGE PHOTOGRAMMETRIC SYSTEMS
ACCORDING TO VDI 2634
J. Reznicek*, T. Luhmann, Ch. Jepping
Jade University of Applied Sciences, Institute for Applied Photogrammetry and Geoinformatics, Oldenburg, Germany jan.reznicek@jade-hs.de, thomas.luhmann@jade-hs.de, christian.jepping@jade-hs.de
Commission V, WG V/1
KEY WORDS: Photogrammetry, Image processing, Circular targets, Accuracy, Precision, Stability, Camera calibration
ABSTRACT:
This paper examines the influence of raw image preprocessing and other selected processes on the accuracy of close-range photogrammetric measurement. The examined processes and features includes: raw image preprocessing, sensor unflatness, distance-dependent lens distortion, extending the input observations (image measurements) by incorporating all RGB colour channels, ellipse centre eccentricity and target detecting. The examination of each effect is carried out experimentally by performing the validation procedure proposed in the German VDI guideline 2634/1. The validation procedure is based on performing standard photogrammetric measurements of high-accurate calibrated measuring lines (multi-scale bars) with known lengths (typical uncertainty = 5 µm at 2 sigma). The comparison of the measured lengths with the known values gives the maximum length measurement error LME, which characterize the accuracy of the validated photogrammetric system. For higher reliability the VDI test field was photographed ten times independently with the same configuration and camera settings. The images were acquired with the metric ALPA 12WA camera. The tests are performed on all ten measurements which gives the possibility to measure the repeatability of the estimated parameters as well. The influences are examined by comparing the quality characteristics of the reference and tested settings.
1. INTRODUCTION
Photogrammetry is a measurement method based on a large number of hardware and software components, and also on the user skills. The high complexity of the photogrammetric system requires a good knowledge of the behaviour and the proper settings of its components, which are a potential source of the systematic or random errors. This paper examines the influence of the raw image preprocessing and other selected processes on the accuracy of close-range photogrammetric measurements. The examined processes and features include:
• raw image preprocessing, • sensor unflatness,
• distance-dependent lens distortion,
• extending the input observations by incorporating all RGB colour channels,
• ellipse centre eccentricity, • target detecting.
All these issues have been already described and treated in the past by various authors, but at that time, the performance of digital sensors, computers and reference gauges was often limited in comparison with today’s possibilities. The accuracy of each tested configuration of the photogrammetric system is measured with using a unique set of 7 highly precise measuring lines (multi-scale bars) giving 58 calibrated lengths for comparison. Our approach to testing various influences is unique also in including the factor of repeatability of the photogrammetric system performance. The repeatability, which depends on the stability of the system, is in most of the similar works not treated despite its high influence in interpreting the results. The influence is significant, because the stability of most photogrammetric systems based on a non-proprietary camera device is low.
The raw image preprocessing consists of the following steps (this is just a selection of the main components of the workflow): dark-frame subtraction (this includes fixed pattern noise, thermal noise, hardware-specific bias etc.), linearization, vignetting correction, white colour balancing, demosaicing, colour space conversion, brightness and gamma correction, noise filtering, bit depth reduction in export, compression etc. Most of the literature deals with each of the preprocessing step separately. The influence of various demosaicing approaches on accuracy of the photogrammetric measurement is treated in Stamatopoulos et al. (2012). JPEG compression is studied in Li et al. (2002). The quantization error given by the bit depth reduction process before the image export into a typical 8-bit format is examined in Trinder et al. (1995) or Matsuoka et al. (2011). The unflatness factor was extensively examined in the analog era, where the sensor was represented by a geometrically unstable film material. Today, the effect of the digital sensor unflatness is much lower. More details can be found in Fraser et al. (1995) or Tecklenburg et al. (2001). A large number of papers and literature studies the well-known effect of the distance-dependent lens distortion (Magill 1954, Brown 1971, Dold 1997, Bräuer-Burchardt et al. 2006, Luhmann et al. 2006a, Miks et al. 2012). The issue of the ellipse centre eccentricity is well described in Dold (1997) or Luhmann (2014). Influence of the various ellipse target detectors is studied in Trinder et al. (1995) or Quellet et al. (2009).
2. EVALUATION PROCEDURE
retro-reflective targets. Typical uncertainty of the calibrated length is 5 µm at 2 sigma. The measuring lines are arranged in a volume (2×2×2 m) set up by an aluminium profile system (see Fig. 1). The profiles are covered with coded and non-coded circular retro-reflective targets needed as tie points for the measurement. The comparison of each of the measured length with the calibrated value gives the quality parameter length measurement error (LME). The maximum LME characterizes the absolute accuracy of the validated photogrammetric system. The acceptance test has been performed 10 times independently with the same configuration and camera settings in order to ensure higher reliability of the evaluation.
2.1 Photogrammetric system
2.1.1 Camera: ALPA metric 12WA with a digital back Leaf Aptus 75 (14bit, 6666×4992 pixels, pixel size: 7.2 µm), lens Schneider-Kreuznach Apo-digitar 5.6/35 with mechanical shutter COPAL – N 0.0. The lens has no moving element inside (no focusing available). The camera was equipped with a ring flash mounted on the lens (see Fig. 1).
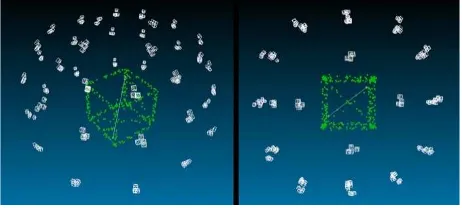
Figure 1. Left – VDI reference object, right – ALPA camera.
2.1.2 Software: All measurements were processed in software (SW) AICON 3D Studio v10, unless stated otherwise. Dimensional scaling was realized by using the largest calibrated length.
2.2 Image acquisition
The images of the reference object were acquired from 12 positions around the object in three levels (ground level, three-step ladder, tall ladder) plus four positions around the object, as close as possible, from top of the tall ladder (see Fig. 2). On each position, four images were taken with 90° roll around the optical axis. The total number of acquired images in each measurement is approximately 160.
Figure 2. Image positions. Left – iso view, right – top view.
2.3 Image preprocessing
The images, recorded in raw format *.mos, have been converted by using DCRAW converter and processed with a self-developed program in Matlab language. The settings of the converter and processing are shown in Table 1.
Input format *.mos Gama adjustment none DCRAW options –D –4 –T Demosaicing high quality
linear interp. Black point crop 0
White point crop 2^14–1 Channel export only green Colour balancing none Output bit-depth 8-bit Colour model transform. none Output format *.tif Brightness adjustment none Output colour mode grayscale
Table 1. Settings of the converter and Matlab processing.
2.4 Evaluation characteristics
Comparing the measured lengths with the calibrated values give us a set of 58 length measurement errors. Maximum absolute value is denoted as LMEMAX 1, while the root mean square is denoted as LMERMS 1. An additional evaluation has been performed where the calibrated lengths were replaced by values that are calculated by averaging corresponding measured lengths from all 10 measurements. The corresponding characteristics are denoted as LMEMAX 2 and LMERMS 2. Such evaluation is advantageous as it eliminates the systematic component of the error in measurement. Therefore it is possible to see the random component of the error and to make reliable conclusions about the unknown remaining systematic effects. It is obvious that both characteristics (LMEMAX 2, LMERMS 2) are much lower in comparison to the first ones. This evaluation is not common in similar works because it requires 10 times more measurements and processing. The first type of evaluation characterises the accuracy of the photogrammetric system while the second type characterises the precision of the system. All 4 characteristics are reported graphically for each measurement.
3. EXAMINATION OF THE INFLUENCES
Each of the tested influences is examined here. All results are summarised in the table given at the end of this chapter.
3.1 Reference quality
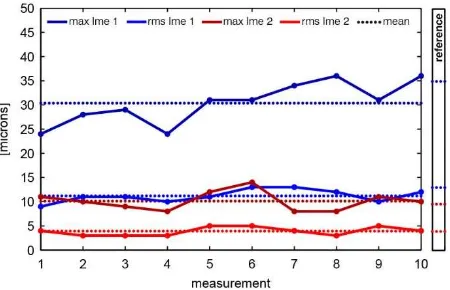
In order to reference the estimated characteristics, the measurements were processed as described in the previous chapter, with no special treatment. As can be seen in Fig. 3, the measured quality of the photogrammetric system is very high (LMEMAX = 40µm) in comparison to similar systems used in practice. The main reason for reaching such a high accuracy is the use of the ALPA metric camera which is known (Rieke-Zapp, 2010) for high stability of its components and their couplings. The results show a significant unknown systematic error in measurements (compare type 1 and type 2 LME). The remaining random error is very low (mean LMERMS 2 = 4 µm).
3.2 Influence of typical raw image to JPG conversion
Typical raw image to JPG conversion includes the following steps: Bias removal, white-colour balancing, demosaicing, colour space conversion, brightness and gamma correction, 16 to 8 bit reduction and JPG compression. The examination of each step is beyond the scope of this paper. Therefore, the influence of the whole conversion procedure will be tested by replacing the grayscale images used in the reference project with the images converted to JPG format (full RGB, but only the green channel is used in AICON SW). The raw images recorded by LEAF sensor in proprietary *.mos format were converted by using Adobe Camera Raw 8.7.1 convertor. A non-proprietary convertor had to be used because the sensor manufacturer does not provide its own convertor. All processing enhancements such as brightness, sharpening, noise correction, tone correction, etc. were deactivated, or set to zero. The new computation was performed with AICON 3D Studio. An unexpected improvement in quality characteristics can be observed in Fig. 4. Additional analysis has shown that the improvement is caused by a larger amount of detected targets on JPG images (by 8 %). Due to various steps in the conversion process, the targets appear to the detecting algorithm as having a larger diameter. Hence, the group of small targets, originally rejected in the reference project, are validated and used.
Figure 4. Quality characteristics (typical raw image to JPG conversion)
3.3 Reference quality with different target detector settings
The reference quality project has been recomputed again with different target detector settings in order to confirm the previous findings. Two values in the settings were changed: minimum
target diameter threshold was decreased from 8 to 6 pixels and the contrast threshold (target foreground/background) was decreased from 30 to 15 %. These changes increased the number of detected targets by 19 % (in comparison to the reference project) and the overall quality has increased as well, which can be observed in Fig. 5. This confirms our hypothesis given in the previous section.
3.4 Influence of typical raw image to JPG conversion examined by comparing the synchronised datasets
By comparing two previously given graphs, it should be possible to study the influence of the typical raw image to JPG conversion. However the number of detected targets in each project is different, which leads to a significant bias in the quality characteristics comparison. For this reason, a new processing of those two datasets was performed with the following modification of the datasets: Both sets of the detected image coordinates were synchronised which ensures an equal number of observations. Therefore, the difference in the input observations is only in the image coordinate differences given by JPG conversion process. The results are shown in Fig. 6 (standard images) and Fig. 7 (JPG images).
Figure 6. Quality characteristics (reference quality with different target detector settings and synchronisation)
Figure 7. Quality characteristics (typical raw image to JPG conversion and synchronisation)
The results presented in Table 2 and visually in two graphs shown above leads to the conclusion that the typical raw image to JPG conversion does not significantly change the quality of the measurement.
3.5 Systematic pattern in image residuals
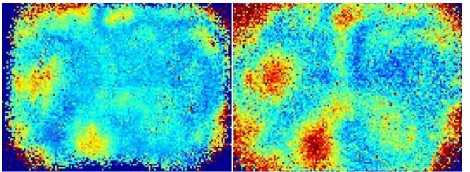
Due to the large number of measurements, it is interesting to analyse the randomness of the image residuals. These were collected from all images and all measurements and all colour channels (≈ 350 000 in total!) and were superimposed into a one three-dimensional matrix (1. dim.: x-residuals, 2. dim.: y-residuals, 3. dim.: L2 norm). The matrix resolution was lower than the resolution of the image, in order to ensure that each cell (pixel) will collect a significant number of samples (26 samples on average). The final residual in each dimension was calculated as a mean value of the samples. The visualisation of the superimposed residuals shows a systematic pattern in both axes (visible division line in the middle of the y-residuals seen in Fig. 10 is an unknown effect related to the used ALPA camera).
Figure 8. Superimposition of the image residuals (L2 norm). Left – measurement task described in the paper, right – measurement task from different project. Scale: 0–1 µm.
In order to evaluate the reliability of this pattern, an additional superimposition has been performed with the same camera but with totally different measurements (Reznicek et al., 2016) taken from another project (different shape and dimensions of the measured object, different configurations of the image poses etc.). A highly correlated pattern was observed in the second superimposition as well (see Fig. 8). The corrections to image coordinates, based on the observed pattern, have been applied and all measurements have been recomputed using Ax.Ori software. The results are shown in Fig. 9.
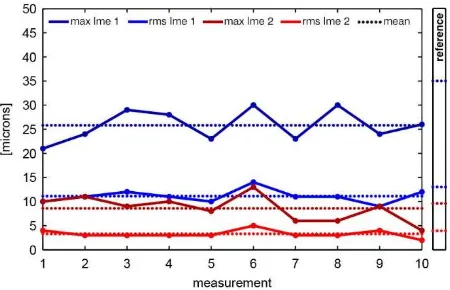
Figure 9. Quality characteristics (systematic pattern correction)
The LMEMAX 1 has decreased by 14 % to 30 µm in mean value. Other characteristics did not change significantly. As depicted in Fig. 10, the new residuals decreased by 30 % (0.3→0.2 µm in rms). The systematic pattern is still visible, but is very low. The ALPA-specific effect in y-residuals has been eliminated.
Figure 10. Superimposition of the image residuals in x (upper part) and y (lower part) coordinates. Left – a priori, right – a posteriori. A posteriori images were generated by using only the green channel. Scale: –1.5 to 1.5 µm.
Theoretical simulation. The universal validity of the presented approach for the correction of the local systematic errors is questionable (the optimistic results could be based on the ideal test configuration), since the residual minimization process has no local-based unifying behaviour and the results are strongly influenced by the configuration of the image positions. In order to evaluate the validity and potential of such an approach a theoretical simulation has been performed. Ideal error-free image coordinates were simulated and corrupted by a simulated unflatness of the sensor (the simulation was based on the real findings shown in Fig. 8). In addition Gaussian noise (σ=0.3 µm) was added to the corrupted image coordinates to simulate the typical reality. Then, the simulated dataset was processed with the same approach as the real dataset and the final superimposition of the new image residuals are compared with the ground truth – the simulated sensor unflatness. The results are shown in Fig. 11. The sensor unflatness was computed with quite a good match, but the remaining errors still exists. A better solution for correcting the unflatness could be provided by the method of finite elements (Tecklenburg et al., 2001).
3.6 Influence of the distance-dependent distortion
It is a well-known fact that the lens aberration depends on the magnification of the optical system. The magnification varies with the z-coordinate (in case where optical axis = z-axis) of the corresponding target. This effect is very small (in comparison to other sources of error) for low magnifications (typically in aerial photogrammetry) and is always neglected. In case of close-range photogrammetric measurement tasks, the effect could be significant. The influence of distance-dependent distortion is tested here by using Ax.Ori distance-dependent function. The measurements were recomputed in Ax.Ori with activation of the distance-dependent correction parameters (D1, D2). The function is modelled in Ax.Ori with following equation (Luhmann et al., 2006a):
∆�= �1�(�
2− �
02) +�2�(�4− �04)
�31(� − �0) +�32(� − �0) +�33(� − �0) (1)
where Δr = correction term r = radial distance
r0 = radial distance with zero distortion X0, Y0, Z0 = coordinates of the projection centre X, Y, Z = object coordinates
r31, r32, r33 = rotation parameters
The LMEMAX 1 decreased by 11 % to 31 µm in mean value and the LMERMS 1 from 13 to 12 µm. Other characteristics did not change significantly.
Figure 12. Quality characteristics (distance-dependent distortion)
3.7 Combination of the systematic pattern and the distance-dependent distortion
Combining the systematic pattern correction with the distance-dependent parameters gives a significant increase of the quality characteristics (see Fig. 13).
3.8 Influence of using all colour channels
In a typical photogrammetric software, the targets are usually detected only in the green channel of the image in order to avoid the error given by chromatic aberration of the lens and because the green channel has a higher signal to noise ratio (SNR). Therefore, only one third of the dataset is used (it is, in fact, one half, because the green pixels occupy one half of the sensor). The influence of using all three colour channels is tested here, where the chromatic aberration effect is eliminated by proper processing. The target coordinates were detected in the AICON
3D Studio for each colour channel and exported to a format suitable for processing in Ax.Ori. In Ax.Ori, each channel of each image was introduced in the bundle adjustment as a new camera pose (number of poses has increased by factor 3), and for each channel a unique camera was defined (3 cameras in total). A similar approach has been used in Luhmann et al. (2006b). The improvement in quality is not high, but the variances of the quality characteristics decreased significantly (see Table 2). This leads to the conclusion, that using the additional colour channels did not increase the quality of the measurement but its reliability. The expected decrease of the random error can be clearly seen in the LMEMAX 2 characteristic (see Fig. 14).
Figure 14. Quality characteristics (usage of all colour channels)
3.9 Influence of the ellipse eccentricity
The centre of the circular target in object space is not identical with the centre of the ellipse of the corresponding target in the image space (more details in Dold, 1997 or Luhmann, 2014). The eccentricity is very low in comparison to other errors and is neglected in most cases. Its influence is analysed here. The eccentricity was computed for each target location on each image by reprojecting the real centre of the target in object space and comparing it with the ellipse centre of the corresponding target in image space. All necessary input data for this calculation (interior and exterior orientation, normal vector of the targets in object space etc.) were exported from AICON reference project. The computation of the eccentricity was performed in a self-developed C++ program. The calculated eccentricities were added to image coordinates and all ten measurements were recalculated by using Ax.Ori SW. The corrections did not bring any change in the quality
characteristics in relation to the reference project (see Fig. 15). The eccentricities are very low (max = 0.17 µm, rms = 0.040 µm) because the circular targets have a small diameter (coded/non-coded – 9/10 mm). In addition, it can be assumed that the all-around imaging configuration compensates mostly for eccentricity effects.
Figure 15. Quality characteristics (ellipse eccentricity)
3.10 Influence of the target detector – template matching
The circular target detector is an essential part in the photogrammetric measurement workflow with a direct impact on the quality of the estimates. In the reference project, the targets were detected by AICON 3D Studio, which uses least-squares ellipse fitting method (star operator). The influence of a different method – least-square template matching – is analysed here. Template matching is based on matching of the synthetically generated target template with the real pattern. The matching procedure involves 2D affine transformation in order to minimize the intensity differences in the least-square sense (Gruen, 1985 or Luhmann et al., 2006a, p. 367). Template matching is implemented in PhoX software (Luhmann, 2016), which was used in this experiment. In PhoX, the synthetic target was generated with following characteristics: Ellipse size: 20 × 16, window size: 24 × 20, mode: 8bit grayscale (see Fig. 17). The size and semi-axes of the target were chosen with respect to typical appearance of the real target in image. The image coordinates of the detected targets in reference project were used in PhoX as initial approximate values. All ten measurements were processed with the new observations (target coordinates given by PhoX) in Ax.Ori SW. The results (see Fig. 16) show an increase in the variance of the characteristics (especially in LMEMAX) and significant decrease of the inner precision (red characteristics).
Figure 16. Quality characteristics (template matching)
3.11 Summarising table
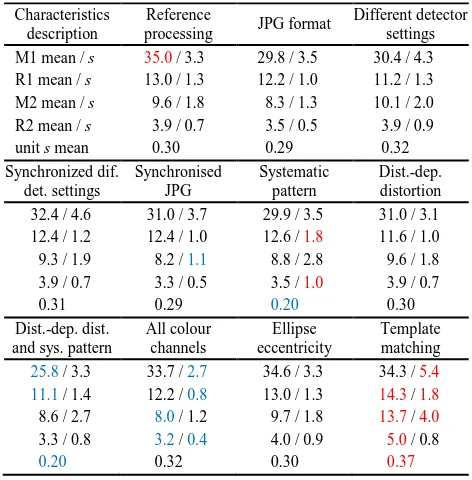
Table 2. Quality characteristics [µm]. Overview. M1 – LMEMAX 1, R1 – LMERMS 1, M2 – LMEMAX 2, R2 – LMERMS 2, s – sample standard deviation, unit s mean – unit standard deviation from Aicon/Ax.Ori protocol. Red = max., Blue = min.
Figure 17. Synthetic target based on sampling the rectangular function.
4. CONCLUSIONS
Raw image preprocessing. The process of raw image conversion to JPG format changes various radiometric characteristics of the image (target contrast, target diameter, black level of the target background etc.) which leads to a different number of detected targets. The differences in the number of detected targets strongly depend on the target detector settings. Such differences obviously lead to a different quality of the photogrammetric measurement. However, when the both datasets (images without preprocessing vs JPG images) were synchronised in order to have a same number and position of the targets, the measured quality was almost identical. This leads to a conclusion, that the raw image conversion process does not change the quality of the measurements.
Sensor unflatness. It was found out that local systematic errors in sensor unflatness (or deviations in the lens symmetricity) prevent significantly the increase of the accuracy of photogrammetric systems. The presented solution for the reduction of such deviations reached a significant improvement, but such approach is questionable and should be replaced by other method (e.g. Tecklenburg et al., 2001).
quality of the project was increased by extending the collinearity equations with the additional coefficients. However, it has to be noted that such an improvement is possible to reach only in projects having a very strong net configuration (large number of well distributed camera positions), which rarely happens in practice.
Incorporating the red and blue colour channels. Extending the number of the input observations – image coordinates – by incorporating the additional colour channels (red and blue) does not increase the accuracy, but significantly increases the precision and reliability of the measurement. Most of today’s sensors used in the photogrammetric systems are based on a Bayer RGGB or similar pattern, while the photogrammetric software usually uses only the green channel (one half of the recorded observations). Hence, the low-cost improvement is easy to achieve. Using all colour channels requires more computing power, but these requirements are easy to reach with today’s computers. The implementation of the algorithm in software is simple. The same conclusion, based on a different dataset and experiment procedures, was derived in Reznicek et al. (2016).
Ellipse centre eccentricity. The influence of the ellipse eccentricity in target detecting was found insignificant, due to a small diameter of the targets (9 and 10 mm) and the fact, that the all-around imaging configuration compensates mostly for eccentricity effects.
Target detector. Template-based target detector did not performed better than the standard ellipse operator, but an additional examination has to be performed in order to find out whether the problem is in the method itself or in the different detector settings.
ACKNOWLEDGEMENTS
The authors would like to thank Ralph Rosenbauer and ALPA Company for providing us the ALPA camera. This research was supported by the Lower Saxony program for Research Professors, 2013–2016, and Jade University.
REFERENCES
Bräuer-Burchardt, C., Heinze, M., Munkelt, C., Kühmstedt, P., Notni, G., 2006. Distance Dependent Lens Distortion Variation in 3D Measuring Systems Using Fringe Projection. Proceedings of the British Machine Conference, BMVA Press, pp 34.1– 34.10.
Brown, D.C., 1971. Close-Range Camera Calibration. Photogrammetric Engineering, 37 (8), pp. 855–866.
Dold, J., 1997. Ein hybrides photogrammetrisches Industrie-meßsystem höchster Genauigkeit und seine Überprüfung. Dissertation, Heft 54, Schriftenreihe Studiengang Vermessungs-wesen, Universität der Bundeswehr, München.
Fraser, C.S., Shortis, M.R., Ganci, G., 1995. Multi-sensor system self-calibration. Videometrics IV, S. F. El-Hakim (Ed.), SPIE Vol. 2598, pp. 2–18. The International Society for Optical Engineering, Bellingham WA, USA. ISBN 0819419621.
Gruen, A., 1985. Adaptive least squares correlation – a powerful image matching technique. South African Journal of Photogrammetry, Remote Sensing and Cartography, 14 (3): pp. 175–187.
Li, Z., Yuan, X., Lam, K.W.K., 2002. Effects of jpeg compression on the accuracy of photogrammetric point determination. Photogrammetric Engineering and Remote Sensing, Vol. 68, Issue 8, ISSN: 0099-1112, pp. 847–853.
Luhmann, T., Robson, S., Kyle, S., Harley, I., 2006a. Close-Range Photogrammmetry and 3D Imaging. Whittles Publishing, Dunbeath, Scotland, UK.
Luhmann, T., Hastedt, H., Tecklenburg, W., 2006b. Modelling of Chromatic Aberration for High Precision Photogrammetry. In: The International Archives for Photogrammetry and Remote Sensing, Dresden, Germany, Vol. XXXVI, Part 5, pp. 173–178.
Luhmann, T., 2014. Eccentricity in Images of Circular and Spherical Targets and its Impact to 3D Calculations. The Photogrammetric Record, Vol. 29, Issue 148, DOI: 10.1111/phor.12084, pp. 417–433.
Luhmann, T., 2016. Learning Photogrammetry with Interactive Software Tool PhoX. International Archives of Photogrammetry, Remote Sensing and Spatial Information Sciences, Vol. XLI (B6) (to appear).
Magill, A.A., 1954. Variation in Distortion with Magnification. Journal of Research of the National Bureau of Standards, Vol. 54, Issue 3, Research Paper 2574, pp. 135–142.
Matsuoka, R., Shirai, N., Asonuma, K., Sone, M., Sudo, N., Yokotsuka, H., 2011. Measurement accuracy of center location of a circle by centroid method. In: PIA'11, LNCS 6952: Proceedings of the 2011 ISPRS conference on Photogrammetric image analysis, Springer-Verlag, pp. 297–308.
Miks, A., Novak, J., 2012. Dependence of camera lens induced radial distortion and circle of confusion on object position, Optics and Laser Technology, Vol. 44, Issue 4, pp. 1043–1049.
Quellet, J.N., Hébert, P., 2009. Precise ellipse estimation without contour point extraction. Machine Vision and Applications. Vol. 21, Issue 1, pp. 59–67.
Reznicek, J., Ekkel, T., Hastedt, H., Luhmann, T., Kahmen, O., Jepping, Ch., 2016. Zum Einfluss von Maßstäben in photogrammetrischen Projekten großer Volumina. Photogrammetrie - Laserscanning - Optische 3D-Messtechnik, Beiträge der Oldenburger 3D-Tage 2016, ISBN 978-3-87907-604-8.
Rieke-Zapp, D.H., 2010. A digital medium-format camera for metric applications – ALPA 12 metric. The Photogrammetric Record, Vol. 25, Issue 131, pp. 283–298.
Stamatopoulos, C., Fraser, C.S., Cronk, S., 2012. Accuracy aspects of utilizing raw imagery in photogrammetric measurement. International Archives of Photogrammetry, Remote Sensing and Spatial Information Sciences, Vol. XXXIX (B5), pp. 387–392.
Tecklenburg, W., Luhmann, T., Hastedt, H., 2001. Camera Modelling with Image-Variant Parameters and Finite Elements. Proceedings of 5th Conference on Optical 3-D Measurement Techniques, Vienna, Austria, 1–4 October 2001, pp. 328–335.