EFFECTIVE LEAF AREA INDEX RETRIEVING FROM TERRESTRIAL POINT CLOUD
DATA: COUPLING COMPUTATIONAL GEOMETRY APPLICATION AND GAUSSIAN
MIXTURE MODEL CLUSTERING
S. Jina,∗, M. Tamurab, J. Susakib
a
Kyoto University, Graduate School of Global Environmental Studies, Kyoto, Japan - [email protected]
bKyoto University, Civil and Earth Resources Engineering, Kyoto, Japan - (tamura.masayuki.2w, susaki.junichi.3r)@kyoto-u.ac.jp
KEY WORDS:Point Cloud Data, Effective Leaf Area Index, Curvature Threshold, Clustering Analysis
ABSTRACT:
Leaf area index (LAI) is one of the most important structural parameters of forestry studies which manifests the ability of the green vegetation interacted with the solar illumination. Classic understanding about LAI is to consider the green canopy as integration of horizontal leaf layers. Since multi-angle remote sensing technique developed, LAI obliged to be deliberated according to the observa-tion geometry. Effective LAI could formulate the leaf-light interacobserva-tion virtually and precisely. To retrieve the LAI/effective LAI from remotely sensed data therefore becomes a challenge during the past decades. Laser scanning technique can provide accurate surface echoed coordinates with densely scanned intervals. To utilize the density based statistical algorithm for analyzing the voluminous amount of the 3-D points data is one of the subjects of the laser scanning applications. Computational geometry also provides some mature applications for point cloud data (PCD) processing and analysing. In this paper, authors investigated the feasibility of a new application for retrieving the effective LAI of an isolated broad leaf tree. Simplified curvature was calculated for each point in order to remove those non-photosynthetic tissues. Then PCD were discretized into voxel, and clustered by using Gaussian mixture model. Subsequently the area of each cluster was calculated by employing the computational geometry applications. In order to validate our application, we chose an indoor plant to estimate the leaf area, the correlation coefficient between calculation and measurement was 98.28%. We finally calculated the effective LAI of the tree with6×6assumed observation directions.
1. INTRODUCTION
Leaf area index (LAI) is a key variable used to model many phys-ical processes, such as canopy photosynthesis and transpiration. It determines the size of the plant-atmosphere interface and thus plays a critical role in the exchange of energy and mass between the canopy and the atmosphere (Weiss et al., 2004). Therefore, obtaining LAI effectively and accurately by using remote sensing data has been discussed for decades.
LAI is first defined as one-sided of photosynthetic tissue per unit ground horizontal area (Watson, 1947). At the beginning of the LAI studies the canopy structural parameters are measured di-rectly. It is accurate, however, time consuming and destructive to plants (Lang and Xiang, 1986). According to the botanical structure of the vegetation, we only consider the green plants on the ground; leaves from the canopy are with low visible light flectance except of green light. Theoretically it is possible to re-trieve the leaf area from the canopy using optical sensed data. Since 1960s people attempt to indirectly retrieve canopy struc-tural parameters from optical images (Jonckheere et al., 2004). Several ground-based commercial instruments for LAI collec-tion have been testified, the advantages and drawbacks of each instrument have been presented as well; moreover the potential of the laser instruments for LAI measurement has been pointed out acutely (Welles and Cohen, 1996). Landsat TM data and ground-based measurements of LAI have been correlated for es-timating effective LAI, which is the product of LAI and clumping index. Some issues have been discussed for the LAI estimation, which were correlated to the LAI retrieving from Landsat images in spite the limitations of TM image (Chen and Cihlar, 1996).
The development of the optical sensor resolution improves LAI measurement accuracy and mathematical modeling. An
applica-∗Email:[email protected]; Tel/Fax: +81 075-383-3303.
tion with spectral and textural information was used for mapping the LAI of different vegetation types, has been presented by us-ing IKONOS images (Colombo et al., 2003). Moreover when the land cover is stratified, spectral and textural relations are consid-erably better for mapping LAI spatial variability for different crop types. Encouraging result in LAI estimation by using optical data has been obtained via data fusion process for high spatial resolu-tion images of the LAI. For achieving reliable result over a large area, LAI measurement with auxiliary variables such as NDVI computed from Landsat images have been combined(Hernndez et al., 2014). However, due to the assumption of randomly located foliage elements within the canopy, LAI obtained from gap frac-tion (Pearcy et al., 1989) theory is not the actual LAI (Zheng and Moskal, 2009), thus effective LAI has been proposed to describe the result more accurately, which is obtained by considering the clumping index affection.
(a)
ScanPos001
ScanPos002
ScanPos003
ScanPos004 ScanPos005
ScanPos006
(b)
Figure 1: (a) The tree (Cinnamomum Camphora) used in this study. (b) Six stations for laser scanning,ScanPos001is taken as assumed original point of the coordinate system we used.
each layer using a point-quadrat method. The non-photosynthetic tissue has to be removed as redundancy in the application so that the damage to the plant cannot be avoided. A computational ge-ometry based application has been published for retrieving the ef-fective leaf area using terrestrial laser scanner (TLS) data (Zheng and Moskal, 2012). Due to the high sampling density of TLS, this method can be taken as a calibration tool for airborne laser scanning and optical sensing. PCD have been discretized into slides and the leaf area within each one has been calculated, but the non-photosynthetic structure still cannot be removed. Non-photosynthetic tissue removing is a challenging issue of the laser scanner utilized LAI estimation study, especially for the canopies which are not dense.
As a consequence of the 3-D scanners development, the prob-lem of high quality geometrical characteristic extraction from dense PCD is receiving increased attention (Fabio, 2003). It is possible to distinguish leaves from non-photosynthetic structure (branch and trunk), if one considers their geometry pattern fea-tures from PCD. One leaf is a patch of an infinite surface, yet the non-photosynthetic structure could be taken as the integra-tion of cylinder segments. Surface curvature is considered as the bending and distortion of surface patches, which holds the po-tential to distinguish between leaves (distorted like a hinge) and branches (composed from cylindrical segments). Intuitively, the branch curvature should be smaller and more regular than that of leaves, while the curvature of leaf surfaces should be sensi-tively changed according to the leaf bend. Removing the non-photosynthetic structures of the canopy is thus constrained by only geometric properties that differ from leaves, though other issues can be overcome.
PCD can be considered as the aggregation of multivariate dis-tributed clusters according to the object location in Cartesian space. If the point clusters in a sub-space, a voxel, can be distinguished, the PCD can be classified into several clusters, which hold signifi-cance for leaf area retrieval. Leaf area calculation can be achieved by using computer scientific libraries like Computational
Geom-etry Algorithms Library (CGAL). For clustering the points we choose the clustering analysis packages from R platform based on Gaussian mixture model, which is an iterative expectation-maximization (EM) processing method for determining maximum likelihood via a statistical model (Reynolds, 2009). We here fo-cus on the feasibility of applying this to PCD clustering, rather than discussing a detailed statistical algorithm for the Gaussian mixture model. The Gaussian mixture model is an option for han-dling PCD clustering that can provide an unsupervised solution. After resolving the clusters, the complexity of PCD is highly re-duced. Leaf is considered as a fitting plane which is computed from computational geometry algorithms. Leaf surface is recon-structed according to the points by using triangulation algorithm, which is a commonly employed technique of computational sci-ence.
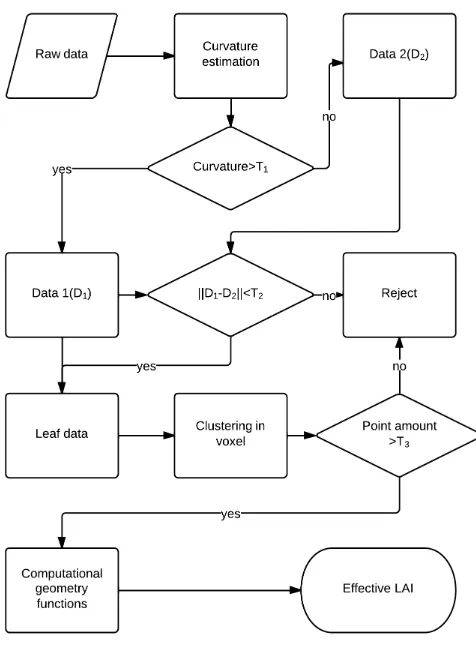
This study aims to investigate the feasibility for retrieving the effective LAI from PCD, which using the combination of com-putational geometry application and distribution-based clustering algorithm. The data processing is as follows: first, we estimate the PCD curvature and set the curvature threshold for filtering the non-photosynthetic structure. Second, we discrete the filtered PCD into voxel matrices that can hold even the largest leaf, then cluster the PCD in each voxel according to the Gaussian mix-ture model. Third, we reconstruct the surface of each cluster in each voxel by using the computational geometry algorithm. The accumulation of the entire canopy clusters area is taken as the ef-fective leaf area of the tree, which is calculated according to the different observation geometry. The effective LAI is finally cal-culated which is the ratio of the effective leaf area of the canopy and the volume from the convex hull of the entire canopy.
2. MATERIALS AND METHODOLOGY 2.1 Data Collection
A well-isolated broad leaf tree (Cinnamomum Camphora, Fig-ure 1a ) was used in this study, which is located in Kyoto Uni-versity Katsura Campus (N34◦58′55.61′′, E135◦40′43.54′′) in Kyoto Prefecture, Japan. We set six directions around the tree for collecting data. Raw data were assigned to an assumed co-ordinate system, in which the original point was set to the first station (ScanPos001). Cartesian coordinates (x, y, z) units were in meters (m) (Figure 1b). Both vertical and horizontal scanning intervals were set to0.02◦.
2.2 Methodology
2.2.1 Simplified Curvature Estimation: PCD give the aver-age Cartesian or polar coordinates of the object surface patch. The curvature of a point can therefore be estimated by consid-ering the normals of its neighboring points. Assume there is a point set PN* which contains N points, whose elementpi* is the 3-D coordinates (x, y, z) of the Cartesian space. The amount of the point is determined by both vertical and horizontal scan-ning intervals. The set of neighboring pointsPn is determined
by the searching radiusrcentering on the query pointpq, which
isPn ={pi:kpq−pik2≤r},(i= 1,2, ..., n). A simplified curvaturecqof pointpqis given by (Rusu, 2009):
cq=
2.2.2 Gaussian Mixture Model: Voluminous points amount and complexity are the principal property of PCD. PCD carry the Cartesian coordinates from the patch of an object interacting with the laser impulse by receiving objects surface echo. Points there-fore correspond to heterogeneous distributions, like multivariate clusters, of discrete objects within a sample space according to their positions. Exploring constructional information is one of the majority purposes for PCD users. We used themclustpackage of the R platform to cluster the point set observations for reducing the complexity of the PCD. It provides functions for model-based clustering (covariance parameterization and number of clusters selected via Bayesian information criterion (BIC)), which gives the maximized loglikelihood for the number of components in the data. In general, the larger value of BIC, the stronger the evidence for the number of clusters (Fraley et al., 2012). It attempted to it-erate group sets of objects according to a rule stating that objects within the same cluster were more optimized to each other than those in other groups. The detailed algorithm explanation was presented by the articles (Fraley and Raftery, 1998, Fraley and Raftery, 2002).
2.2.3 Leaf Orientation Retrieving: This study assumed that one leaf is a fitting plane retrieved from point cluster which was obtained by mclust (see 2.2.2). We chose the principal com-ponent analysis routine from CGAL to calculate the plane (Al-liez et al., 2014). Suppose the plane equation we computed is: Ax+By+Cz+D = 0. The orientation of the plane can be
and azimuth angle of the plane normal, respectively. Leaf normal calculation is a key step to retrieve the leaf area we discuss in fol-lowing section.
2.2.4 Effective Leaf Area Calculation: In order to find the geometrical boundary of the cluster, the 3-D convex hull function of CGAL for generating the convex hull, which contained all the points of the cluster, was selected (Hert and Schirra, 2014). As-sume the convex hull containsmpoints as vertices, the leaf area can be approximately calculated as the topological closure of the points that vertices projected on the fitting plane which we com-puted from section 2.2.3.
SupposePV = {pk(xk, yk, zk) :k= 1,2, ..., m}are the
ver-tices projection on the fitting plane, the centerp¯v(xv, yv, zv)of
PV can be calculated by (2). If the points are ordered sequently,
according to the triangulation mesh function of CGAL, the leaf area could be computed by accumulating the triangles:
S= skipped. The effective leaf areaS*
can be computed by consid-ering the projection coefficient (Ross, 1981):
S*= cos−−→rLrvS,
Figure 2: Data processing algorithm.
were rejected due to the possibility of low reliability. The leaf area were calculated for each cluster according to section 2.2.4, and then the accumulated area for entire canopy was calculated. Finally the effective LAI was computed according to proposed 6×6observation directions.
3. RESULTS AND VALIDATION
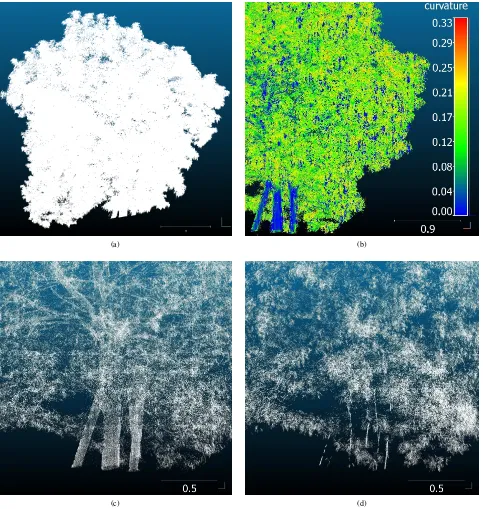
Raw data points amount was over 9.7×10⁶ (Figure 3a). After curvature estimation (Figure 3b), 76.13% data were rejected ac-cording to the threshold, many of them were from leaves. Thefore, we employed the method in 2.3 to restore the excessively re-moved points. The result of rejected data and leaf data are shown in Figure 3c and 3d, individually. The leaf data accordingly in-creased to 52.33% and the opposite data were 47.67%. The leaf data were effectively restored.
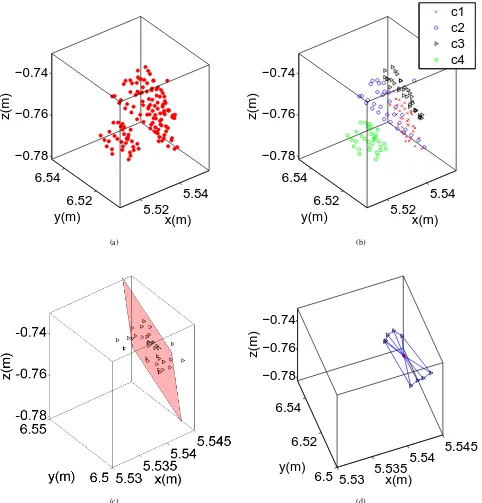
The algorithm of data processing within a voxel is indicated in Figure 4. The initial condition of the data in the voxel is shown in Figure 4a, which is out-of-order arranged. Aftermclustfunction (see 2.2.2) processing, points were distinguished into four clus-ters:c1, c2, c3andc4(Figure 4b). We picked one (c3) of them as an example for retrieving the cluster area, red plane (Figure 4c) was obtained by using PCA function of CGAL (see 2.2.3). First, we generated the convex hull of this cluster by using 3-D convex hull generation function from CGAL, then obtained the vertices of this convex hull. Vertices were projected on the fitting plane of the cluster and those points within the convex hull were removed. Finally the area of this cluster was calculated by accumulating the triangles which are constructed from each two vertices and
the center (red point in Figure 4d). The volume of this canopy was calculated asV = 33.918m3from 3-D convex hull as well. For the light travel length we assumed the canopy was contained by a sphere, according the maximum and minimum coordinates of the PCD, we calculated the effective LAI by:
ELAI=Dη
V ,
D= ∆x+ ∆y+ ∆z
3 ,
η=
I X
χ=1
J X
ω=1 S*χω,
∆x=xmax−xmin, ∆y=ymax−ymin, ∆z=zmax−zmin,
(6)
whereDis the average light traveling distance,ηis the effective leaf area of the entire canopy,χis the index of the voxel (from 1toI),ωis the index of the cluster within theχth voxel (from 1toJ),S*
χωis the effective area of each cluster within a voxel,
(a) (b)
(c) (d)
Figure 3: (a) The raw point cloud data of the tree with scale bar 1 m. (b) The curvature estimation of the raw data, scale bar shows in 0.9 m, color various according to the curvature, which ranged from 0 to 0.33. (c) The data (D2) contain branches after curvature filtering. The scale bar shows in 0.5 m. (d) Leaf data after merging leaf points fromD2and dataD1; the scale bar shows in 0.5 m (see section 2.3).
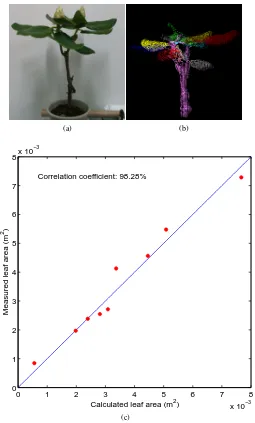
the area of the leaves to compare with the calculation results. A high correlation coefficient up to 98.28% was achieved (Figure 5c).
4. DISCUSSION
Curvature is a common parameter during PCD processing in com-putational geometry. Different from the Gaussian curvature and mean curvature, the simplified curvature we utilized in this study
is the approximation of the change of curvature in a neighbor-hoodPncentered atpq, and it is invariant under rescaling. It can
be computed conveniently as well. Small values indicate that the neighborhood pointsPnare on the plane tangent to the surface
5.52
5.54
6.52
6.54
−0.78
−0.76
−0.74
x(m)
y(m)
z(m)
(a)
5.52
5.54
6.52
6.54
−0.78
−0.76
−0.74
x(m)
y(m)
z(m)
c1
c2
c3
c4
(b)
(c)
5.53
5.535
5.54
5.545
6.5
6.52
6.54
−0.78
−0.76
−0.74
x(m)
y(m)
z(m)
(d)
Figure 4: (a) Point data with in a voxel. (b) Aftermclustclustering, the data were indicated into four subsets (c1, c2, c3, c4) each symbol indicates one cluster. (c) One cluster (c3) from (b), red plane is the fitting plane retrieved from PCA algorithm. (d) After CGAL convex hull generation, we obtain the vertices of the volume of the cluster, then project these vertices on PCA fitting plane of this cluster and remove those points within the closure. Finally the area of this cluster is calculated by accumulating the triangles which construct from each two vertices and the center (red point).
complexity of the object. Smaller searching radius corresponded higher curvature fluctuation, and bigger searching radius causes that the distinction of leaf points and non-photosynthetic tissue points was not obvious. A future study for investigating the op-timized searching radius setting method should be attempted so that to develop this application into an unsupervised function.
Our clustering strategy was to first discrete the PCD into voxel matrices, for reducing the computational complexity of the PCD. The voxel size was set according to the maximum single-leaf size
scan-(a) (b)
0 1 2 3 4 5 6 7 8
x 10−3
0 1 2 3 4 5 6 7
8x 10
−3
Calculated leaf area (m2)
Measured leaf area (m
2 )
Correlation coefficient: 98.28%
(c)
Figure 5: (a) The picture of the indoor plant for validation. (b) PCD of the plant, different color shows components of the plant. (c) Comparison between measurements and calculated each leaf area of the plant, which have a correlation coefficient of 98.28%.
Effective LAI (m2 /m2
)
Zenith(◦) Azimuth(
◦)
0 30 60 90 120 150
0 2.929 2.929 2.929 2.929 2.929 2.929
15 2.929 2.985 3.013 3.008 2.980 2.966
30 2.938 3.046 3.093 3.069 2.994 2.980
45 2.976 3.055 3.102 3.065 2.966 2.971
60 3.088 3.018 3.041 3.022 2.966 2.994
75 3.177 2.990 2.938 3.027 3.027 3.083
Table 1: The effective LAI (m2 /m2
) result which is calculated from6×6assumed observation directions. ning resolution in our case. However, when the scanning interval
and range are big the reducing of the leaf points should be cau-tiously considered. Our validation result showed a correlation coefficient of 98.28%, indicating that the indoor experiment pre-sented high accuracy. Yet with the condition of wild plant and forest, the application should be demonstrated in several condi-tions. According to the pattern of the canopy in this study, which was approximately taken as a sphere, therefore the light travel distance was accordingly a constant in this case, for different
con-ditions the light travel distance should be calculated individually.
for computing the effective leaf area.
5. CONCLUSION
This study retrieved effective LAI, a key canopy structure pa-rameter, using terrestrial scanned PCD. It is an important fac-tor in vegetation structural investigations and canopy radiative transfer simulations. In contrast to previous studies, we inno-vatively utilized simplified curvature as the threshold for filter-ing the non-photosynthetic components. PCD were clustered by
mclust, which is a Gaussian mixture model based package of the R platform. An important aspect of this method was the manipu-lation of computational geometry algorithm for curvature estima-tion and effective leaf area retrieving. Good agreements between measurement and our calculation were obtained by conducting an indoor experiment of a plant. The correlation coefficient was in the range of 98.28%. Due to the sufficient accuracy of TLS, the results of this study could be taken as a validation of optical sensor based LAI estimation. In future research, we will attempt to apply our curvature-cluster application on investigating forest effective LAI. We believe that laser scanning based phytomet-ric techniques have more advantages than many optical sensor based applications. With the development of laser scanning tech-niques, the efficiency and accuracy of TLS will be improved; and forest parameterization and investigation techniques will be sub-stantially improved as well.
ACKNOWLEDGEMENTS
The authors express their gratitude to Mr. Masayasu Maki and Mr. Amane Kuriki for their advice, to Mr Duminda Ranganath Welikanna, Alexandros Kordonis and Chandana Dinesh for their help in proofreading, and to our lab members for supporting this work.
REFERENCES
Alliez, P., Pion, S. and Gupta, A., 2014. Principal Component Analysis. In:CGAL User and Reference Manual, 4.4 edn, CGAL Editorial Board.
Chen, J. M. and Cihlar, J., 1996. Retrieving Leaf Area Index of Boreal Conifer Forests Using Landsat TM Images. Remote Sensing of Environment55(2), pp. 153 – 162.
Colombo, R., Bellingeri, D., Fasolini, D. and Marino, C. M., 2003. Retrieval of Leaf Area Index in Different Vegetation Types Using High Resolution Satellite Data. Remote Sensing of Envi-ronment86(1), pp. 120 – 131.
Estivill-Castro, V., 2002. Why So Many Clustering Algorithms: A Position Paper. ACM SIGKDD Explorations Newsletter4(1), pp. 65–75.
Fabio, R., 2003. From Point Cloud to Surface: the Modeling and Visualization Problem.International Archives of Photogram-metry, Remote Sensing and Spatial Information Sciences34(5), pp. W10.
Fraley, C. and Raftery, A. E., 1998. How Many Clusters? Which Clustering Method? Answers via Model-Based Cluster Analysis.
The Computer Journal41(8), pp. 578–588.
Fraley, C. and Raftery, A. E., 2002. Model-based clustering, dis-criminant analysis, and density estimation. Journal of the Amer-ican Statistical Association97(458), pp. 611–631.
Fraley, C., Raftery, A. E., Murphy, T. B. and Scrucca, L., 2012. MCLUST version 4 for R: Normal Mixture Modeling for Model-Based Clustering, Classification, and Density Estimation. Tech-nical Report 597, Department of Statistics, University of Wash-ington.
Hernndez, C., Nunes, L., Lopes, D. and Graa, M., 2014. Data Fusion for High Spatial Resolution LAI Estimation. Information Fusion16(0), pp. 59 – 67. Special Issue on Information Fusion in Hybrid Intelligent Fusion Systems.
Hert, S. and Schirra, S., 2014. 3D convex hulls. In:CGAL User and Reference Manual, 4.4 edn, CGAL Editorial Board.
Hosoi, F. and Omasa, K., 2006. Voxel-Based 3-D Modeling of Individual Trees for Estimating Leaf Area Density Using High-Resolution Portable Scanning Lidar.IEEE Transactions on Geo-science and Remote Sensing44(12), pp. 3610–3618.
Jonckheere, I., Fleck, S., Nackaerts, K., Muys, B., Coppin, P., Weiss, M. and Baret, F., 2004. Methods for Leaf Area Index De-termination. Part I: Theories, Techniques and Instruments. Agri-culture and Forest Meteorology121, pp. 19–35.
Korhonen, L., Korpela, I., Heiskanen, J. and Maltamo, M., 2011. Airborne Discrete-return LiDAR Data in the Estimation of Verti-cal Canopy Cover, Angular Canopy Closure and Leaf Area Index.
Remote Sensing of Environment115(4), pp. 1065 – 1080.
Lang, A. and Xiang, Y., 1986. Estimation of Leaf Area Index from Transmission of Direct Sunlight in Discontinuous Canopies.
Agricultural and Forest Meteorology37(3), pp. 229 – 243.
Morsdorf, F., K¨otz, B., Meier, E., Itten, K. and Allg¨ower, B., 2006. Estimation of LAI and Fractional Cover from Small Foot-print Airborne Laser Scanning Data Based on Gap Fraction. Re-mote Sensing of Environment104(1), pp. 50–61.
Pearcy, R. W., Ehleringer, J. R., Mooney, H. A., Rundel, P. W. et al., 1989. Plant Physiological Ecology: Field Methods and Instrumentation. Chapman and Hall Ltd.
Reynolds, D., 2009. Gaussian Mixture Models. Encyclopedia of Biometricspp. 659–663.
Ross, J., 1981. The Radiation Regime and Architecture of Plant Stands. Tasks for vegetation science, Dr W. Junk.
Rusu, R. B., 2009. Semantic 3D Object Maps for Everyday Ma-nipulation in Human Living Environments. PhD thesis, Technis-chen Universitt MnTechnis-chen, Faculty of computer science. An op-tional note.
Watson, D. J., 1947. Comparative Physiological Studies on the Growth of Field Crops: I. Variation in Net Assimilation Rate and Leaf Area between Species and Varieties, and within and between Years.Annals of Botany11(1), pp. 41–76.
Weiss, M., Baret, F., Smith, G., Jonckheere, I. and Coppin, P., 2004. Review of Methods forin situLeaf Area Index (LAI) De-termination: Part II. Estimation of LAI, Errors and Sampling.
Agricultural and Forest Meteorology121(12), pp. 37 – 53.
Welles, J. M. and Cohen, S., 1996. Canopy Structure Measure-ment by Gap Fraction Analysis Using Commercial InstruMeasure-menta- Instrumenta-tion.Journal of Experimental Botany47(9), pp. 1335–1342.
Zheng, G. and Moskal, L. M., 2009. Retrieving Leaf Area Index (LAI) Using Remote Sensing: Theories, Methods and Sensors.
Sensors9(4), pp. 2719–2745.
Zheng, G. and Moskal, L. M., 2012. Computational-Geometry-Based Retrieval of Effective Leaf Area Index Using Terrestrial Laser Scanning. IEEE Transactions on Geoscience and Remote Sensing50(10), pp. 3958–3969.