3D APPLICATIONS IN DISASTER MITIGATION and MANAGEMENT: CORE RESULTS of DITAC PROJECT
K. Kaptan 1, *, 2U. Kavlak, 3O. Yilmaz, 4O. T. Celik, 5A. K.Manesh, 6P. Fischer, 7O. Lupescu, 8P. L. Ingrassia, 9W. J. Ammann 10M. Ashkenazi, 11C. Arculeo, 12R. Komadina, 13K. Lechner, 14G. v. Arnim, 15B. Hreckovski
1*, 2, 3, 4
AFAM-Disaster Education, Application and Research Center, Istanbul Aydin University, Turkey
5Pre-hospital and Disaster Medicine Centre, Sweden
6UKBH University Clinic Bonn, Germany
7URGENTA - Clinical Emergency Hospital, Bucharest, Romania
8CRIMEDIM - Università del Piemonte Orientale, Novara, Italy
9Global Risk Forum GRF Davos, Switzerland
10Bonn International Center for Conversion, Germany
11Hanover Associates, United Kingdom
12General and Teaching Hospital Celje, Slovenia
13Disaster German Aerospace Center, Germany
14Disaster Nations Health Career School of Management gGmbH, Germany
15Croatian Urgent Medicine and Surgery Association, Croatia
Commission II, WG II/2
Key Words: Remote sensing, GIS, Active Tectonics, Earthquakes, Tsunamis, Landslides
ABSTRACT:
According to statistical data, natural disasters as well as the number of people affected by them are occurring with increasing frequency compared to the past. This situation is also seen in Europe Union; So, Strengthening the EU capacity to respond to Disasters is very important. This paper represents the baseline results of the FP-7 founded DITAC project, which aims to develop a holistic and highly structured curriculum for responders and strategic crisis managers. Up-to-date geospatial information is required in order to create an effective disaster response plan. Common sources for geospatial information such as Google Earth, GIS databases, and aerial surveys are frequently outdated, or insufficient. This limits the effectiveness of disaster planning. Disaster Management has become an issue of growing importance. Planning for and managing large scale emergencies is complex. The number of both victims and relief workers is large and the time pressure is extreme. Emergency response and triage systems with 2D user interfaces are currently under development and evaluation. Disasters present a number of spatially related problems and an overwhelming quantity of information. 3D user interfaces are well suited for intuitively solving basic emergency response tasks. Such tasks include commanding rescue agents and prioritizing the disaster victims according to the severity of their medical condition. Further, 3D UIs hold significant potential for improving the coordination of rescuers as well as their awareness of relief workers from other organizations. This paper describes the outline of a module in a Disaster Management Course related to 3D Applications in Disaster Mitigation and Management. By doing this, the paper describes the gaps in existing systems and solutions. Satellite imageries and digital elevation data of Turkey are investigated for detecting sites prone to natural hazards. Digital image processing methods used to enhance satellite data and to produce morphometric maps in order to contribute to the detection of causal factors related to landslides, local site conditions influencing and/or experiencing earthquake damage intensity or those of tsunami and storm surge hazard sites at the coasts.
* Corresponding author: Kubilay Kaptan, Assistant Professor and Research Center Coordinator, Istanbul Aydin University Disaster Education, Application and Research Center, Istanbul. [email protected]
1. INTRODUCTION
Data from earth observing satellites have become a valuable supporting tool for natural hazard damage detection especially during the aftermath of the disaster. Satellite observations can help considerably to identify vulnerable areas, to enhance mapping, and to improve our understanding of hazards. For future work the multidisciplinary integration of different methods has the greatest potential for substantial progress in natural hazards management.
Through the development of new information technologies and the rapid spread of global communications, data has become more readily accessible. Earth observation satellites as LANDSAT, SPOT, IKONOS, QUICKBIRD, ERS, or ENVISAT with increasing capabilities in terms of spatial,
temporal and spectral resolution allow a more efficient, reliable and affordable monitoring over time. Thus, remote sensing technology has become a fundamental input for Geo Information Systems (GIS), especially Natural Hazard Information Systems. The design of a common GIS database structure - always open to new data - can greatly contribute to the homogenisation of methodologies and procedures of natural hazard risk management. Meanwhile
Geographic Information Systems (GIS) have been developed and specialized for many kinds of natural hazards leading to a multi hazard GIS approach by integrating remote sensing data, geologic, earthquake, seismotectonic and topographic data and catalogues of historical events. The evaluation of digital topographic data is of great importance as it contributes to the detection of the specific geomorphologic/ topographic settings of hazard prone areas.
International Archives of the Photogrammetry, Remote Sensing and Spatial Information Sciences,
2. METHODS
In order to establish a cost effective method for getting a quick overview of determining factors influencing damage intensity in hazard prone areas, it is recommended to analyses the causal factors and their complex interactions based on remote sensing and GIS methodologies. The goal is to develop a multi-sensor approach combining analysis of optical (LANDSAT ETM) and SAR (ERS-1/2) remote sensing data in a GIS environment to assess the potential for natural hazard on a regional basis. The various data sets as LANDSAT TM and satellite radar (ERS) data, topographic, geological and geophysical data from the investigation areas were integrated as layers into GIS using the software ArcGIS 9.1 of ESRI. The GIS integrated evaluation of the satellite imageries allows the storage of the results in a standard form. The formats of the evaluation results are vector-formats, as points, lines or polygon shapefiles. With digital image processing techniques maps can be generated to meet specific requirements considering risk site mapping. Various tools delivered by ENVI Software/ CREASO were tested, as for finding the best suited LANDSAT ETM Bands-RGB combinations or contrast stretching parameters. The RGB imageries were merged with the panchromatic band to get the spatial resolution of 15 m. Standard approaches of digital image processing with regard to the extraction of natural hazard relevant information used for this study are methods like classification for land use and vegetation information, and processing of the thermal band 6 for deriving surface temperature information. For the investigation of vegetation anomalies that might be related to subsurface structures and landslides the NDVI (Normalized Difference Vegetation Index) was calculated based on the available LANDSAT ETM Bands 3 and 4.
Figure 1. Remote sensing data as layers in a GIS data base
3. REMOTE SENSING AND GIS TECHNOLOGIES FOR NATURAL HAZARD
SITE DETECTION
3.1. Landslides
Usually the same factors and/ or similar factor combinations can be stated in relation to of landslide phenomena, although not only with the same weight, because each single case has its own peculiarities. For example the favoured conditions for the development of slope failure are an abundant water supply, the presence of unconsolidated material, slopes steep enough to induce flowage and insufficient protection ground by vegetation. There is a close relationship between soil moisture conditions and slope instability, too. Slope angle is deemed another important causative factor to consider leading to the occurrence of trigger zones of mass movements. For the assessment of landslide susceptibility maps it is necessary to identify and analyze the causal factors leading to landslides such as high slope degree or curvature, critical lithologic units and fault zones. A systematic GIS approach is recommended as described in Fig.1 a - b extracting the geomorphometric parameters based on DEM data as part of a multi-hazard information system. Fig.2 shows the Yalova area where the causal factors for natural hazards are extracted based on SRTM Digital Elevation Model (DEM) and LANDSAT ETM data.
3.2. Earthquakes
Estimating the likelihood of seismic hazard and the degree of damage, including damages of secondary effects is essential for damage mitigation planning. In order to obtain a better understanding of processes influencing the damage intensity of stronger earthquakes various data sets as satellite radar and seismotectonic data from Turkey were intergrated into a GIS. One important factor that must be accounted for in local hazard studies is the site effect caused by the surface and subsurface conditions. Earthquake damage may vary locally, being a function of the type of structures in the subsurface and/ or soil mechanical ground conditions, as for example of faults and fractures, lithology or ground water table (Gupta, 2003). Previous reported destructive earthquakes have indicated that the damage and loss of life are mostly concentrated for example in areas underlain by deposits of soft soil that amplify shear waves and, thus, amplify ground shaking. It has been observed by macroseismic studies of topographic effects, that in valleys and depressions damage intensity was higher because of higher earthquake vibration. Special attention was given to the mapping of structural features visible on satellite radar imageries such as from the Gerede area in order to investigate the tectonic setting and to detect surface traces of fracture and fault zones that might influence the contour and degree of seismic shock and earthquake induced secondary effects as landslides or soil liquefaction. Seismic waves travelling in the subsurface might be refracted at sharply outlined discontinuities as faults, and, thus, arrive at a summation effect that influences the damage intensity. Fault zones could cause constructive interference of multiple reflections of seismic waves at the boundaries between fault zones and surrounding rocks. Precise delineation of those faults can be a useful input in seismic risk analysis in order to improve the understanding of the influence of surface near tectonic structures on macroseismic intensity and on earthquake related faulting processes. Fig 3 presents an example from the area of Gerede situated directly on the North Anatolian Fault Zone (NAF). It is widely known that the NAF related faults are inherently complex, en echelon, and multi-stranded on many scales. The NAF splays off into a number of fault zones, sub fault zones, fault sets and isolated faults as reported by Kocyigit (2002).
International Archives of the Photogrammetry, Remote Sensing and Spatial Information Sciences,
Figure 2 a. Morphometric maps based on SRTM data
Figure 2 b. Proposed standard approach for the analysis causal factors in a GIS
3.3. Storm Surge and Tsunami Hazard Sites
Around the Mediterranean Sea, Marmara and Black Seas there is a high potential for generation of tsunamis, and in addition, for the generation of tsunamis produced in the continental shelf that could have catastrophic effects on a local scale (Yalciner et al., 2001, 2004, Taymaz et al., 2005). Parts of the Turkish coastline have suffered from disastrous sea -waves many times in history. The tsunamis caused severe damage and flooded low lands in many segments of the coasts. Most detailed maps of those areas susceptible to tsunami flooding and to storm surges are an important component of disaster preparedness, mitigation and emergency planning. It can be assumed that coastal areas that were hit in the past by catastrophic tsunamis might be affected by similar events again. Detailed studies are necessary to understand which factors might influence the spatial variations in the distribution of the tsunami height, the extent of the overland flow and the degree of consequent damage along the affected coastlines in Turkey. Remote Sensing and GIS methods have proven their utility for the detection of potential traces of past tsunami flooding and tsunami related secondary effects such as abrasion and
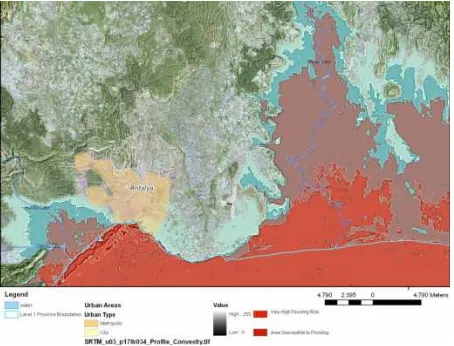
landslides (Theilen-Willige, 2006). LANDSAT ETM and digital elevation data of the coastal areas of Turkey were investigated in order to detect traces of past tsunami events. These maps combined with seismotectonic and bathymetric data in a GIS environment allow the delineation of areas with potential tsunami risk. There is a strong correlation between potential tsunami inundation and the topography and surface roughness of coastal areas. River beds and smaller waterways will help to carry tsunami waves over the land into the interior, which would otherwise not receive tsunami flood. It must be added that, storm surges, although not potentially as destructive as a major tsunami, can be comparatively more frequent. Therefore, inundation maps indicating the extent of the coastal strip that could be affected by potential events of both tsunamis and storm surges ought to be prepared (Wijetunge, 2006). An example for such maps is presented in Fig.4 showing the area of Antalya.
The horizontal inundation distance water can be partly derived by the analysis of satellite data as LANDSAT ETM, radar or digital elevation data because of the typical, geomorphologic and lithologic properties of the land surfaces formed by tsunami floods.
Figure 3. SRTM and ERS satellite radar data from the North Anatolian Fault Zone (NAF)
Figure 4. Flooding susceptibility of Antalya region
4. CONCLUSIONS
International Archives of the Photogrammetry, Remote Sensing and Spatial Information Sciences,
We hereby conclude that remote sensing technology embedded in a GIS database can be easily used as a complementary tool for multi-hazard risk assessment. In the scope of this study LANDSAT ETM and ERS imageries and SRTM data were used to create maps within an "Multi- Hazard Information System" as important layers in a GIS data base in order to perform user-defined computations of hazard maps. Critical, causal factors that might influence slope stabilities or lowlands susceptible to
flooding can be easily visualized and presented. Lineament analysis based on LANDSAT ETM and radar imageries can further help to delineate fracture systems and faults that might influence dynamics and shape of landslides or to detect active faults. LANDSAT ETM and Shuttle Radar Topography Mission (SRTM)-DEM data are provided free of charge for scientific research purposes (see e.g. by the University of Maryland/ USA. The use of the remote sensing and GIS technology for natural hazard site assessment and for the elaboration of hazard maps according to the presented approach can be recommended as low cost approach that could be achieved even by local communities in affected areas as contribution to a GIS data base. Local warning dissemination and local system steps must be adapted to local needs. Training disaster preparedness at local level can be easily obtained by the use of remote sensing and GIS-methods well suited for educational purposes.
ACKNOWLEDGMENTS
The authors are very thankful for the support of the European Community for FP-7 founded DITAC project (FP7/2007-2013) under grant agreement no285036, which aims to develop a holistic and highly structured curriculum for responders and strategic crisis managers.
REFERENCES
Gupta, R. P., 2003. Remote Sensing Geology.- Springer-Verlag, Berlin – Heidelberg, New York.
Kocyigit,A., 2002. Segmentation of the East Marmara Section of the North Anatolian Fault System, Strike-slip Faulting-inducved Structures and Some Ground Ruptures of the 17 th August 1999 GölcükArifiye (Mw=7.4) and the 12 th November 1999 Dagdibi–Düzce (Mw=7.1) Earthquakes. 1st International Symposium of Istanbul Technical University the Faculty of Mines on Earth Sciences and Engineering, a post symposium excursion FT-1 guide book, 18-20 May 2002, 4 – 46.
Savvaidis,P., Theilen-Willige, B. & Neuhäuser, B.(2006):LANDSLIDE ALERT SYSTEM: Guidelines for the Standardization of Landslide - GIS Layer Structure.- Integrated Optimization of Landslide Alert Systems(OASYS), EVG1-2001-00061, Final Report,VCE, Wien.
Taymaz, T., Tan, O. and Yolsal, S. ,2004. Active Tectonics of Turkey and Surroundings: Seismic Risk in the Marmara Sea Region, In Fujii, N., Kasahara, J., Higashihara, H., and Ogawa,
K. (Eds.), The Proceedings of “1st International Workshop on Active Monitoring in the Solid Earth Geophysics (IWAM04)”, Extended Abstract Book: p. 110-115, Task Group for Active Monitoring, Mizunami City Culture Center, Gifu, Japan, June 30 – July 3, 2004.
Taymaz, T., Westaway, R. and Reilinger, R., 2004. Active Faulting and Crustal Deformation in the Eastern Mediterranean Region, Special Issue of TECTONOPHYSICS, Volume 391, Issues 1–4, 375 pages, Elsevier Publications (20020516/18), October 29, 2004.
Taymaz, T., Tan, O. and Yolsal, S.,2005. Recent Devastating Earthquakes in Turkey and Active Tectonics of the Aegean and Marmara Seas. NATO Advanced Research Workshop (ARW):Earthquake Monitoring and Seismic Hazard Mitigation in Balkan Countries, Extended Abstract Book: p. 84-91, The Rila Mountains - Resort Village Borovetz, September 11–18, 2005, Bulgaria. Borovetz, Bulgaria.
Theilen-Willige,B., 2006. Remote Sensing and GIS Contribution to Tsunami Risk Sites Detection in Southern Italy, Zeitschrift PFG der Deutschen Gesellschaft für Photogrammetrie, Fernerkundung und Geoinformation - PFG, 2, 103-114.
Theilen-Willige,B. and Taymaz,T.,2006. Remote Sensing and GIS Contribution to Tsunami Risk Sites.
Detection in Turkey, 5th International Symposium “Turkish German Joint Geodetic Days”, March 2931.2006, TU Berlin, Proceedings, in press Theilen-Willige
B & Neuhäuser, B.,2006. Remote Sensing and GIS Contribution, GIS Integrated Geologic Evaluations of Remote Sensing – Data from the Test Sites for the Detection and Monitoring of Landslides in: Integrated Optimization of Landslide Alert Systems(OASYS), EVG1-2001-00061, Final Report, VCE, Wien.
Wijetunge,J.,2006. Tsunami on 26 December 2004: Spatial Distribution of Tsunami Height and the Extend of Inundation in Sri Lanka, Science of Tsunami Hazards, Vol. 24, 3, 225-239.
Yalciner, A. C., Pelinovsky E., Talipova T., Kurkin A., Kozelkov A., and Zaitsev A., (2004): Tsunamis in the Black Sea: Comparison of the historical, instrumental, and numerical data, J. Geophys. Res., 109, C12023, doi:10.1029/2003JC002113.
Yalçıner, A. C., Alpar B., Altınok Y., Özbay I., Imamura F., (2001): "Tsunamis in the Sea of Marmara: Historical Documents for the Past, Models for Future" Special Issue of Marine Geology, V: 190, (2002) 445-463.
Yolsal, S. and Taymaz, T., 2006. Source Parameters and Rupture Histories of Recent Earthquakes Occurred along the Cyprus-Hellenic Arcs and Dead Sea Transform Fault, Congres Des Doctorants, Geosciences Student Meeting, Abstract Book, pages 4-5, 24-27 April 2006, IPGP, Paris, France.
International Archives of the Photogrammetry, Remote Sensing and Spatial Information Sciences,
Web references
Taymaz, T., Tan, O. and Yolsal, S., 2005-a. SUMATRA EARTHQUAKE (Mw~9.0) of DECEMBER 26, 2004: Source Rupture Processes and Slip Distribution Modelling and Preliminary Rupture Model:
http://www.geop.itu.edu.tr/~taymaz/sumatra/
Theilen-Willige,B., 2006. Tsunami Risk Site Detection in Greece based on Remotes Sensing and GIS Methods, Science of Tsunami Hazards, The International Journal of The Tsunami Society, 24, No. 1, 35-48
http://www.sthjournal.org/241/willige.pdf
Theilen-Willige,B., 2006. Emergency Planning in Northern Algeria based on Remote Sensing Data in Respect to Tsunami Hazard Preparedness, Science of Tsunami Hazards, The International Journal of The Tsunami Society, 25, 3-18.
http://sthjournal.org/251/willige1.pdf, http://sthjournal.org/251/willige2.pdf
Theilen-Willige,B. and Taymaz,T.,2006. Remote Sensing and GIS Contribution to Tsunami Risk Sites Detection of Coastal Areas in the Mediterranean, Third International Conference on Early Warning, 27 – 29 March 2006, Bonn, Scientific Symposium,
http://www.ewc3.org/upload/downloads/Symposium_MegaEve nts_05_Theilen-Willige_057.pdf
http://www.vce.at/oasys/pages/welcome.htm
International Archives of the Photogrammetry, Remote Sensing and Spatial Information Sciences,