UAV-BASED MONITORING OF PEDESTRIAN GROUPS
F. Burkert, F. Fraundorfer
Technische Universität München, Remote Sensing Technology, 80333 München, Germany [email protected], [email protected]
KEY WORDS: event detection, pedestrian groups, UAV imagery
ABSTRACT:
In this work we discuss the problem how pedestrians can be monitored from an eye in the sky. Pedestrian monitoring is very important for large-scale surveillance of big events like festivals or demonstrations, and similarly for normal public places. At such settings it is not only important to know if an abnormal scenario is taking place in a pedestrian crowd in general, but also what specific type of scenario is taking place. Also, monitoring authorities benefit from an additional rating if the detected scenario is potentially dangerous to be able to react in an adequate manner. Therefore, we constructed a complex event detector (CED) to detect specific and potentially dangerous scenarios in pedestrian groups. For the development and evaluation of the CED we generated a novel dataset of moving pedestrian groups. The dataset was captured from an 8-rotor helicopter and consists of image sequences of 15 group behaviour scenarios in several complexity levels. We discuss the advantages of UAV imagery in comparison to aerial imagery captured from planes for the problem of pedestrian monitoring. Furthermore, we discuss the results of our CED for pedestrian groups which is able to detect scenarios which potentially occur in moving crowds.
1. INTRODUCTION
Pedestrian monitoring is a very important task for the surveillance of public scenes and big events like festivals, sports events or demonstrations. In general, human activity analysis is a wide-ranging field of research which includes single-person activities as well as group activities (Aggarwal and Ryoo, 2011). Many public places and most of the big events are situated on large-scale open air venues which makes the use of conventional surveillance cameras ineffective. In order to be able to monitor pedestrian groups, occlusion-free airborne camera platforms are beneficial to act as an eye in the sky. Specifically, small UAVs like helicopters provide flexible applicability and sufficient payloads.
Pedestrians in public scenes can move freely, but as soon as the pedestrian density increases, obstacles have to be passed or associated pedestrians are walking together in a group, specific self-organizing group behaviour can be observed (Helbing et al., 2001). This self-organizing behaviour is based on physical and psychological interactions which the interacting individuals are not necessarily aware of. Efficient pedestrian monitoring requires a system which is able to recognize group motion scenarios of several complexity levels. Pedestrian groups can perform very simple scenarios like normal parallel walking. However, also very complex and possibly dangerous scenarios like a narrow corridor situation might occur (Figure 1). Our complex event detector (CED) is designed to recognize what specific type of scenario is taking place in a pedestrian crowd and has to make a statement if the scenario is possibly dangerous.
For the development and evaluation of our CED it is essential to utilize image data. The data has to consist of image sequences which contain representative group motion scenarios which are to be detected by the complex event detector. Known datasets for the evaluation of action recognition systems are either real-life footages from surveillance cameras (Rodriguez et al., 2011)
or datasets captured under controlled environment for a specific task (Mehran et al., 2009; Ryoo and Aggarwal, 2009; Schüldt et al., 2004). The dataset of Rodriguez et al. (2011) does contain unstructured crowds but not enough representative scenarios. The datasets of Ryoo and Aggarwal (2009) and Schüldt et al. (2004) only contain two-person interactions or single-person actions, respectively. The UMN dataset used by Mehran et al. (2009) provides group motion but only represents normal or abnormal (i.e. panic) behaviour in general. None of these datasets provide sufficient group motion scenarios for the development and evaluation of our CED to recognize specific types of scenarios. To this end, we captured an extensive dataset from an 8-rotor helicopter (Asctec Falcon 8 octocopter). The dataset contains image sequences of 15 predefined group motion scenarios which are performed by a group of up to 18 volunteers.
Figure 1. Three frames of the scenario “corridor” with two approaching groups, distinguishable by white (left to right) and
red (right to left) hats.
With our CED we overcome the limitations of related work with respect to action recognition in groups. The sole analysis of motion interaction between two pedestrians is not sufficient for the automatic recognition of complex events in groups (Oliver et al., 2000; Burkert and Bamler, 2012). Approaches for the classification of single trajectories (Nascimento et al., 2010) or the detection of single abnormal trajectories (Hu et al., 2006) are not suitable for simultaneous monitoring of a whole scene in an unknown surrounding. Our CED is able to detect and declare specific group motion scenarios in a decision tree framework based on a predefined scenario library. In this work, we recap our CED (Burkert and Butenuth, 2012) and discuss the development of our pedestrian group behaviour model.
In the next section we describe the data acquisition process and the captured dataset in detail, supplemented by a comparative discussion about the use of UAVs and airplanes for pedestrian monitoring. In section 3, we describe the pedestrian group behavior model and summarize our CED, followed by event detection results based on our UAV dataset.
2. UAV DATASET OF PEDESTRIAN GROUP BEHAVIOUR
For the development and evaluation of our CED, no typically used dataset for action recognition or event detection was suitable. None of these datasets contain image sequences which represent a comprehensive number of scenarios which might potentially occur in pedestrian crowds. Therefore, we captured a new dataset which contains 15 group motion scenarios. The scenarios were performed by a group of volunteers in a controlled environment. This dataset is the basis for the development of a pedestrian group behaviour model which is used in our CED. In the following, we explain the scenario definition process, describe the data acquisition campaign and show facts about the dataset, including the post-processing of the images. At the end of this section, we discuss the advantages of UAV imagery compared to airplane imagery.
2.1 Definition of Scenarios
The dataset has to consist of various scenarios which have to represent possible group behaviour that can occur in pedestrian
crowds. The scenario definition process was inspired by research about the Social Force Model in crowd simulation (Helbing et al., 2002), where several situations like crossings or bottlenecks where simulated. Furthermore, the scenario definition is influenced by personal experiences in everyday life or by various media which show crowds in both normal and panicking situations. Eventually, a list of 15 scenarios was prepared. The scenarios range from simple motion behaviour (normal parallel walking) over various group interaction scenarios (path crossing) to potentially dangerous scenarios (escaping). The scenarios are listed in Table 1 on the left. Wherever reasonable, the scenarios were planned to be executed in both normal and fast pace.
The basis of the campaign is a group of volunteers who will simulate the predefined scenarios. In a detailed preparation phase the acquisition and instruction of the volunteers as well as the use of the helicopter and supportive resources had to be planned. The information given to the volunteers was set to be limited to a minimum in order to preserve natural behaviour. This means that only the main goal of motion was indicated and if the scenario should be executed in normal or face pace. For the use of the helicopter, the battery life for one flight as well as the recharging equipment had to be considered. Supportive resources were coloured hats in order to distinguish different groups and physical obstacles which designated use was to influence the group behaviour.
2.2 Data Acquisition: Equipment and Setting
The data acquisition was arranged on a pitch in Munich. The UAV chosen for this campaign was an Asctec Falcon 8 helicopter on which a Panasonic DMC Lumix LX3 camera was mounted. The weather conditions were sunny and dry with calm wind. After takeoff, the helicopter was stabilized at a height of 85m centrally over the area of interest at each session. The battery life of the Falcon 8 is 15 minutes such that the campaign was divided into sessions of about 12 minutes, not including takeoff and landing. The area of interest was about 30x30m and limited by small marks such that the volunteers do not exceed the guaranteed field of view of the camera. The image acquisition mode was 1 fps and the ground resolution was about 0.015m. Thus, a normal standing pedestrian is represented by a shape of about 30x45 pixels.
Name norm.
Table 1. List of scenarios in our group motion behavior dataset; overview over all available sequences and single images.
2.3 Dataset
Each of the 15 scenarios was taken in a minimum of four to six sequences, depending on the necessity of different paces. Some scenarios were taken in several configurations, like one group crossing another standing group or another walking group, either sidewards or head-on. Summarized, the dataset consists of 1851 images which are organized in a total of 111 sequences, representing 15 group motion scenarios. An overview over all taken sequences and single images can be seen in Table 1.
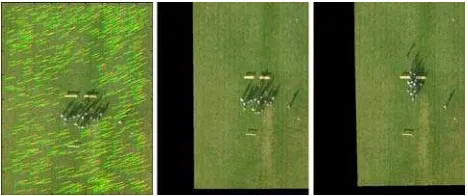
The images are aligned precisely by a homography-based transformation using SIFT feature correspondences. For every sequence, one reference image is chosen on which the rest of the sequences is aligned. Although the grassy background is rather homogeneous, SIFT features can be detected all over the image. Outliers occur in areas where people are moving and are eliminated using the RANSAC procedure. An example is shown in Figure 2 where the area of outliers can clearly be seen in the centre of the correspondence image on the left. The correspondence vectors are oversized for illustrative reasons. On the right, the two corresponding aligned images are shown in a bounding box.
The desired group motion behaviour of all predefined scenarios from Table 1 can clearly be identified visually in the aligned image sequences by a human operator (examples can be seen in the complex event detection results in section 3.3). In order to model the pedestrian group behaviour for the development of our CED in terms of numbers, discrete motion paths of all individuals have to be available. Therefore, a manual tracking of all pedestrians is performed by using the HALCON hdevelop software. The generated trajectories consist of relative image coordinates with respect to the reference images. This representation of motion paths is sufficient for our task. However, for a later operational use of our event detector a geo-referenced positioning of the events will be necessary. This might be done by using helicopter navigation data and camera calibration.
Figure 2. Coregistration example. Left: Inliers of SIFT correspondences after RANSAC procedure. Right: Reference
image and aligned image in bounding boxes.
2.4 The Eye in the Sky: UAV or Airplane?
Aerial images in traditional photogrammetry are taken from airplanes. However, in this work the use of an UAV as camera platform was preferred. In this section we discuss the arguments in order to give reasons for our decision. For pedestrian monitoring from an eye in the sky the main requirement to the imagery is the visibility of pedestrians. This requirement is fulfilled by images from both airplanes and UAVs. Depending on the application, the characteristics of the representation of a pedestrian influence the decision which platform to choose (Figure 3).
Our application is pedestrian monitoring at open air events and public scenes which requires a flexible image platform to monitor a specific location over a long time. Our goal is the detection of complex events in pedestrian groups which requires that individuals have to be visible and distinguishable also at medium pedestrian densities. The described conditions only allow the use of UAVs, more precisely model helicopters. UAV helicopters are able to stay airborne for several minutes up to hours and a possible battery change can be arranged rapidly. In contrast, a camera mounted on an airplane can view a specific location only for seconds during overflight. The ground resolution of less than 1 cm is beneficial in contrast to images from airplanes with a ground resolution of more than 15 cm, captured with comparable low cost cameras (Kurz et al., 2011). In UAV images, single pedestrians can more clearly be distinguished than in images from airplanes, given similar sunny weather conditions like in Figure 3. In the shown example, the recognizability is increased by the coloured hats in the UAV image on the left, but also without these hats the quality of pedestrian representation is much better. The used UAV platform and camera are sensitive to weather influences like strong wind or rain. Therefore, this UAV system can only be used at good weather conditions.
An advantage of images from airplanes would be the large field of vision due to the high altitude of 1000m or more. The resulting lower ground resolution would allow coarse and more general monitoring of general pedestrian flows of big and dense crowds. However, the problem of short view periods during overflight exists when pedestrians are monitored from airplanes. This could be solved by a circular flight path with a slant looking camera. However, UAV imagery is more advantageous for detailed event detection and tracking of individuals because also airplane imagery would suffer from bad weather conditions.
Figure 3. Comparison of an image from the UAV Falcon 8 and an image from the airborne 3K camera system: Representation
of pedestrians.
3. COMPLEX EVENT DETECTOR
The goal of our CED is to recognize specific group-related scenarios in pedestrian crowds and to declare potentially dangerous scenarios. The CED was previously presented in Burkert and Butenuth (2012). The basis for the CED is in-depth knowledge of pedestrian group behaviour which was derived from the above presented dataset. We will present the development of the pedestrian group behaviour model. Afterwards, we summarize the methodology of our CED and show experimental results.
3.1 Pedestrian Group Behaviour Model
The goal of the CED is to detect various scenarios which may occur in pedestrian crowds. To this end, the UAV dataset with 15 specific scenarios was captured. The scenarios in the dataset can easily be recognized by a human observer, but for automatic
event detection trajectories of individuals are necessary. All pedestrian trajectories of the entire group in one sequence inherently incorporate the semantics of the current scenario. The pedestrian group behavior model determines the relation between the trajectories with its physical parameters and the semantics of the predefined scenarios.
Intensive analysis of the captured dataset is the key to model pedestrian group behavior. Each scenario, no matter if it is a simple or a complex one, is characterized by a unique motion behavior in the dataset. The spatio-temporal distribution of the pedestrians is incorporated in the trajectories. For automatic event detection, the representative physical parameters are the speed of a pedestrian, the spatial pedestrian density and the direction of the motion vector. The temporal component is given by the temporal progress of these parameters. Exemplified by Figure 1, the complex corridor scenario is characterized by a formation of lanes in the dense area in the middle of the corridor. These characteristics are represented by the above mentioned parameters: grouped parallel and anti-parallel oriented trajectories are slowing down due to the increasing density during the sequence. Consequently, simple scenarios have a short temporal distribution and can be detected within two frames, whereas complex scenarios can have an extensive temporal distribution and will be detected after several frames.
The modeling is done by analyzing all scenarios in the dataset like described in the “corridor” example. The goal is to derive unique parameterizations of all scenarios which will be detected by the CED. In this step it is important to take into account that the parameterization has to be independent to the size of the pedestrian group. The pedestrian group behavior model is then embedded into the CED by a scenario library. In the library, scenarios are stored together with their representative parameterization. The scenarios in the library do not exactly match the scenarios taken in the dataset. The dataset was mainly constructed for the understanding of pedestrian group motion. Therefore, a scenario like diverging in the dataset is of little importance for pedestrian monitoring. However, the scenario diverging serves as background to model scenarios like escaping in the library, where pedestrians diverge running. Also the collision scenario in the library (Table 2) was modeled on the background of groups crossing head-on (scenario 6, Table 1). The bottleneck scenario is modeled in several phases, starting with a converging pattern, followed by slowing down with an increased density, finished by diverging and speeding up. The brawl is modeled by uncoordinated movements of individuals with changing directions and velocities. The merge and split scenarios represent change of group sizes. All scenarios modeled in the library are summarized in Table 2. The dangerousness is stated in the library and marked in Table 2 (*).
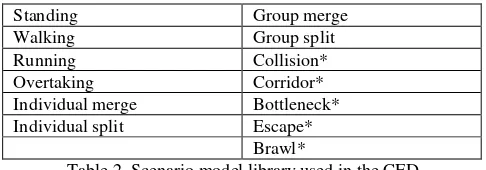
Standing Group merge
Table 2. Scenario model library used in the CED.
3.2 Complex Event Detector - Overview
Our CED is constructed hierarchically. In the first layer, a dynamic pedestrian graph is constructed for each frame. The
graph contains all pedestrians in a scene which are represented by nodes. Edges in the graph represent motion interaction between pairs of pedestrians. In the second layer, the complex event detection takes place. Connected components in the graph represent associated pedestrian groups for which a scenario from the scenario library can be assigned based on a heuristic decision tree framework.
The dynamic pedestrian graph is incomplete because only edges are constructed which connect neighboring pedestrians. This is done by a Gaussian weigh function which depends on the local pedestrian density. The pedestrian density is calculated by inverting the Voronoi cell size which corresponds to the individual space of an individual. In the first layer, also the speed and motion direction vectors are calculated in order to derive low level pairwise motion interaction labels.
In the second layer, connected components in the dynamic pedestrian graph are detected and the history of merging and splitting connected components is stored. The history of connected components is important for the detection of scenarios which extensive temporal distribution. For each component and its history, a set of group motion parameters is calculated. The group motion parameters correspond to the parameterization of the scenarios in the library. The event detection is at this time achieved by a deterministic decision tree framework which compares the parameterization of the tested data to the scenario library and assigns matching scenarios. The complex event detection framework allows parallel assignment of scenarios which can complement each other, such as (frontal) collision and corridor (Figure 4).
3.3 Experimental Results
In this section, we present experimental results of our CED. All results were produced based on the image sequences of our previously described UAV dataset. In the following figures, detected group motion scenarios are visualized by written names and the corresponding pedestrian group is marked with a convex hull. Normal scenarios are marked in blue, potentially dangerous scenarios are marked in red. In the presented results, we focus on potentially dangerous and complex scenarios instead of normal scenarios like parallel walking.
In Figure 4, the result for the corridor scenario (cf. Figure 1) is shown. The first contact of the two groups is detected by the scenario Group merge in frame 5 which is not yet declared as being dangerous (blue colour). The stronger and potentially dangerous collision scenario is detected as soon as the two anti-parallel walking groups approach each other (frame 6, red colour). The collision is represented by merging pedestrians of which several persons or only one individual are moving in opposite direction. The scenario corridor is detected afterwards when the two groups form lanes of identical motion direction. This behaviour was not instructed to the volunteers in advance and corresponds to investigations in Helbing et al. (2001).
The results for the two sequences with escaping pedestrian groups are shown in Figure 5. In both sequences, each represented by two frames in the top and the bottom row, respectively, the escape scenario can be detected successfully. Due to the frame rate of 1 fps in the image sequences, the sampling rate of the group behavior is not sufficient to recognize the increased speed immediately. Therefore, the escaping scenario cannot yet be detected in the first frame of row one in Figure 5.
Figure 4. CED result for the scenario corridor, frames 2, 5, 6 and 12.
Figure 5. CED results for the scenario escape for the two existing sequences from the dataset (top row, bottom row)
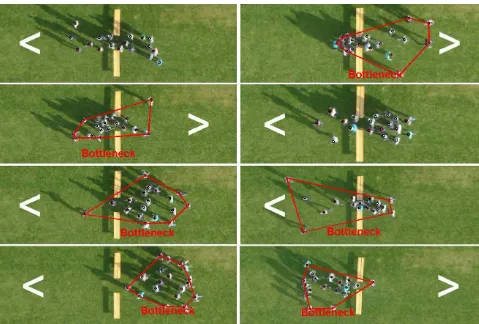
Figure 6. CED results for the scenario bottleneck. We show 8 different results (one representative frame each) chosen from 16 existing sequences of our dataset, exemplifying some positive and some negative results. Scenarios with a wide gap are shown on the
left, scenarios with a narrow gap are shown on the right (cf. Table 1). The motion direction is illustrated with a white arrow.
The robustness of our CED can be verified by analyzing the results of all 16 image sequences containing bottleneck scenarios. According to Table 1, 8 sequences contain a group passing a wide gap with a width of 2-3 pedestrians and 8 sequences contain a group passing a narrow gap with a width of
1-2 pedestrians. In both settings, the group is passing the gap in normal and fast pace (4 sequences each). Our CED is able to detect the bottleneck scenario in 13 of 16 cases. Figure 6 contains 8 of the 16 results, each represented by one frame. On the left, results with a wide gap are shown and on the right,
results with a narrow gap are shown. The two top frames each contain groups with normal pace, the two bottom frames contain groups with fast pace. The white arrow illustrates the motion direction. The results demonstrate that our CED is able to detect the bottleneck scenario in several phases. The converging group characterizes the first phase of the bottleneck scenario before the gap is passed. The second phase is characterized by still converging parts of the group and some pedestrians who already passed the gap. In the third phase, most pedestrians are diverging behind the gap and only some are still queueing in front of the gap. The negative result on the top left is caused by a very parallel motion of the group such that no converging or diverging patterns can be detected. The result on the right is negative because the corresponding sequence is cut in the beginning. Therefore, there are not enough images representing the converging pattern.
The results of our CED show that we are able to detect complex events in pedestrian groups and to declare potentially dangerous scenarios. The presented UAV dataset provides an extensive collection of pedestrian group motion scenarios which can occur in public scenes. On the basis of this dataset, the modeling of pedestrian group behavior was successful in order to embed it into our CED. Therefore, the CED can be used for pedestrian monitoring from UAVs. In spite of the promising results, some indications can be used for further improvements. The frame rate of 1 fps does in some cases hide more detailed behavior which cannot be detected so far. Furthermore, the declaration of potentially dangerous events is very strict and does not take into account if the complex scenario is potentially performed in a very calm and save manner.
4. CONCLUSIONS
In this work we presented an approach for the monitoring of pedestrian groups from UAV image sequences. The monitoring is performed by our CED which was developed and evaluated on the basis of our new image dataset for pedestrian monitoring. The dataset contains 15 group motion scenarios taken from an octocopter. Datasets used for action recognition systems in the literature are not suitable for our task. These datasets either consist of real-world crowd scenes which do not contain enough specific scenarios that might occur while monitoring public events or they consist of pedestrian interactions of up to two individuals instead of large pedestrian groups. The group motion scenarios included in our dataset were crucial for the development of a pedestrian group behaviour model. Thus, our CED is able to detect pedestrian group scenarios based on a scenario library, using discrete trajectories of individuals. Furthermore, the CED is able to declare potentially dangerous events like a bottleneck situation. We showed experimental results which prove the robustness of our CED also for the detection of temporally complex events like a bottleneck scenario.
For future investigations, we will enlarge our dataset of complex group behaviour by capturing image sequences in higher frame rates of at least 3fps. Also, the available scenarios in our dataset will be expanded to cover more and more possible situations in public scenes. In order to improve our CED, the complex group behaviour model will be embedded into a probabilistic framework for location-based complex event detection. Furthermore, the modelling of potentially dangerous scenarios will be refined in order to give a more precise indication if security authorities have to intervene. This can be
achieved by a detailed analysis if a scenario is performed in a calm and save manner or if the pace is rather hectic and alarming.
REFERENCES
Aggarwal, J.K., Ryoo, M.S., 2011. Human Activity Analysis: A Review. ACM Computing Surveys 43(3), 16.
Burkert, F., Bamler, R., 2012. Graph-Based Analysis of Pedestrian Interactions and Events Using Hidden Markov Models. Photogrammetrie, Fernerkundung, Geoinformation, 2012(6), pp. 701-710
Burkert, F., Butenuth, M., 2012. Complex Event Detection in Pedestrian Groups from UAVs. ISPRS Ann. Photogramm. Remote Sens. Spatial Inf. Sci., I-3, pp. 335-340
Helbing, D., Farkas, I.J., Molnár, P., Vicsek, T., 2002. Simulation of Pedestrian Crowds in Normal and Evacuation Situations. In: Schreckenberg, M., Sharma, S. D. (eds.), Pedestrian and Evacuation Dynamics, Springer, pp. 21-58.
Helbing, D., Molnár, P., Farkas, I. J., Bolay, K., 2001. Self-Organizing Pedestrian Movement. Environment and Planning B: Planning and Design 26, pp. 361-383.
Hu, W., Xiao, X., Fu, Z., Xie, D., Tan, T., Maybank, S., 2006. A System for Learning Statistical Motion Patterns. IEEE Transactions on Pattern Analysis and Machine Intelligence 28(9), pp. 1450–1464.
Kurz, F., Rosenbaum, D., Leitloff, J., Meynberg, O., Reinartz, P., 2011. Real time camera system for disaster and traffic monitoring. Proceedings of International Conference on Sensors and Models in Photogrammetry and Remote Sensing, pp. 1-6.
Mehran, R., Oyama, A., Shah, M., 2009. Abnormal Crowd Behaviour using Social Force Model. Proceedings Conference on Computer Vision and Pattern Recognition, pp. 935–942.
Nascimento, J.C., Figueiredo, M.A.T., Marques, J.S., 2010. Trajectory Classification using Switched Dynamical Hidden Markov Models. IEEE Transactions on Image Processing 19(5), pp. 1338–1348.
Oliver, N.M., Rosario, B., Pentland, A.P., 2000. A Bayesian Computer Vision System for Modeling Human Interactions. IEEE Transactions on Pattern Analysis and Machine Intelligence 22(8), pp. 831–843.
Rodriguez, M., Sivic, J., Laptev, I., Audibert, J-Y., 2011. Data-driven crowd analysis in videos. Proceedings IEEE International Conference on Computer Vision, pp. 1235-1242.
Ryoo, M.S., Aggarwal, J.K., 2009. Spatio-temporal relationship match: Video structure comparison for recognition of complex human activities. Proceedings IEEE International Conference on Computer Vision, pp. 1593-1600.
Schüldt, C., Laptev, I. and Caputo, B., 2004. Recognizing human actions: A local SVM approach. Proceedings International Conference on Pattern Recognition (3), pp. 32-36.