VGI BASED URBAN PUBLIC TRANSPORT
F. Teymurian*, A. A. Alesheikh, A. Alimohammadi, A. Sadeghi-Niaraki
GIS Dept., Faculty of Geodesy and Geomatics Eng., K.N. Toosi Univ. of Tech., Tehran, Iran [email protected], (alesheikh, alimoh_abb, a.sadeghi)@.kntu.ac.ir
KEY WORDS: Volunteer geographic information (VGI), geo-collaboration, urban public transportation, user-centric GIS-T
ABSTRACT:
Recent advances in information technology have made geographic information system (GIS) a powerful and affordable tool for planning and decision making in various fields such as the public transportation. These technologies such as the social network (e.g. face-book, twitter), new technologies such as ubiquitous, mobile, Web 2.0, geo tagging and RFID can help to create better shapes and forms of the communication and geo-collaboration for public. By using these, user-generated content and spatial information can be easily and quickly produced and shared in a dynamic, interactive, multimedia and distributed environment. The concept of volunteered geographic information (VGI) has been introduced by the transaction from consultation to content interaction. VGI describes any type of content that has a geographic element and has been voluntarily collected. In other words, ordinary users; without a professional training, can participate in generating and using the spatial information. As a result, the gaps between the producers and users of GIS and spatial information, has been considerably reduced. Public transportation is one of the most important elements of the transportation system. Rapid growth of the cities has resulted in high increase of demand for the public transportation which created new challenges. Improvement of the desirability of public transportation can increase its efficiency, reduction of the environmental pollution (such as air and noise pollution), traffic problems, and fuel consumption. Hence, development of an urban public transportation system which is responsive to citizen’s need and motivates them to use public transportation system is one of the most important objectives and issues that urban planners and designers are concerned about. One solution to achieve this, goal is to develop public transportation system by assistance from the system users.According to approach, users are considered as the valuable resources, because people who are in constant contact with the system can have detailed and updated information about the problems, solutions and they are affected by the related implemented policies. Thus user involvement is an essential part in public transport decision making process. Although GIS in transportation (GIS-T) has been used for data collection, spatial analysis, and spatial modeling, due to recent promotions, GIS-T is moving towards the use of capabilities of VGI to user-centric services.
The main goals of this paper are two as follows: First is to survey and review the key concepts of the geo-collaboration, to introduce and present fields to utilizing the VGI in the public transportation system to improve the performance of that system. The Second goal is to propose a VGI-based public transport conceptual framework. in this paper in the first part capabilities of VGI is explored, and areas of public transport that can utilize the public involvement is assessed and classified. Then, by surveying the related works in this context, a classification based on the models of participation is provided. Finally, a VGI-based conceptual framework for organizing a public participation for performance measurement of urban public transport for Tehran city is proposed. Results of this paper show that utilizing VGI presents an efficient solution for public transport problems.
* Corresponding author
1. INTRODUCTION
Recent advances in information technology such as the social networks (e.g. face book, twitter), Ubiquitous, mobile, Web 2.0, geo tagging, RFID and GPS have changed the use of Geographic information, and have provided new opportunities for spatial public participation and a growing number of users with the possibility to interact with maps and spatial data. A growing part of the available geographic information is now produced, enriched, updated and disseminated by citizens in a bottom-up approach against conventional top-down approach. Such that, The users of the geographic information has also become, at the same time, producers of the geo-information (Roch., et al, 2012). Any person is able to capture geographic information about the social and environmental phenomena, by simple tools such as GPS to measure the position and environmental variables. Internet technologies like web2.0 provide the means to share them observations easily among
other users (Goodchild, 2007). Some of key associated with these concepts are: Geo collaboration, web2.0, crowd sourcing, neography, user generated content, public participatory GIS and VGI.
Interactive platforms such as the Google Maps or Microsoft’s Bing maps facilitate dissemination of user's maps and geographic information. This information usually contains description about a location or collected information by technical devices like the GPS tracking (Elwood., et al, 2008). Public transportation is one of the essential elements of the modern urban life which especially in developing countries like IRAN it has a more important role. Nowadays, public transportation is increasingly adopted for many purposes, such as managing the traffic congestion, mitigating the air pollution, reducing energy consumption, improving the quality of urban life and creating the development opportunities.
Among the prime goals of all actors involved in the public transport is the creation of a well-organized transit system, International Archives of the Photogrammetry, Remote Sensing and Spatial Information Sciences, Volume XL-1/W3, 2013
within which citizens feel satisfy, comfort and safety also find their important needs are met. In this regards, such programs and tools are needed to enable them to be closer to users, know their transportation requirements until they can adjust the transportation services to the needs. In addition the knowledge gained from these programs provides operators with valuable information for more efficient decision making process (Tyrinopoulos., et al, 2004). One solution to achieve this goal is to develop public transportation systems by assistance from the system users. It is obvious that user involvement is also a fundamental part of the transportation; Nash believes that transport systems are provided for users," if there are no users, then there are no needs for transportation" (Nash, 2009). Capabilities of geographic information systems (GIS) such as integration digital maps and spatial analytical methods have made it as a powerful and affordable tool for transportation planning. According to to the wide-spread adoption of GIS in the transportation, new field called GIS for transportation (GIS-T) has emerged. In the area of public transportation planning, a wide variety of studies have been done, ranging from transit route selection (Ramirez., et al, 1996) to market potential evaluation (Pulugurtha., et al, 1999). optimal bus stop placement (Furth., et al, 2000). (Murray, 2001) and transit GIS data model design (Huang., et al, 2002), to public transport supply assessment(Niyonsenga, 2012),to performance evaluation of bus system(Lao., et al, 2009). Therefore, developing a public transport system that is responsive to user's need and expectation and, motivate them to use this system is essential. VGI capabilities can be used as a tool for organizing user involvement in public transportation programs.
To accomplish this goal, in this paper after explaining key concepts of VGI, the role of GIS in transportation is described. Afterwards domains of public transport in which VGI can be used are introduced. Then by literature review of the related works a classification based on model of participation are presented. Finally a VGI-based conceptual framework for organizing a public participation in performance measurement of urban public transport for Tehran city has been proposed.
2. VGI
To better understand VGI, Some key words associated with this concept should be explained. All of the below terms aim to facilitate and organize citizen participation.
• Geo collaboration :
Geo collaboration is an emerging area of study examining how spatial information and communication technologies can be designed and adapted to support group interactions that use geographically-referenced data and information These group interactions normally focus on tasks such as the spatial data access and exploration, problem-solving, planning, and decision-making (Maceachren., et al, 2004).
• Crowd sourcing:
Data acquisition by large and diverse groups of people, who in many cases are not trained surveyors and who don’t have special computer knowledge for using the web technology (heipek, 2010).
• Social network:
Social network provides functions that allow participants to inform, discuss, vote and share (Steiniger., et al, 2012).
• Web 2.0
Web 2.0 is a platform that facilitates interactive collection and share of intelligence through blogs, wikis, podcasts and social networking sites interoperability, user-centered design, and collaboration on the World Wide Web (Ganapati, 2010).
• VGI
Digital spatial data that are produced not only by the individuals and institutions formally in charge of data production, but by the citizens who use the tools described above to gather and disseminate their observations and geographic knowledge (Goodchild, 2007). VGI describes any type of content that has a geographic element and has been voluntarily collected.
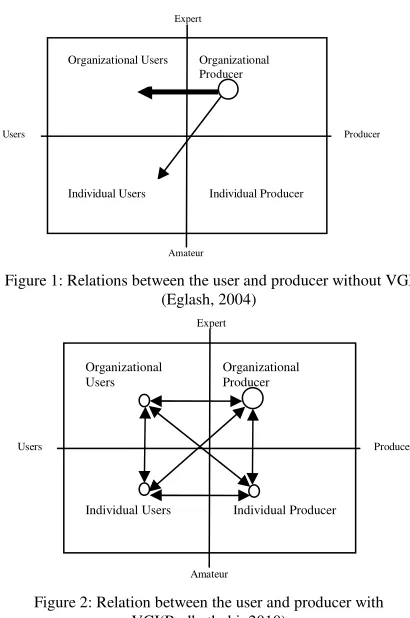
By the advent of VGI the notion of spatial data producer and user has been changed, as shown in fig 1 and fig 2.
Figure 1: Relations between the user and producer without VGI (Eglash, 2004)
Figure 2: Relation between the user and producer with VGI(Budhathoki, 2010)
As Budhathoki (Budhathoki, 2010) believes that after emergence of VGI, notion of SDI user reconceptualized. In the past, spatial data were only produced by the organizations and were distributed for consumer organizations and individual users (fig1) .But after emergence of VGI, the gap between the producers and users of GIS and spatial information, has been considerably reduced and the one-way relations has changed to the two way (figure2). In this way, citizens without the specific knowledge can be producer of the spatial data. For example, citizens can report locations of accidents, or their favorite locations for building a new bus station. They can also send real time spatial information through the multiple ways like images, films, sound, text, videos, and maps. Sui (Sui, 2008) refers describes this phenomena as 'wikification of GIS' which is driven by the large scale volunteer collaboration among the both armatures and experts using web 2 technology.
Organizational Users
Organizational Producer
Individual Users Individual Producer
Expert
Amateur
Producer Users
Organizational Users Organizational Producer
Individual Users Individual Producer Expert
Amateur
Producer Users
VGI possesses a wide range of potentials and tools to gather, visualize, produce and share information on varying scales never achievable before, from millions of potential contributors. As a result, millions of digital records of human observations experiences can be created and saved as digital data (Elwood., et al, 2008).
3. GIS-T
Geographic information systems for transportation (GIS-T) are interconnected hardware, software, data, people, organizations and institutional arrangements for collecting, storing, analyzing and communicating particular types of information about the earth. The particular types of information are transportation systems and geographic regions that affect or are affected by these systems (Fletcher, 2000).
Transportation analysts and decision makers are using in many areas including the following domains: infrastructure planning, design and management, public transit planning and operations, traffic analysis and control, transportation safety analysis, environmental impacts assessment, hazards mitigation, configuring and managing complex logistics systems, just to name a few application domains. Intelligent transportation systems, including the services such as the intelligent vehicle highway systems and automatic vehicle location systems, are a particularly ambitious integration of GIS and communication technologies to a wide variety of transportation services (Schiefelbusch., et al, 2009).
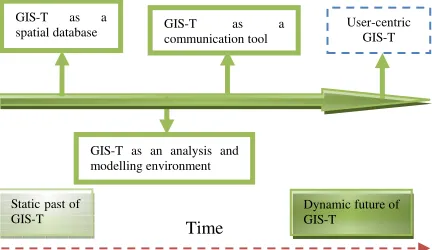
A review of the past GIS-T developments indicates that progress has been achieved in application areas of GIS-T as the spatial databases, analysis and modelling tools and as the communication tools. Today by development of location-aware technologies such as the global positioning system (GPS), mobile phone tracking, Wi-Fi positioning system, and radio frequency identification (RFID), geo sensor people can share their real-time location or a tracked path. As the number of people who are willing to share their data is increasing, we also have observed a growing community of volunteered geographic information providers (VGI) who use modern information and communication technologies (Goodchild, 2007). These provide unprecedented opportunities for the GIS-T community to think outside the boundaries of the current practices in GIS and transportation communities (Shaw, 2010).
So as shown in figure 3 Dynamic future of GIS-T is moving towards the use of capacities of VGI to user-centric services.
In this approach focus is on users, user centric GIS-T aims to apply VGI and well established technologies to support public transportation user with the advantage of its users. for example Individual users can become mobile sensors who contribute to real-time information such as bus location, bus speed, traffic information, accidents via their mobile devices based on participatory sensing concepts. Such real-time monitoring and tracking data, along with the other relevant data can be used to predict bus arrival time and assist other users which are going to travel by bus to plan their trips.
4. VGI IN THE PUBLIC TRANSPORTATION SYSTEM
In the process of public transport planning and decision making there always is a cultural and experimental gap between the users and professionals. Passengers who use the system perceive problems better than anyone, so it is imperative that users participate in the public transport issues. This participation means exchange of the information between people and organizations responsible for the planning, construction and operation of the public transport.
(Simone Noveck, 2009) calls the problem “the single point of failure”, specifically, decision-making systems based on the belief that government experts can identify the best solutions to problems. Today the public can become involved in the deliberative part of this process by talking at public meetings etc. But new technology means that they could, in fact, really collaborate in the process of developing the solutions, rather than simply commenting. She emphasizes that citizens had a great deal of expertise to contribute to this process, if there was a way.
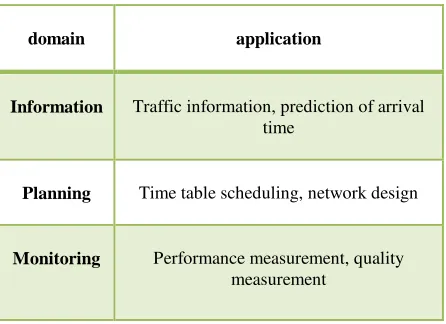
Observing to the various capacities of VGI in improvement of and public transport; we found that there are three general domains that VGI can be used to improve the performance namely: information provision, planning, monitoring.
Information provision: in this area citizens by utilizing VGI and mentioned technologies can collect and share real time information such as the traffic information, GPS tracking data on bus, unexpected events like accidents, so that to assist other passengers in planning their trip. Such information is valuable for example by this information arrival time for bus can be estimated.
Planning: in planning part users are able to discuss planning projects with planners and experts, they can rate or rank alternatives, suggest their favourites places for building new bus stops, share their opinion about the time tables. Such data help identification of the criteria most important according to the users.
Monitoring: In this part, users are able to evaluate the current system, define his concerns, report problems in details (e.g. include geospatially referenced image, video) and also describe the solutions.
5. RELATED WORKS CLASSIFICATION BASED ON THE MODELS OF PARTICIPATIONS
When considering Smyth's (2001) ladder of e-participation, which is somewhat similar to Arnstein's (1969) ladder of Static past of
Figure 3: GIS-T from past to
Table 1. Three main domain of VGI in public transport
domain application
Information Traffic information, prediction of arrival time
Planning Time table scheduling, network design
Monitoring Performance measurement, quality measurement
participation, the lowest level of participation, online service delivery, is to inform the citizen. For public transportation it can be maps of lines, time tables, images, documents, etc. In this ladder, communication is in one way, provided by transport organization to public. Second rung of Smyth's e-participation ladder is online discussion, here communication becomes two ways so the public user can discuss with experts their issues and concerns. The next step on the ladder of e-participation adds online survey facilities that allow users to rank sorting
alternatives), rate (e.g. 1-5 stars like Amazon), or vote(e.g. like or dislike) on alternative planning options. The ultimate level of e-participation, as defined by Smyth (2001), is online decision support. For public transportation it can be the case that experts present alternative location for a new bus station to citizens who can vote and select the most needed one. Between these two ladders there is the concept of "sketching" a tool that empowers people to make plan and change spatial data. for example to put a point, line, polygon , etc. In other words in sketching model people can change geometry attribute but in rank or vote ladder they can just modify the description attribute.
The recent years have seen the development of several VGI-based citizen science applications that have proved to be useful for public transport purposes.
Table 1 summarize the related works based on the models of participation.
6. CONCEPTUAL FRAMEWORK
A transit performance measure is defined as a qualitative or quantitative factor used to evaluate a particular aspect of a transit system (Kittelson., et al, 2003).
Each performance measure has its own indicators. As mentioned one the main goals of this paper is to present a VGI based conceptual framework for performance measurement of measurement of urban public transport in Tehran. The proposed conceptual framework is useful for
Table 2: classification of VGI based transport platforms based on the models of participation
Decision sketching
Rank/ vote discussion Inform/
geo-tag reference
platform
(Gil., et al, 2011) sustainable mobility
plan (SMP)
(Steiniger., et a2012) Plan Your Place
Seeclickfix.com Seeclickfix
Cyclopath.org Cyclopath
(Ferris., 2010) One Bus Away
(Vieira., et al, 2012) Ubi Bus
(Roch, et al.2012) Wiki GIS
(Boroushaki., et al, 2010), (Rinner., et al,
2008) Argumentation map
(Prasain, 2011) Bus finder
(Zhong., et al, 2008) Transportation
improvement programming(TIP)
measuring the current public transport system performance, combined passenger perception and agency indicators. Also it guides to identify weakness areas and give recommendation for improvement. As shown in fig 4 the first step of the framework is to define a set of criteria and performance measure indicators. Required data for calculating these criteria can be divided in two categories: first, data which has been collected by the transport stakeholders individually (current users, potential users, experts and operations) and secondly the data collected by the agencies in charge transport operations. For acquisition
of more accurate and timely data, transport agencies have turned to automated or semi-automated data collection approaches such as the automatic vehicle location(AVL) and automatic passenger counter(APC). In some cases, transport agencies may require special information, or more detailed information which are produced by the other agencies. Transport stakeholders by utilizing VGI can share their opinion about the current public transport services to report the public transport problems and their solutions.
Second step entails selection of the analysis method, calculation of the performance indicators and GIS based assessment. By implementing these steps customer satisfaction and transit agency performance can be assessed. Finally these two steps are combined in order to achieve the overall VGI based performance measurement.
7. CONCLUSION
The quality and operation of public transport system can be improved by creating the collaborative public processes using VGI. While it is possible to establish collaborative public involvement process without using the VGI, VGI capacities in handling spatial dimension in public transport application and easier public participation make VGI powerful tool. In this paper a conceptual framework for VGI based public transport performance measurement has been proposed. An interesting advantage of the proposed conceptual frame work is that various stakeholders of public transit specially passengers easily participate in evaluating the public transport. This means citizens can plan future developments according to their
expectations which in turn make them feel more responsible and motivated to use public transport instead of private transportation. As a result, it can be concluded that, utilizing VGI can make new mutations for efficient solving of the of public transport problems.
References
Boroushaki, S., Malczewski, J., 2010. participatory GIS: a web based collaborative GIS and multicriteria decision analysis. PhD dissertation, Department of Geography, University of Western Ontario, London, Ontario, Canada.
Budhathoki, N. A., 2010. Participants' motivations to contribute geographic information in an online community. University of Illinois at Urbana-Champaign, P. 121.
Eglash, R., 2004. Appropriating Technology: An Introduction. (In R. Eglash, J. L. Croissant, G. D. Chiro & R. Fouche (Eds.), Appropriating Technology: Vernacular Science and Social Power (pp. VII-XXI). University of Minnesota Press.
Current user
Potential user
Expert
Operator
VGI VGI data
Define criteria and performance indicators
Person based data collection
Transit agency
Other agencies
(APC) automatic passenger counter
(AVL) automatic vehicle location Automatic data collection by
agency
Firebox data Agency data
Select analysis method Calculate performance indicators
GIS based assessment
Customer satisfaction Transit agency performance
measure
VGI based performance measurement
Solution and recommendation
Figure 4: Conceptual framework for VGI based public transport performance
Elwood, S., 2008. Volunteered geographic information: future research directions motivated by critical participatory and feminist GIS. Geojournal, 72(3-4), pp. 173-183.
Ferris, V., Watkins, K. and Borning, A., 2010. location aware tools for improving public transit usability. Pervasive Computing, IEEE, 9(1), pp. 13-19.
Fletcher, D., 2000. GIS-T: A look forward. In Transportation in the New Millenium: state of the art and future directions, Transportation Research Board, Washington, DC (CD-Rom).
Furth, P. G., & Rahbee, A. B., 2000. Optimal bus stop spacing through dynamic programming and geographic modeling. Transportation Research Record, 1731, pp. 15–22
Ganapati, S., 2010. using geoghraphic information system to incresse citizen engagement. IBM Center for The Business of government, Florida International University.
Gil, A., Calado, H. and Bentz, J., 2011. public participation in municipal transport planning processe- the case of sustainable mobility plan. Journal of Transport Geography, 19, pp. 1309-1319.
Goodchild, M.F., 2007. Citizens as voluntary sensors: Spatial data infrastructure in the world of Web 2.0. International Journal of Spatial Data Infrastructures Research, 2, pp. 24-32.
heipek, Ch., 2010. crowd sourcing geospatial data. ISPRS Journal of Photogrammetry and Remote Sensing, 65(6), pp. 550-557.
Huang, R., & Peng, Z. R., 2002. Object-oriented geographic information system data model for transit trip-planning systems. Transportation Research Record, 1804, pp. 205–211.
Kittelson., Associates. and Inc., 2003. TCRP Report 100: Transit Capacity and Quality of Service Manual, 2nd ed, Transportation Research Board of the National Academies, Washington, D.C.
Lao, Y., Liu, L., 2009. Performance evaluation of bus lines with data envelopment analysis and geographic information systems. Computers, Environment and Urban Systems, 3(4), pp. 247-255.
Maceachren, A. M., Brewer, I., 2004. Developing a conceptual frame-work for visually-enabled geocollaboration. International Journal of Geographical Information Science, 18(1), pp. 1–34.
Murray, A. T., 2001. Strategic analysis of public transport coverage. Socio-Economic Planning Sciences, 35(3), pp. 175– 188.
Nash, A., 2009. web 2.0 applications for improving public participation in transport planning. Transportation Research Board 89th Annual Meeting, Vienna Transport Strategies, Austria.
Prasain, S., 2011. StopFinder: Improving,the Experience of Blind Public Transit Riders with Crowdsourcing. The proceedings of the 13th international ACM SIGACCESS conference on Computers and accessibility, pp. 323-324.
Pulugurtha, S. S., Nambisan, S. S., & Srinivasan, N., 1999. Evaluating transit market potential and selecting locations of
transit service facilities using GIS. Journal of Public Transportation, 2(4), pp. 75–94.
Ramirez, A., Seneviratne, P., 1996. Transit route design applications using geographic information systems. Transportation Research Record, 1557, pp. 10–14.
Rinner, C., Keßler, C. and Andrulis, S., 2008. the use of web 2 concepts to support deliberation in spatial decision making. Computers, Environment and Urban Systems, 32(5), pp. 386-395.
Roch, S., Mericskay, B., Batita, W., Bach, M. and Rondeau, M., 2012. Wiki GIS Basic Concepts: Web 2.0 for Geospatial Collaboration. Future Internet, 4, pp. 265-284.
Schiefelbusch, M., Dienel, H. L., 2009. Public Transport and Its Users: The Passenger's Perspective in Planning and Customer Care. Ashgate Publishing, p. 304.
Shaw, S. L., 2010. Geographic information systems for transportation: From a static past to a dynamic future. Annals of GIS, 16(3), pp.129-140.
Simone Noveck, B. S., 2009. Wiki Government: How Technology Can Make Government Better, Democracy Stronger, and Citizens More Powerful. Brookings Institution Press, p. 224.
Steiniger, S., Poorazizi, M. E., A. M. Bliss-Taylor., Mohammadi, E. and J.S. Hunter, A., 2012. PlanYour Place: Merging Social Networks and Participatory GIS for Participatory Planning. Planning Policies and Procedures II, Rome, Italy.
Sui, D. Z., 2008. The wikification of GIS and its consequences: Or Angelina Jolie's new tattoo and the future of GIS. Computers, Environment and Urban Systems, 32(1), pp. 1-5.
Tyrinopoulos, Y., Theologidou, M. and Aifadopoulou,G., 2004. Quality Control Indicators for the passenger services provided by the Athens Urban Transport Organization (OASA). Proceedings of the 2nd International Congress on Transportation Research in Greece, Athens.
Vieira, V., Salgado, A. C., Tedesco, P., Times, V., Ferraz, C., Huzita, E., Chaves, A. P. and Steinmacher, I., 2012. Ubi Bus project: using context and ubiquitous computing to build advanced public transportation system to support bus passengers. In: Anais do VIII Simpósio Brasileiro de Sistemas de Informação, Brazil.
Zhong, T., Young, R. K., Lowry, M. and Rutherford, G., 2008. a model for public involvement in transportation improvement programming using participatory geographic information system. Computers, Environment and Urban Systems, 32(2), pp. 123-133.
Niyonsenga, D., 2012. Assessing Public Transport Supply for Kigali, RWANDA. Thesis Submitted to the Faculty of Geo-Information Science and Earth Observation of Twente in partial fulfilment of the requirements for the degree of master of Science in Geo-information Science and Earth Observation, Enschede, Netherlands.