PERFORMANCE EVALUATION OF A STRUCTURE AND MOTION STRATEGY IN
ARCHITECTURE AND CULTURAL HERITAGE
R. Roncella*, C. Re, G. Forlani
Dept. of Civil Engineering, Parma University, Viale Usberti 181/A, 43124 Parma, Italy – riccardo.roncella@unipr.it, cristina.re@studenti.unipr.it, gianfranco.forlani@unipr.it
Commission V, WG V/4
KEY WORDS: Cultural Heritage, Architecture, Comparison, Orientation, Automation, Algorithms, Accuracy, Reliability
ABSTRACT:
A large number of strategies and implementations of Structure from Motion (SFM) have been developed; some are being included in photogrammetric software packages. However, finding specific parameters highlighting the efficiency, the accuracy and the reliability of a SFM strategy it is difficult. While most strategies will almost always succeed in any given task (i.e. the orientation of a certain image sequence), judging how good is actually the result, is somehow still an open issue. In the first part of this paper some alternatives and parameters are presented and their pro and cons discussed, with the objective to find out whether there are alternatives to the well-established method of the check points. In the second part, the results of most of the image sequences made available by the workshop organizers, processed with the SFM approach developed by the authors, are presented; results for the sequences where external information (such as ground control points or a DTM) were available are presented in more detail.
* Corresponding author.
1. INTRODUCTION
1.1 Automation of image orientation in close range
The pursuit of ever better performing algorithms for automatic image orientation has been and still is a major research topic in computer vision and photogrammetry since the advent of digital images. As for most technological developments, the motivations of this effort are manifold: scientific, technological as well as economic.
Image orientation is a challenge that attracts people with different background, leading to diverse problem-solving approaches. Recent feature-based matching (Bay et al., 2008) and Structure from Motion (SFM) (Hartley and Zisserman, 2004) algorithms have indeed evolved by strengthening their mathematical, statistical and geometrical foundations in a fruitful competition that should improve their robustness and overall performance.
Automation of the orientation is a prerequisite for many new technologies and image-based applications (think for instance of location-based services for smartphones). They aim at a market of potential users that is far larger than that of photogrammetry and can therefore tap on a correspondingly larger pool of resources. This diversity of background and objectives has indeed benefited photogrammetry, that has come to integrate some of these procedures in its pipeline. Another motivation pushing for technological advances comes from developers of photogrammetric software, that have been under increasing competition from Terrestrial Laser Scanning (TLS) in recent years; improving the efficiency and the delivery time becomes a key objective to regain appeal and market share. The consequences of the increasing success of image orientation algorithms are far reaching and, as far as photogrammetry is concerned, may lead to profound changes. Although the goal of complete automation of the photogrammetric procedure is still a distant one, especially as far as map production is concerned, it removes one of the most critical stages in the pipeline. For non-expert users, this is a welcome step, much more important than
automation of camera calibration, where expertise in tie point selection was not at stake. With well-designed interactive tools to support plotting, completing a photogrammetric survey, at least for not-too-complex objects is now a task open to a larger group of potential users.
On the other hand, no photogrammetrist would conclude, as perhaps some computer vision people might, that now you have just to take images and feed them to the computer. Although algorithmic development must continue, it is perhaps time to move the focus on two topics connected to the algorithm performance and to photogrammetric best practice. An assessment of precision and reliability of any automatically oriented image sequence should be performed and included in the processing pipeline; efforts should be encouraged to address the network design, possibly with a set of best practice rules (Kraus, 1994; Waldhaeusl, 1996) in “standard” cases. It is also important to look to the influence that using (as it is normally the case) a larger-than-necessary image overlap might have on e.g. DSM generation using multi-image techniques.
1.2 Network Design
Optimization of precision and reliability of photogrammetric networks has long been a research topic in aerial photogrammetry as well as in industrial close range photogrammetry. The great variety of block shapes in architecture makes it more difficult to find simple rules to ensure block quality and, on the other hand, run realistic simulations prior to the actual survey. Large and complex surveys, though, can often be broken down in smaller elementary ones; rules-of-thumb for a number of basic cases have been proposed in Kraus (1994). It is important, however, to provide guidelines for image acquisition when using automatic procedures for image orientation, because this has consequences for both processing time as well as, more fundamentally, for block geometry characteristics and therefore for the quality of the restitution.
1.3 Quality control and performance measures
How do we evaluate the quality of image orientation from a structure from motion algorithm? Of course, each implementation of SFM has its own quality optimization criteria as well as different parameters that control the various stages from feature extraction, to feature matching, to image orientation. Changing the values of control parameters will change the output of the process and to some extent its quality as well; how is the output quality to be evaluated?
In principle we can think of two sorts of rankings: from a user standpoint an absolute measure (e.g. a sort of score of the orientation goodness) would perhaps be the best, since no other term of comparison (another sequence oriented with a different method) is available; in a scientific and technical context, when comparing the results of different SFM strategies applied to the same image sequence, relative scores(e.g. collinearity residuals, point redundancy, frame coverage, etc.) might be acceptable. In both cases, practically every quality measures depend to large extent on the data set (network geometry, image quality, object shape, calibration data, etc.). This means that both “absolute” and “relative” measures in fact apply to that specific dataset. The goal of this paper is to provide some tentative proposal on this topic, that we believe should get more attention within the photogrammetric community. In section 2 a brief description of the main blocks of our SFM strategy are presented; some details about the current software implementation are also given. In section 3 some proposals are put forward on how to evaluate the quality of automatic image orientation. In section 4, using datasets provided by the workshop organizers, the results of the automatic orientation and the checks performed on three image sequences of cultural heritage sites where control data are available are presented; besides, results and some statistics are presented on the orientation of other four image sequences also retrieved from the organizer’s website.
2. OUR IMPLEMENTATION OF SFM
A detailed description of our of Structure from Motion and of its software implementation is presented in (Roncella et al, 2011, also in this volume). Here just the main points are given. As far as feature extraction and preliminary correspondences estimation are concerned, the SURF operator (Bay et al., 2008) and the SURF/SIFT feature descriptors (Lowe, 2004) are used. To select the corresponding features, a direct comparison of the values of the descriptors is performed. Both an exhaustive search or the approximate kd-tree method (Beis et al., 1997) can be used to determine the preliminary matches: the latter is faster but still achieves extremely reliable results.
Since we almost always use calibrated images (i.e. we know the interior orientation parameters), to filter out matching errors we estimate first the epipolar geometry through the essential matrix with the Nister algorithm (Nister, 2004) and then the trifocal intersection constraint is verified for sets of consecutive images along the sequence. After filtering, the accepted tie points are structured in the sequence and a bundle block adjustment is performed.
2.1 Software implementation
The SFM algorithm is implemented in EyeDEA, an in-house development with graphical user interface designed to handle both automatic as well as interactive image measurement; the bundle adjustment is currently executed in Photomodeler, by importing the SFM results; this is currently a limitation, soon to
be removed, since our version has a limit on the number of image measurement that can be processed. When processing long sequences, therefore, a Tie Point Optimizer has been implemented to preserve multiplicity as well as even distribution of the tie points while reducing the amount of data. In some test cases in section 4, a DSM obtained by Dense Matcher, also an in-house development based on LSM, are shown.
3. EVALUATION OF IMAGE SEQUENCE ORIENTATION QUALITY
Either external or internal consistency and quality checks can be applied for the evaluation of the sequence orientation results. Some alternatives and proposals are discussed in the following.
3.1 External checks
External checks rely on independent information that may provide a direct or indirect evaluation of the results. In principle a direct measurement of exterior orientation (EO) parameters is possible using an integrated GPS/INS; such devices are now routinely used in aerial photogrammetry and in terrestrial mobile mapping. The experience so far shows that in the aerial case the quality of relative orientation achieved by using tie points is clearly better than that of the available navigation systems (Heipke et al., 2002; Forlani and Pinto, 2002). Even assuming a better performance of GPS/IMU systems in the terrestrial case and disregarding the operational complexity of using such systems for this purpose, it is questionable to claim that the correctness of the orientation can be assessed by simply computing discrepancies between orientation parameters. Indeed in both the photogrammetric and the inertial case, the parameters are derived from an adjustment (be it a standard least squares adjustment or a Kalman filtering) that introduces correlations between parameters; in the former case they are known to be strong (and even stronger are those with interior orientation parameters in SFM self-calibrating approaches). For the same reason, in case ground control points (gcp) are available, computing the “most accurate” set of EO parameters by e.g. fixing all gcp and computing the discrepancies would not necessarily capture the quality of the results. Statistical hypothesis testing, accounting for the different covariance matrices, is in principle possible to discriminate two solutions (Welch, 1947), though impractical.
It seems more reasonable and also more appropriate in standard photogrammetric tasks to check the restitution error on object coordinates, though it involves also the image measurement accuracy, the interior orientation accuracy and the accuracy of check points (it should be noticed that while generally the inner strength of the sequence might not be a match for a topographic survey, this is not always the case, especially when natural features are used as gcp). Other possibilities, such as measuring deviations from an object model (planarity, verticality, etc.) might also be used. The pros of using such alternatives might be no need for topographic survey; the cons are the uncertainty on the quality of the object model, the applicability only to some types of objects and a check that is partial (e.g. only two coordinates are checked by a co-planarity constraint).
3.1.1 Helmert transformation
In most cases the bundle adjustment of the image sequence is performed with free-net techniques, to get the best intrinsic precision out of the photogrammetric network. If check points are available, the orientation quality can be evaluated through International Archives of the Photogrammetry, Remote Sensing and Spatial Information Sciences, Volume XXXVIII-5/W16, 2011
the RMS of the residuals of a spatial similarity transformation that accounts for the different reference systems of the SFM and of the topographic survey. To this aim, the object coordinates of the check points in the SFM reference are determined by forward intersection, i.e. with orientation parameters fixed to the values determined by the SFM. The Helmert transformation provides the empirical accuracy on check points. Since no preference is given to any particular point, it should be preferred to the use of gcp. For this to be true, however, the gcp should be reliable and evenly distributed on the object, otherwise some points may in fact have more “leverage” than others.
3.1.2 Georeferencing the image sequence
If a fair number of ground control points is available, the block can be oriented in the standard way using just the necessary amount of points for the control and the rest as check points. The drawback of this approach is that the result might depend to some extent on the number and location of the control points used. On the other hand, it can be argued that, when some ground control is foreseen to prevent high block deformations, their use should be enforced since the solution with the free-net adjustment (or the Helmert Transformation) would be unacceptable.
3.2 Internal quality indices
Although desirable seldom, in practice, there are enough check points available (if at all) to perform external quality checks; therefore, some internal quality indices might thought of, e.g. to evaluate the image measurement accuracy and block strength. The image measurement accuracy depends primarily on the accuracy of feature extraction and feature matching; many interest operator show sub-pixel accuracy (Mikolajczyk and Schmid, 2005). Improvement of feature matching results might be gained using a signal based matching technique such as depends on many factors and that is hard to represent it with a single figure. It is also quite difficult to separate the contribution of tie point extraction and matching from the other factors such as the object characteristics (shape and texture), the actual network geometry, the image overlap, the calibration data, etc.
As mentioned above, the contribution to block strength of automatic feature extraction and matching of the sequence could conceivably be measured in absolute terms against that of an ideal reference block; otherwise, to compare different SFM observations is in the same order of that obtained by automatic methods. The idea is that this operator will be able to exploit the maximum attainable ray multiplicity for the points; the remark on “constant accuracy” means that although the point might be visible in a given image, if the perspective deformation is too high to ensure a good collimation, no measurement will be performed. This property might be measured by comparing the
relative frequency distribution of ray multiplicity with that of the automatic method (see Section 4).
The human operator will also be able to select points uniformly wherever the scene texture is fit for measurement; this is a more critical index to define, since a given texture might be all right for a matching algorithm and much harder to deal with for a human operator. The idea is to value more algorithms that covers the most “usable” area of the image (i.e. the parts of image that show significant signal content) as opposed to just image format coverage, the latter being also dependent on camera characteristics, network geometry, etc. This parameter, let’s call it object coverage, might be computed in each image as the percentage of image area fit for measurement (i.e. where the human operator would look for tie points) covered by the extracted tie points. Such statistic however is very time consuming to be calculated being, at present, manually extracted.
As far as relative performance measures are concerned, no reference to an ideal block is made, so some more standard (but somehow less revealing) parameters could be taken into account: image coverage (as opposed to object coverage) defined as the percentage of image format covered by the convex hull of the extracted tie points; the frequency distribution of ray multiplicity (number of rays per point); the number of points per image (average and minimum).
Other parameters, that may apply to both absolute and relative measures, might also be considered. For instance, the uniformity of the accuracy within the block, might be measured as the ratio of the smallest to the average error ellipsoid volume of the exterior orientation parameters.
4. TEST CASES
As test cases to evaluate, some of the image sequences made available from the Workshop organizers have been used. When image calibration parameters were available, images were first resampled to remove the image distortion with Distortion Remover, also an in-house software development, then processed with EyeDEA; in almost all cases the output tie points were undersampled with TiePointOptimizer to fit into the Photomodeler version limits. After the bundle adjustment, no attempt to increase the ray multiplicity (e.g. by back projection of the tie points) nor of improving their accuracy (e.g. by refining their image coordinates by LSM) has been performed. The first three examples refer to cases where some gcp or a high resolution DSM were available.
4.1 Myson
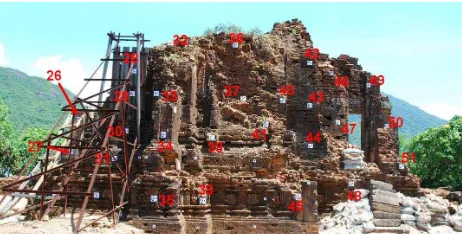
The image sequence depicts a cultural heritage site in Myson (Vietnam), a cluster of abandoned and partially ruined Hindu Temples constructed between the 4th and the 14th century. The building has largely collapsed: only the base still shows the original architectural ornaments; a steel and a wooden frame prevent the left side from falling further. Tens of pieces of paper with printed coded and non-coded targets have been attached to the building and surveyed; 26 of them are available for use as check or control points.
The original sequence runs around the whole building; slightly less than half has been provided, for a total of 18 images. The images were taken with a Nikon D80 (resolution 10 Mpix, pixel size 6.1 micrometers) with a 18 mm lens. A calibration report for the camera-lens combination was also available.
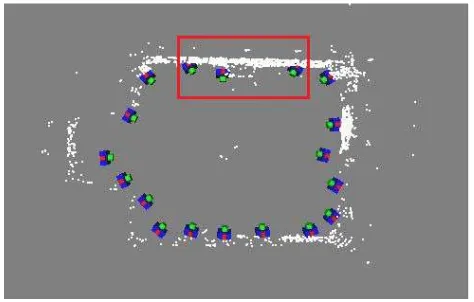
Figure 2 shows the camera stations and the tie points from of the automatic orientation process, after the bundle adjustment. International Archives of the Photogrammetry, Remote Sensing and Spatial Information Sciences, Volume XXXVIII-5/W16, 2011
Figure 1. Myson site: Location of the 26 check points
a)
b)
Figure 2. Orientation of Myson sequence: camera stations and tie points; a) top view; b) front view
The output from EyeDEA has been reduced to about 2500 points with about 11700 measurements have been processed. Table 1 shows some statistics on the quality of the block.
Min Max Avg.
Points per photo 108 1066 635
Photo coverage 46 79 59
# rays per point 4 13 5
Angle intersection (deg) 4 89 34
# rays / pt 4 5 6 7 8 9 10 11 12 13
# pts 1908 267 112 92 78 41 10 3 1 1
Table 1. Myson, automatic orientation: block strength statistics
The minimum number of points occurs at the left hand side of the sequence, because only the first four images look to that side of the building; besides, the wooden frame cause
significant occlusions that make point transfer within those images hard.
As a comparison, the block has also been measured manually using almost all the targets as well as a number of natural points, for a total of 134, with about 880 image measurements. Table 2 shows the same block statistics as of Table 1.
Min Max Avg.
Points per photo 30 61 48
Photo coverage 24 43 32
# rays per point 2 14 6
Angle intersection (deg) 5 89 54
# rays per pt 2 3 4 5 6 7 8 9 10 11 12 13 # pts 7 16 9 20 16 14 9 2 7 10 4 2 Table 2. Myson, manual orientation: block strength statistics
This distribution of ray per point may be though as of an “upper bound” for the performance of automatic image orientation. The statistics for the percentage of points with given number of rays is obviously better, with 30% of the targets traced in seven or more images (and an average angle of 54°) against 10% (and an average angle of 34°) for the automatic sequence. The average multiplicity is only slightly better (6 to 5) and the maximum intersection angle is the same, though.
Out of the 26 check points that were available for the external checks, 5 were used as gcp in the constrained adjustment. The Helmert transformation has been computed without and with data snooping; to test the effect of the choice of the gcp, two different sets have been used. Table 3 shows the statistics of discrepancies for both methods.
X (mm) Y (mm) Z (mm)
RMS max RMS max RMS Max
Helmert 7 15 11 28 6 13
Hel. data snoop. 6 11 8 17 5 11
5 gcp (1st) 6 18 15 37 5 17
5 gcp (2nd) 4 9 12 19 6 18
Table 3. Myson, automatic orientation: statistics of the discrepancies with the two methods.
Using the data snooping in Helmert (3 points pairs were removed) significantly improves both the RMS and the maximum of the discrepancies. There is also an influence on the distribution of the selected gcp, again on both counts. The figures look quite the same on the average values, while the maximum differences show larger dispersion. The accuracy of the check points from the forward intersection is in the order of 1.5 mm in X and Z and 2.4 mm in Y. Assuming a similar accuracy for the topographic survey, the discrepancies at 5% significance level are deemed statistically relevant in 24% of cases in X, 62% in Y and 38% in Z.
Table 4 shows the results for external checks on the manual block.
X (mm) Y (mm) Z (mm)
RMS max RMS max RMS Max
Helmert 6 16 9 24 5 12
Hel. data snoop. 5 10 7 18 4 11
5 gcp (1st) 5 12 11 29 4 13
5 gcp (2nd) 4 8 8 13 4 16
Table 4. Myson, manual orientation: statistics of the discrepancies with the two methods. International Archives of the Photogrammetry, Remote Sensing and Spatial Information Sciences, Volume XXXVIII-5/W16, 2011
The differences among the rows have basically the same pattern as for the automatic orientation; in the manual case the average discrepancy is slightly better (1 mm in X, Z, 3 mm in depth direction) while the maximum differences are higher.
4.2 Herzjesu
The second sequence is made of 8 images and represents a building façade (Figure 3); 19 check points were taken from the triangulated DSM over features (mostly corners) that were well defined and visually matched to the images.
The output from SFM (Figure 3, top and Table 5) has been reduced to 2700 object points and about 10000 image observations.
Also in figure 3 the comparison between the laser scanner DSM and the one obtained after the SFM stage using our dense matching software is presented: the standard deviation of the distances of the 830000 points produced by image matching from the reference data set is ca. 17 mm.
Figure 3. Orientation of Herzjesu sequence. Top: camera stations, tie points and check points (red); bottom: Comparison between laser scanner and photogrammetric DSM (color bar in
cm)
Min Max Avg.
Points per photo 404 1776 1228
Photo coverage 49 90 79
Angle intersection (deg) 8 75 25
# rays / pt 3 4 5 6 7 8
# pts 1612 655 242 120 35 38
Table 5. Herzjesu, automatic orientation: block strength statistics
The results in term of multiplicity of the tie points are rather good, with a significant percentage of points traced in six images.
As in the previous case, both the Helmert transformation and the constrained adjustment with two sets of gcp have been executed (see Table 6).
X (mm) Y (mm) Z (mm)
RMS max RMS max RMS max
Helmert 13 28 14 30 11 21
5 gcp (1st) 19 46 14 31 15 29
5 gcp (2nd) 16 34 17 38 12 22
Table 6. Herzjesu, automatic orientation: statistics of the discrepancies on check points with the two methods.
The results from the two methods are rather similar both in RMS as well as for the maximum errors in both cases. At least for the X coordinates the differences look however significant.
4.3 Fountain
The third case is a sequence of 11 images of a richly decorated fountain and the background wall; 19 check points were taken from the DSM.
The output from SFM has been reduced to 2450 object points; Figure 4 shows the camera stations and the tie points from of the automatic orientation process, after the bundle adjustment and a DSM obtained by dense matching.
Also in figure 5 the comparison between the laser scanner and the photogrammetric DSM is presented: the standard deviation of the distances of the 200000 points produced by image matching from the reference data set is ca. 7 mm.
Figure 4. Orientation of fountain sequence. Top: camera stations, tie points (white) and check points (red). Bottom: the
textured DSM obtained by dense matching. International Archives of the Photogrammetry, Remote Sensing and Spatial Information Sciences, Volume XXXVIII-5/W16, 2011
Figure 5. Orientation of Fountain sequence. Comparison between laser scanner and photogrammetric DSM (color bar in
cm)
Min Max Avg.
Points per photo 497 1172 891
Photo coverage 56 85 75
Angle intersection (deg) 10 89 33
# rays / pt 3 4 5 6 7 8 9 10 11 # pts 1288 476 278 194 123 45 25 10 12
Table 7. Herzjesu, automatic orientation: block strength statistics
The external checks on the image have been performed with both Helmert transformation and ground control points, using two sets of 4 gcp each. Table 8 shows the statistics of the discrepancies.
X (mm) Y (mm) Z (mm)
RMS max RMS max RMS max
Helmert 7 19 6 12 7 25
6 gcp (1st) 7 22 6 17 9 34
6 gcp (2nd) 8 24 8 21 18 33
Table 8. Statistics of the discrepancies with the two methods based on 19 gcp taken from the DSM.
The discrepancies look rather similar with both methods, even for the maximum values. The choice of the gcp influences the RMS in the Z coordinate.
4.4 Castle
The fourth case is a sequence of 18 images in the inner courtyard of a castle. The sequence runs around the whole courtyard framing the opposite building façade. Images were taken with a digital camera (resolution 3072x2048 pixel, pixel size 11.7 micrometers) with a 35 mm lens. The output from the SFM has been reduced to 3213 object points; Figure 6 shows the camera stations and the tie points of the automatic orientation process, after the bundle adjustment.
The RMS of the collinearity equations residuals is ca. 0.4 pixel (4.6 µm), while the mean of the largest residuals is less than 0.6 pixel (7.2 µm). Due to the high redundancy and matching accuracy a precision in object space of ca. 1/1500 the object size has been achieved. The first part of the sequence returns a higher number of points per image with respect to the second part; the reason is that the first eleven images look to the façade that has a better texture (with many decorative paintings) which provides plenty of recognizable features for the interest
operator. In the three images framed in Figure 6, the scene perspective changes abruptly, making the identification of homologous points and their filtering more difficult. Table 9 shows some statistics of the sequence tie point distribution.
Figure 6. Orientation of castle sequence: camera stations; tie points (white)
Min Max Avg.
Points per photo 67 1364 632
Photo coverage 39 80 65
# rays per point 3 10 4
Angle intersection (deg) 10 83 23
Table 9. Castle: block strength statistics.
A factor 20 between the minimum and maximum number of points per photo highlights some trouble in extracting tie points along the strip. Besides the above mentioned remark on texture, this is probably due, as it is also apparent from Figure 6, to an average base-length that is larger in the upper section of the sequence.
4.5 Piazza Navona
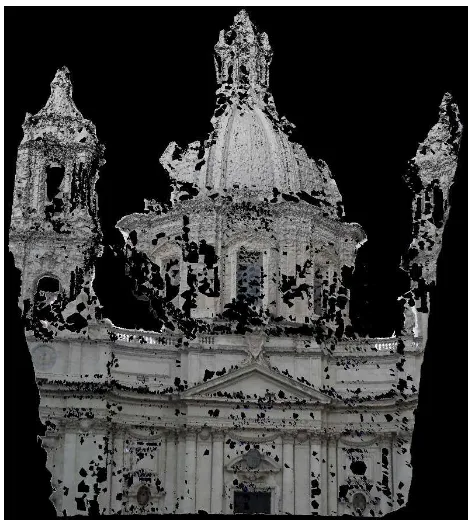
The fifth case is a long sequence of 92 images of one of the most famoussquares of Italy: Piazza Navona in Rome. Defined as a public space in the last years of 15th century, when the city market was transferred there from the Campidoglio, Piazza Navona is an outstanding example of Baroque architecture and art. In the centre stands the famous Fountain of the Four Rivers (1651) by Gian Lorenzo Bernini and the church of Sant'Agnese in Agone by Francesco Borromini and Girolamo Rainaldi. The sequence runs around the whole square framing the opposite façades along the long sides; on the short sides the images are taken along an arc path. The camera used is a Samsung ST45 (resolution 4230x3174, pixel size 1.5 micrometers) with a 6 mm lens (34 mm lens for a 36 mm sensor). The output from SFM has been reduced to 2893 object points; Figure 7 shows the camera stations and the tie points of the automatic orientation process, after the bundle adjustment. International Archives of the Photogrammetry, Remote Sensing and Spatial Information Sciences, Volume XXXVIII-5/W16, 2011
Figure 7. Orientation of Piazza Navona sequence. Top: camera stations and tie points. Bottom: DSM of the façade church of
Sant'Agnese.
Min Max Avg.
Points per photo 63 218 126
Photo coverage 34 85 56
# rays per point 3 10 4
Angle intersection (deg) 3 61 15
Table 10. Piazza Navona: block strength statistics.
After the final bundle adjustment the RMS of the collinearity equations residuals is ca. 1 pixel (1.5 µm) with mean largest residual less than 1.4 pixel (2.1 µm). Due to the high redundancy and accuracy of the collimation a final precision in object space of ca. 1/1600 the size of the object is achieved. At the bottom of frames there are many people that occupying part of frame makes the identification of homologous points in the lower area of the image difficult. The area of “corners” is quite tricky; the base-lengths between consecutive images are short but there are strong changes of perspective at the corners.
4.6 St Jean
The sixth case is a sequence of 66 images depicting a dome, supported by columns and arcs, in a courtyard. The sequence path runs around the object and then enters under the dome to survey its intrados.
Images were taken with a Nikon D3X camera (resolution 6255x4175, pixel size 6 micrometers) with a 20 mm lens. A calibration report for the camera-lens being not available, a preliminary estimation of block geometry was performed. Thresholds larger than normal were set in the processing; the essential matrix being not available, the fundamental matrix and the trifocal tensor were estimated; after the SFM estimation a full field calibration was performed to obtain the interior orientation and distortion parameters. Since the images were not taken in sequence and were acquired at different times of the day (i.e. with different lighting conditions), to allow the SFM algorithm to extract the correspondences with high redundancy a reduced sequence, with an ad hoc selection of images, was
first processed. Once the interior orientation parameters were computed, the image distortion was removed and the whole sequence was processed again in the standard way. The output from SFM has been reduced to 2964 object points. After the bundle adjustment (see Figure 8), the RMS of the collinearity equations residuals is ca. 1 pixel (5.98 µm) with mean largest residual less than 1.5 pixel (8.97 µm). A precision in object space of ca. 1/600 the size of the object was obtained.
Figure 8. Orientation of St Jean sequence: camera stations and tie points
Min Max Avg.
Points per photo 31 345 211
Photo coverage 57 90 76
# rays per point 3 16 5
Angle intersection (deg) 3 89 23
Table 11. St. Jean: block strength statistics.
4.7 Campidoglio
The seventh case is a sequence of 53 images of the Piazza del Campidoglio (Figure 9, top), designed by the Renaissance artist and architect Michelangelo Buonarroti in 1536–1546. The sequence moves along the two main sides and turns abruptly to image the city hall with a series of images at short range one from another and with strong changes of perspective. The lack of a closed loop, where the overlap between the first and last image effectively prevents the unbounded accumulation of small orientation errors, as in the previous three cases, weakens the block. Since also control points are not available, the sequence reconstruction after the bundle adjustment (Figure 9, bottom) appears to drift, as the angle between the facades of the two opposite buildings looks too small compare to the aerial view. Images were taken with a Canon Powershot G10 (resolution 4248x 3188, pixel size 1.87 micrometers) with a 6 mm lens (27 mm lens for a 36mm sensor). The output from SFM has been reduced to 2561 object points. Table 12 shows the block statistics.
As it is apparent from the Angle intersection column, there are a significant number of images taken almost standing still, just rotating the camera, as noticed above. After the final bundle adjustment, the Root Mean Square (RMS) of the collinearity equations residuals is ca. 1.3 pixel (2.4 µm) with mean largest residual less than 1.8 pixel (3.3 µm). A precision in object space of ca. 1/1000 the size of the object has been estimated.
Figure 9 – Orientation of Campidoglio sequence: left: Aerial view of Piazza del Campidoglio (from Google Maps); right:
camera stations and tie points
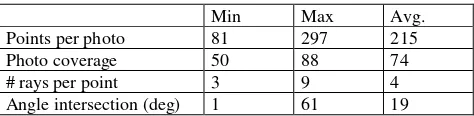
Min Max Avg.
Points per photo 81 297 215
Photo coverage 50 88 74
# rays per point 3 9 4
Angle intersection (deg) 1 61 19 Table 12 – Campidoglio: block strength statistics.
5. CONCLUSIONS
Automatic image orientation in terrestrial photogrammetry has made very significant progresses; many implementation successfully manage to orient sequences in complex environments. As far as the metric use of such results is concerned, though, moving towards some sort of quality standards such as those developed in aerial photogrammetry should be encouraged. Although algorithmic development must continue, an assessment of precision and reliability of automatically oriented image sequences should be included in the processing pipeline; efforts should be encouraged to address the network design, which is strictly connected to such quality parameters. A comparison with manually oriented blocks should also perhaps help to highlight the benefits that this further step in automation might bring to the application of photogrammetry in close range.
6. REFERENCES
Bay, H., Ess, A., Tuytelaars, T., Van Gool, L., 2008. SURF: Speeded up robust features. Comput. Vision Image Und., 110(3): 346-359.
Beis, J.S., Lowe, D.G., 1997. Shape indexing using approximate nearest-neighbour search in high-dimensional spaces. In: Proc.of CVPR 1997, pp. 1000-1006.
Forlani G., Pinto L. (2002). Integrated INS/DGPS systems: calibration and combined block adjustment, OEEPE Official Publication, N°. 43, pp. 85-96.
Grün, A., 1985. Adaptive least squares correlations: a powerful matching techniques. South African J. Photogramm. Remote Sensing and Cartography, 14(3): 175-187.
Hartley, R.I, Zisserman A., 2004. Multiple View Geometry in Computer Vision. Cambridge University Press, UK, 2nd ed., 672 pp.
Heipke, C., Jacobsen, K., Wegmann, H. (2002) – Analysis of the Results. OEEPE Official Publication, N°. 43, pp. 31-52.
Kraus, K., 1997. Photogrammetry – Vol. 2. Dümmler, Bonn, Germany, 466 pp.
Mikolajczyk, K., Schmid, C., 2005 A Performance Evaluation of Local Descriptors IEEE Transactions on Pattern Analysis And Machine Intelligence, 27(10): 1615-1630.
Nister, D., 2004. An efficient solution to the five-point relative pose problem. IEEE T, Pattern Anal., 26(6): 756-770.
Welch, B. L. (1947), "The generalization of "Student's" problem when several different population variances are involved", Biometrika34 (1–2): 28–35, doi:10.1093/biomet/34.1-2.28
Waldhaeusl, P., Ogleby, C., 1994. 3x3-Rules for Simple Photogrammetric Documentation of Architecture. International Archives of Photogrammetry and Remote Sensing, Melbourne, Australia, Volume XXX, Part 5, pp. 426-429.