RECENT RESULTS FROM EO STUDIES ON INDIAN CARBON CYCLE ASSESSMENT
V.K.Dadhwal., S.P.S.Kushwaha*, Sarnam Singh*, N.R.Patel*, R.K. Nayak, P.Patil*,
C.B.S.Dutt, M.S.R.Murthy, C.S. Jha, G.Rajsekhar, G.S.Pujar, Shivam Trivedi, Neerja Sharma and M.M.Ali National Remote Sensing Center, ISRO, Hyderabad, India
*Indian Institute of Remote Sensing,ISRO,Dehradun,India KEYWORDS: Indian Carbon, Remote Sensing, EO systems, Monitoring, Modelling, Simulation ABSTRACT
The monsoon based climate system, diverse land use and land cover distribution and cultural practices poses complex issues in monitoring, assessment and simulation of Indian carbon cycle. Several studies reported lack of spatially and temporally consistent databases, need for calibration and validation of models, and development of national frame work to maintain consistency and completeness in efforts and reduction of uncertainty. Considering the need, as part of ISRO Geosphere Biosphere Programme, National Carbon Project (NCP) initiative was taken up to understand and assess land, atmosphere and oceanic components of carbon cycle with a significant scope for integration of remote sensing, geospatial and process based models. The results from the initial studies are discussed in the paper. An increase of the country’s forest carbon stocks from 6244.8 to 6621.6 Mt with an annual increment of 37.7 Mt of the carbon from 1995 to 2005 is reported. In the national scale, CASA model based average annual NPP is estimated to be 1.5 Pg C Yr-1 and is increasing at the rate of 0.005 Pg C Yr-2 during past 25 years from 1981-2006. Analysis of Mid tropospheric CO2 levels retrieved from AIRS data since 2002 till now revealed increasing rate of CO2 at 2.14 ppmv yr-1. It was also o found that biosphere uptake over India and oceanic uptake over the south Indian Ocean could play positive role on the control of seasonal variability of atmospheric carbon dioxide growth rate The paper presents further details on different sub components, recent results and challenges ahead of the project.
1. INTRODUCTION
Recent studies of Zhao and Running (2011) on changes in global NPP during 2000-09, decline in the global land evapo transpiration trend during 1998-2008 due to limited moisture supply (Jung et al, 2010) and development of continuous satellite derived record of land surface evapo transpiration from 1983-2006 (Zhang et al, 2010) signifies the importance and scope of global, regional and national EO systems and field measurement networks. Recognizing the growing need for improved Earth Observations, Group on Earth Observations (GEO) plans to produce globally harmonized data sets on global, national and local scales, using common algorithms, variables and units; as well as, to develop an integrated model that stitches all carbon observations together (Ciais et al, 2011).
Indian terrestrial ecosystem acts as spatially and temporally variant carbon source and sink due to monsoon based climate system; diverse land use and land cover distribution and cultural practices. The agriculture covering around 180 M ha and forests covering 68 M ha contributes largely to terrestrial carbon dynamics in India (Chhabra et al 2004, Kaul et al 2009).The diverse cropping patterns, wet land rice ecosystems and temporally variant dry land agriculture makes Indian agriculture carbon fluxes assessment and understanding complex. The diverse forest structure and composition, phenology, fire regimes, biotic disturbances, extractions and large reservoir of trees outside forests plays larger role in Carbon sequestration and shaping the carbon budget (Bhat and Ravindranath,2011). Unlike the regular forest inventories, soil inventories are rarely repeated on a regular basis and require chrono sequenced sampling to understand the impacts of different management regimes and land use changes on Carbon dynamics.
Approximately 0.8 Pg C yr-1 is transported to the oceans by the world’s rivers and India has several perennial rivers and long coastline. It is important to properly understand air sea CO2
exchanges and quantify the Carbon estimates due to fresh water and coastal dynamics as it constitutes a redirection of a substantial portion of the net terrestrial sink (Doney and Hood, 2002). The diverse natural and anthropogenic sources of CO2 and long range transport of atmospheric gases across varied topographic gradients as a function of intra and inter annual climatic variations affects sink potential of different categories of land cover. This necessitates regular measurements and monitoring of atmospheric CO2 and its transport modelling.
There has been an increasing trend in assimilating EO data towards understanding of land surface processes, climate measurements and carbon pools and fluxes (IPCC 1995). Phenological shifts, vegetation cover and type changes (Ranjith et al, 2011; Rajiv et al, 2011) fire monitoring and biomass burning (NRSA, 2006), feedbacks to regional climate and CO2 -fertilization (Bala et al, 2010), estimation of net carbon flux caused by deforestation and afforestation in India (Kaul et al 2009; Subodh et al., 2011) are a few recent studies reported over India using EO data.
The studies conducted over India have strongly envisaged a need for national level initiative for understanding of terrestrial carbon cycle considering the diversity of terrestrial ecosystems, monsoon climate and its controls on C fluxes over land and oceans, commitments to UNFCC international protocols. In addition, an integrated approach of uniformly designed national field campaigns, retrieval and calibration of satellite based biophysical and geophysical variables and integrated modelling approaches for carbon cycle understanding, monitoring and simulation is suggested. Against this background, as part of ISRO Geosphere and Biosphere programme, National Carbon Project (NCP) was undertaken with the following major goals
¾ To establish an observational network and create remote sensing-based spatial databases for modeling and period as-sessment of net carbon balance in India
¾ To provide support to Second National Communication (SNC) activity of Ministry of Environment and Forests, GOI to UNFCC with respect to carbon balance
The National Carbon Project was implemented as a set of three inter-related sub-projects and recent results from different sub projects and challenges ahead of the project are presented in the paper.
2. VEGETATION CARBON POOLS
The vegetation carbon pools assessment was carried out with the following two objectives:
¾ Assessment of terrestrial vegetation biomass in the country using ground sampling and satellite remote sensing data
¾ To generate geospatial data of the terrestrial phyto mass Carbon of India along with estimates of uncertainty.
2.1 Vegetation Carbon Pools – Forests (VCP – F)
As part of (VCP – F), an optimal phytomass density observation, modeling and mapping approach for national-scale forest carbon pool assessment was defined. A multi-institutional national phytomass measurement program consisting of 54 institutions and 74 Principal investigators was carried out. A total of 6500 field plot data from forests and trees outside forests was collected with defined sampling protocols. The forest density, vegetation type map, accessibility (nearness to road), normalized difference vegetation index and district boundary have been used to select sites for sampling. 2350 permanent sample plots were identified for further monitoring as well as for quality assurance. 753 regional species volume equations and general equations were collated based on FRI and FSI publications. Specific gravity data of 16,400 species of the Asia has been collected. Specific gravity of 86 fire wood trees and shrub growing in wasteland/degraded sites has been added. A geo-referenced relational database of plot wise forest inventory and biomass density estimates was prepared. Pilot studies in 16 test-sites in different ecological regions in the country have been taken to test the methodology for biomass estimation and spectral modeling using optical and microwave data in forest ecosystem. End-to-end analyses at eight sites have been completed. Spectral modelling for biomass estimation using LISS III, Landsat ETM+, MODIS data and ground based observations has been completed over Surat, Srinagar (Kashmir), Panna District, Uttar Kashi (UK), Haryana, southern part of Karnataka and Arunachal Pradesh (Patil et al, 2011). Interferometric Water Cloud Model (IWCM) has been successfully applied for forest biomass retrieval in Dudhwa National Park.( Pandey et al, 2010).
Recent estimates found that conservation policies have resulted in increase of the country’s forest carbon stocks from 6244.8 to 6621.6 Mt with an annual increment of 37.7 Mt of the carbon from 1995 to 2005 (Jagdish et al, 2011). The field based basal area and stand height collected from 17,500 plots and spatial information on multi temporal spectral data, terrain, climate, forest type and crown density was related using random forest
decision tree algorithm to develop spatial explicit basal area surfaces at 1x1Km grid. The estimated basal area ranged from 70-260 m2 / Km2 .
2.2 Crop NPP (above and below ground) from historical agricultural statistics data:
Vegetation Photosynthesis Model (VPM) based on original Monteith’s growth analysis approach is implemented to derive decadal and annual dry matter productivity over cropland of India. Solar radiation databases over Indian sub-continent were generated using monthly MODIS derived cloud cover using Angstrom & Prescott Model. Spatially explicit fields of time-varying incident Photosynthetically Active Radiation (PAR) and fraction of PAR were derived from remote sensing data. Fraction of absorbed photosynthetically active radiation was computed based on linear scaling of NDVI and chlorophyll related Enhanced Vegetation Index (EVI). Spatial distribution of maximum light use efficiency is derived by adjusting for spatially varying proportion of crop groups such as C3 and C4 crops. Environmental stress scalars for adjusting potential productivity were derived from combination of daily grided climate from IMD and decadal RS based land surface wetness indices. (Patel et al, 2010 and Wani et al, 2010).
Decadal, seasonal and annual dry matter productivity was computed over cropland. Crop biomass measurement on fort-nightly interval for selected sites (1 km) is processed for deriving relationship between biomass and spectral indices. Crop statistics conversion to crop NPP was done based on crop specific constants. In addition to district level crop NPP estimates for (2002-2006), historical (1950-2005) crop statistics were converted to above-ground (ANPP) and below-ground biomass. Generation of spatial databases based on district-level crop NPP and area, existing cropland fraction and potential cropland distribution is in progress. Tress Outside Forests (TOF) are estimated using geospatial sampling procedures involving potential TOF strata(Surface water bodies, , urban vegetated area, agriculture area , rail and road) obtained from IRS LISS –III (23m resolution) satellite data/SOI toposheets and tree number obtained from optimally sampled CARTOSAT-1 satellite data (2.5m resolution) and field sampling. The tree numbers are derived at 5x5Km2 grid through suitable statistical up scaling procedures. The pilot studies conducted over Northern Telanagana region have reported estimated number of tress as 1850/25Km2 and in Haryana(Panchkula and Yamuna Nagar ditricts) estimated number of tress are 3761/25Km2 .The efforts are being made to make national estimates involving sampling over homogenous zones identified using topography, hydrology and climate . 2.3 Soil Carbon Pools
work is being developed to integrate field data with LULC, topography and drainage information to assess the soil Carbon Pools. (Krishan et al., 2009 and Velmurugan et al,, 2009). 2.4 Soil and Vegetation – Atmosphere Fluxes:
The tower based flux measurements are reported to provide unbiased regional estimates of CO2 fluxes (Baldochi et al, 2001). Initial efforts were made to identify the needs and approach for developing flux net work over India (Sundareshwar et al, 2007). As part of National Carbon Project (NCP) initiative of ISRO-GBP a nationwide network of carbon towers in major forests, croplands and grasslands for the measurement and modeling of the net carbon flux using eddy covariance techniques, satellite remote sensing data and models is planned. Accordingly the Soil and Vegetation – Atmosphere Carbon Flux study is being conducted with the following objectives:
Analysis of atmospheric CO2 patterns to study spatio – temporal Carbons source-sink relations over India.
Establishment of flux towers and measurement of eddy covariance and meteorological parameters to study the exchanges of carbon dioxide (CO2), water vapor and en-ergy balance between terrestrial ecosystems and the at-mosphere.
Measurement and spatial modeling of soil CO2 fluxes
Integration of observations and component – wise model-ling for conducting full carbon balance accounting of In-dia and estimation of net carbon balance.
Three towers at forest sites of 15-20 m height at Barkot,Uttaranchal; Haldwani, Uttaranchal and Bethul ,M.P were established. Bethul tower is recently initiated to record flux measurements. A new tower in mangrove forests of Sunderabans is being established. Site specific studies were also conducted for measurement and modeling of soil respiration and emission fluxes using automatic soil C02 exchange system at Haldwani tower site. One 3 meter tower at Agriculture site (Meerut) with open Path flux tower has been installed in an agro-ecosystem at Modipuram, Meerut in the campus of Sardar Patel University of Agriculture and Technology to measure net CO2 exchange between atmosphere and crop canopy. The biophysical data thus generated is being analysed to understand diurnal, seasonal and inter annual variation in carbon and water fluxes and NPP modeling using RS based models.
The raw data were processed to derive half-hourly fluxes of carbon, water vapour and sensible heat by using standard micro-meteorological software installed on CR-3x data-logger. Field measurements such as leaf area index, soil moisture and chlorophyll content index were measured at weekly interval. Half-hourly photosynthetically active radiation above and below wheat canopy was measured on a weekly basis. Daily GPP and ecosystem respiration (Re) was computed from half-hourly NEE after applying gap filling, filtering and nocturnal NEE-temperature relationship. Day-time ecosystem respiration (Re) was computed by applying temperature response function to half-hourly temperature data.
Light-response curves and its parameters were derived at different growth stages of wheat by fitting rectangular hyperbolic functions between measured GPP and absorbed photosynthetically active radiation. Diurnal pattern in Net ecosystem exchange (NEE)
reveals negative NEE during day-time representing CO2 uptake and positive during night as release of CO2. The amplitude of the diurnal variation in NEE increased with growth of wheat and reached its peak around the pre-anthesis stage. The mid-day uptake during this stage was around 1.15 mg CO2 m-2s-1 and night-time release was around 0.15 mg CO2 m-2s-1. Large daily GPP above 30 g CO2 m-2d-1 continued until mid of anthesis stage (15 march) and decline rapidly during maturity stage. (Patel et al., 2010 and Patel et al, 2011).
The Haldwani flux tower is established over mixed plantation and natural forests of Uttaranchal state in collaboration with Univ. of Tuscia, Italy, ICFRE and Forest Department. The flux tower at Haldwani is equipped with CSAT sonic anemometer, LI-7000 closed path gas analyzer, radiation and soil thermal sensors. Measurements are logged at 10 Hz interval using industrial PC.Half-hourly CO2 flux measurements corresponding to dry period (18-28 Jan, 2009) and flush stage (April, 2009) were processed to study the diurnal variation in net ecosystem exchange and its response to environmental variables. Light-response curves were derived for quantifying quantum photosynthetic efficiency. Efficiency worked out to be 0.021 µmol CO2 µmol photon-1 during flush stage. Respiration-temperature response was also evaluated to derive Q10 coefficients. In order to quantify CO2 fluxes over large region, initial efforts are made to upscale site-specific data using process based ecosystem models.
2.5 Scaling of carbon fluxes by Modelling techniques
Carbon dioxide (CO2) is a major greenhouse gas and its rapid increase in the atmosphere after the pre-industrial time is the cause of recent time global warming and climate change (IPCC reports 1995). Much of the current increasing trend of CO2 is attributable to the 6-fold increase in human use of fossil fuel, deforestation and other anthropogenic activities. Of the total anthropogenic CO2 emission, only 30 - 40% remains in the atmosphere and the rest is being absorbed by ocean and terrestrial biosphere (IPCC reports 1995). While anthropogenic release of CO2 is continuously increasing at a rapid rate, sinking strength of the natural system: terrestrial biosphere and ocean is decreasing (Berthelot et al., 2005). Thus controlling the growth rate of atmospheric CO2 by reducing the anthropogenic CO2 release and helping natural system for enhancing uptake capacity of atmospheric CO2 is a major challenge.
surface reflectance products, micrometeorological and Production efficiency approaches (Nethaji, 2010). These limited studies indicate a large gap in data, calibration and validation of modelling which are being addressed in the NCP project.
Measurement through ground base network over India
For quantitative understanding of regional CO2 transport and its variations with regional environmental boundary condition different spatial and temporal scales have to be analysed through field measurements. The distributed dense networks of observations would be useful to represent the CO2 changes due to geographic and local environmental conditions. NCP is making continuous efforts towards multiplying ground based net work across the country by installing sensors for measuring boundary layer atmospheric CO2, flux towers for measuring the CO2 flux exchanges between selected ecosystems and atmosphere.
Under this program, Vaisala CARBOCAP GMP343 are installed at six stations and some are under plan. The Vaisala CARBOCAP GMP343 is an accurate and rugged probe type instrument that can measure atmospheric CO2 with acceptable compromise between size, response time accuracy and stability. Analysis of data obtained from Dehradun station for the year 2009 was done (Neerja et al. 2011) and work is under progress for other stations. The data at Dehradun exhibit distinct diurnal and semi-annual cycles. CO2 decreases during sunrise to afternoon and increases during afternoon to sunset. It remains higher during the night time. The semi-annual cycle has decreasing phase during Feb-March and July-Sep, and has increasing phase during rest of the period. This observed variability of atmospheric CO2 is mostly driven by local ecosystem activity.
Analysis of satellite measured atmospheric CO2
Recently several space based observation programs such as Atmospheric Infra Red Sounder (AIRS), SCanning Imaging Absorption spectro Meter for Atmospheric CartograpHY (SCHIAMACHY), Greenhouse gases Observing SATellite (GOSAT).AIRS can measure CO2 at mid troposphere while SCHIAMACHY and GOSAT can measure columnar atmospheric CO2. We have analyzed the data obtained from these satellite observations over India and surrounding oceans and tried to link with surface fluxes (source and sink). Since AIRS provides observations since 2002 till now, this data has been extensively used for analysis (Nayak et al. 2011). An increasing rate mid tropospheric CO2 is 2.14 ppmv yr-1 is observed, which is almost the same as that of observed CO2 at Maunaloa.
The data exhibited distinct annual cycle with decreasing phase during June-October and increasing phase during rest of the period in a year. The annual cycle has larger amplitude over the land than over the oceans. There also exist inter-annual variations in the observation. In order to understand the causes of such variability, we have computed fluxes of CO2 exchanges over the land (India) and over the oceans through integrating different data bases (remote sensed and observed) in to different models developed in the recent past for the purpose. The description of the modelling approach followed is provided in Nayak. et al. 2011. Comparison between the variability of atmospheric CO2 anomaly with the anomaly of surface fluxes over India and surrounding oceans suggests that biosphere uptake over India and oceanic uptake over the south Indian Ocean could play positive
role on the control of seasonal variability of atmospheric carbon dioxide growth rate. On inter-annual scale, flux exchanges over the tropical north Indian Ocean could play positive role on the control of atmospheric carbon dioxide growth rate (Nayak et al. 2011).
Modeling NPP, NEP and associated parameters related to Carbon Cycle over terrestrial India
Net primary productivity (NPP) is defined as the net carbon uptake by green plants per unit time and space through photosynthesis and respiration processes. NPP minus the heterotrophic (soil) respiration is the Net Ecosystem Productivity (NEP). NPP is the net carbon exchange between vegetation and atmosphere, while NEP is the net carbon exchange between the vegetation-soil system and the atmosphere. Thus estimates of both NPP and NEP in regional and continental scale are very important for understanding variability of atmospheric CO2 in seasonal, inter-annual and climate scales.
The Carnegie–Ames–Stanford Approach (CASA), a terrestrial biosphere model, has been used to investigate spatiotemporal pattern of net primary productivity (NPP) during 2003 over the Indian subcontinent. Sensitivity analysis suggest that the difference could be due to inclusion of variable light use efficiency (LUE) across different land cover types and environment stress scalars as down regulator of NPP in the present CASA model study.(Nayak et al, 2011).
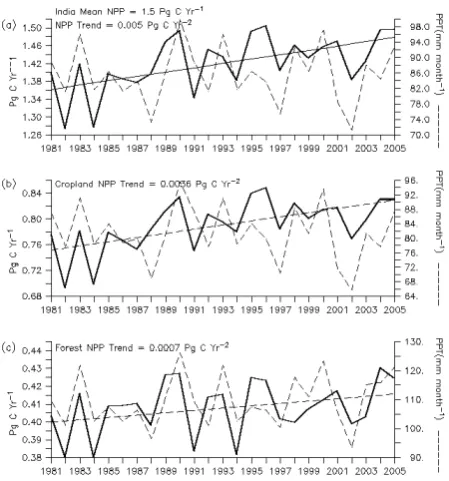
Figure 1. Inter annual Variations in NPP; a) Annual total NPP (solid line) and mean precipitation (ppt: dotted line) over the country. The trend line is drawn corresponding to annual total NPP; b) The same as in (a) but for the crop lands; c) the same as in (a) but for the forest region over the country.
resolution. The model was forced by time varying spatially explicit input of satellite greenness index, solar radiation, air temperature, precipitation plus soil and vegetation cover maps. Monthly simulations of NPP, NEP and etc. are for the period of past 25 years 1981-2006 and simulation was now extend up to 2009. Seasonal and inter-annual variability of NPP and NEP and their control by the climate has been extensively analyzed. Results suggest that both NPP and NEP have exhibited large seasonal and inter-annual variability. In the national scale, average annual NPP is estimated to be 1.5 Pg C Yr-1 and is increasing at the rate of 0.005 Pg C Yr-2 during past 25 years from 1981-2006. This trend is equivalent to 8.5% over the country during past 25 years (Fig 1).
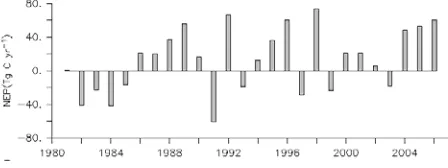
This increase is primarily due to the enhancement of productivity over agricultural lands in the country. Variability of precipitation has stronger role on the control of inter-annual variability of NPP (Figure 1). Spatial distribution of NPP trend is different in different places and in different periods. In the recent time (1995 onwards), large decline of NPP over the Indo-Gangetic plane is observed owing to decline of rain over the regions (Figure 2). Estimated NEP budget for the country suggest that, on an average India is the region of net sink of atmospheric CO2 with total annual uptake of 9.5 Tg C yr-1. Estimated long term linear growth rate of NEP over the country was 1.8 Tg C Yr-2 (8.5%) which is small but significant. There exists strong inter-annual variability of NEP over the country. Except early period (1981-1985), most of the years India is net sink of atmospheric CO2 (Figure 3).
Figure 2 Mean NPP (upper panel) and precipitation (lower panel) over the Indo-Gangetic plains.
Figure 3. Annual total NEP over India during 1981-2006.
2.6 Estimation and modeling of geochemical C-fluxes-weathering, wetland effluxes, sediment erosion and deposition, riverine and coastal C-flows.
Geochemical fluxes, comprising of variety of processes, though much smaller in magnitude comprise important fraction of characterizing carbon balance. In this context laboratory facility equipped with TOC analyser, Ion chromatography required for hydro- geochemistry was established at IIRS,Dehradun and pilot studies were conducted over representative watersheds Song, Asan and Sonali in Northern India to collect fresh seasonal stream water sampling during Aug 2006-Feb 2009.
The study revealed average CO2 consumption ranging from 1.7 to 26.2 (x10000 moles/km2/yr) (Song being the highest and Solani lowest). This indicated that atmospheric CO2 drawdown would be about 4.4 billion moles/yr for total area of about 2200 sq km of all three watersheds. Estimated annual dissolved carbon (DC=DIC+DOC, inorganic and organic) flux varies from about 2.5 to 51 t/km2/year. Non monsoonal flux was observed to be half that of monsoonal flux. DC concentration was found to be similar in all three watersheds. Results of limited sampling showed that major contribution of total carbon (including dissolved and particulate) flux and yield come from dissolved fraction.
Using RUSLE and MMF models attempt was made to quantify potential soil loss and soil organic carbon loss for entire country with RS based inputs. Annual loss was estimated to be 23.2 and 23.8 t/ha/yr and SOC loss of about 168 and 140 kg/ha/yr. Out of major river basins, Brahmaputra basin was having highest soil erosion (~34 t/ha/yr) and SOC loss (~507 kg/ha/yr avg) where Ganga basin showed 130 kg/ha/yr SOC loss. Collaboration with Jadhavpur University is taken up to study carbon budget in human interfered (Jharkhali) and un-disturbed site (Lothian island) of Mangrove Forests of Sunderbans, West Bengal.
3. CHALLENGES AND GAP AREAS – APPLICATION OF EO SYSTEMS:
The repeat inventory of around 2500 permanent field plots, application of LIDAR and CARTOSAT 3D models for integration of remote sensing based stand height information and adoption of geospatial techniques and canopy architecture models in uncertainty assessment and reduction of are a few areas research towards improved biomass estimates. RS based up scaling and assessment of NPP over forest and agriculture sites, coupling with biospheric and atmospheric models for carbon cycle modeling and simulation, work on requirement of establishing new towers are the thrust areas in generation and assimilation of flux tower data. The application of data mining techniques in geospatial quantification of soil C pools, studies on soil carbon dynamics in chrono sequence in different landscapes and characterization soil respiration as a function of land cover, soil moisture and temperature are the areas to be further addressed in soil carbon pools assessment and dynamics.
are necessary for retrieval and validation atmospheric CO2 from AIRS, TES, IASI and GOSAT and future satellite missions, understanding of surface sources and sinks at higher spatial resolutions, and atmospheric inversions modelling. Coastal carbon dynamics through an integrated approach of assessing the cycles of Carbon in surface waters (major rivers, reservoirs, lakes and estuaries) through systematic measurements of TA, pH, DIC and PC also requires attention. Budgeting of air- water flux at seasonal to annual scales for the above aquatic systems need to be accordingly addressed. The hydro geochemistry component of Carbon flux using monitoring of river transportation of particulate and dissolved carbon, in the critical river basins needs attention. The study should address detailed field measurements consisting of DC, pCO2, estimation of CO2 uptake in silicate, carbonate and lithological facies and computation average CO2 consumption by chemical weathering. Implementation of atmospheric transport model (TM5) to simulate CO2 in the atmosphere over India and surrounding oceans is to be planned. Integration of VCP-SOIL-FLUX data and long-term simulation of terrestrial-biosphere exchanges using biosphere models, long-term simulation of ocean CO2 flux exchanges (using del pCO2, wind-speed, SST, SSS etc),Inverse modeling/assimilation of atmospheric CO2 (transport model) data and Constrain transport modelling with time varying land and oceans based natural and anthropogenic surface fluxes should contribute to integrated carbon modelling and simulation.
REFERENCES
Bala Govindasamy, Ranjith Gopalakrishnan, Mathangi Jayaraman, Ramakrishna Nemani and N. H. Ravindranath, September 2 2010. CO2-fertilization and potential future terrestrial carbon uptake in India. Mitigation and Adaptation Strategies for Global Change, DOI 10.1007/s11027-010-9260-z. Baldocchi Dennis, Eva Falge, Lianhong Gu, Richard Olson, David Hollinger, Steve Running, Peter Anthoni, Ch. Bernhofer, Kenneth Davis, Robert Evans, Jose Fuentes, Allen Goldstein, Gabriel Katul, Beverly Law, Xuhui Lee, Yadvinder Malhi, Tilden Meyers, William Munger, Walt Oechel, K. T. Paw U, Kim Pilegaard, H. P. Schmid, Riccardo Valentini, Shashi Verma, Timo Vesala, Kell Wilson, and Steve Wofsy, 2001. FLUXNET: A new tool to study the temporal and spatial variability of ecosystem-scale carbon dioxide, water vapor, and energy flux densities. Bull. Am. Meteorol. Soc. 82, pp. 2415–2434.
Berthelot, M., P. Friedlingstein, P. Ciais, Jean- Louis Dufresne, and P. Monfray 2005. How uncertainties in future climate change predictions translate into future terrestrial carbon fluxes, Global Change Biol., 11(6), 959 – 970.
Bhat D. M. and Ravindranath N. H., 2011. Above – Ground Standing Biomass and Carbon Stock Dynamics under a Varied Degree of Anthropogenic Pressure in Tropical Rain Forests of Ut-tara Kannada District, Western Ghats, India. Taiwania, 56(2), pp. 85-96.
Chhabra A and Dadhwal V.K, 2004. Estimating terrestrial net primary productivity over India using satellite data. Current Science, 86(2), pp. 269-271
Ciais, P., Dolman, A.J., Dargaville, R., Barrie, L., Bombelli, A., Butler, J., Canadell, P., Moriyama, T. (2010). GeoCarbon Strat-egy, Geo Secretariat Geneva,/FAO, Rome, 48 pp.
Dadhwal V.K, Pandya N. and Vora A.B., 1998. Carbon cycle for Indian forest ecosystem: A preliminary estimate. In GLOBAL CHANGE STUDIES: Scientific Results from ISRO GBP 1998, BH Subbaraya, DP Rao, PS Desai, B Manikiam, P Rajaratnam eds, ISRO: Bangalore, p 411-430.
Doney, S.C. and M. Hood, 2002. A Global Ocean Carbon Observation System, A Background Report, Global Ocean Observing System Report No. 118, UNESCO Intergovernmental Oceanographic Commission IOC/INF-1173, 55p.
Friedlingstein et al, 2004 Friedlingstein, P., P. Cox, R. Betts, L. Bopp, W. von Bloh, V. Brovkin, P. Cadule, S. Doney, M. Eby, I. Fung, B. Govindasamy, J. John, C. Jones, F. Joos, T. Kato, M. Kawamiya, W. Knorr, K. Lindsay, H. D. Matthews, T. Raddatz, P. Rayner, C. Reick, E. Roeckner, K.-G. Schnitzler, R. Schnur, K. Strassmann, A. J.Weaver, C. Yoshikawa, and N. Zeng, 2006. Climate -carbon cycle feedback analysis, results from the C4MIP model intercomparison, J. Climate, 19, pp. 3337-3353.
IPCC (1995) – Greenhouse Gas Inventory Reporting Instructions – IPCC Guidelines for National Greenhouse Gas Inventories, Vol 1, 2 , 3, IPCC, IEA, OECD, 1995.
Jagdish Kishwan, Rajiv Pandey and V. K. Dadhwal, 2011.Emission Removal Capability of India’s Forest and Tree Cover. Small-Scale Forestry, DOI: 10.1007/s11842-011-9168-9. Kaul M, Dadhwal V.K and Mohren GMJ, 2009. Land Use Change and net C flux in Indian forests. Forest Ecology Management, 258, pp. 100-108.
Ke Zhang, John S. Kimball, Ramakrishna R. Nemani, and Steven W. Running, 2010.A continuous satellite derived global record of land surface evapotranspiration from 1983 to 2006. Water Resources Research, 6 (W09522), doi:10.1029/2009WR008800. Krishan G, Srivastav SK, Kumar S, Saha SK and Dadhwal VK (2009) Quantifying the underestimation of soil organic carbon by the Walkley and Black technique – examples from Himalayan and Central Indian soils. Current Science, 96(8): 1133-1136
Lal, R., 1999. Global carbon pools and fluxes and the impact of agricultural intensification and judicious land use. Prevention of land degradation, enhancement of carbon sequestration and conservation of biodiversity through land use change and sustainable land management with a focus on Latin America and the Caribbean. World Soil Resources Report 86, FAO, Rome, Italy, pp: 45-52.
M.R. Pandya, R. P. Singh and V.K. Dadhwal, 2004. A signal of increased vegetation activity of India from 1981 to 2001 observed using satellite-derived fraction of absorbed photosynthetically active radiation. Current Science, 87 (8), pp. 1122-1126.
Gianelle, Nadine Gobron, Jens Heinke, John Kimball, Beverly E. Law, Leonardo Montagnani, Qiaozhen Mu, Brigitte Mueller, Keith Oleson, Dario Papale, Andrew D. Richardson, Olivier Roupsard, Steve Running, Enrico Tomelleri, Nicolas Viovy, Ulrich Weber, ChristopherWilliams, Eric Wood, So¨nke Zaehle and Ke Zhang, October 21 2010. Recent decline in the global land evapotranspiration trend due to limited moisture supply. Nat u r e, 4 6 7, pp. 951-954.
Nayak , R.K. , N.R. Patel, and V.K. Dadhwal, 2011. Inter-annual variability of Net Primary Productivity over India, International Journal of Climatology (in press).
Nayak, R. K. and V.K. Dadhwal, 2011. Variability of atmospheric CO2 over India and Surrounding Oceans and control by Surface Fluxes, The International Archives of the Photogrammetry, Remote Sensing and Spatial Information Sciences, Vol. 34, Part XXX.
Nayak, R.K. and V.K. Dadhwal, 2011. Inter-annual variability of net ecosystem productivity over India. The International Archives of the Photogrammetry, Remote Sensing and Spatial Information Sciences, Vol. 34, Part XXX.
Nayak, R.K., N. R. Patel and V. K. Dadhwal 2009. Estimation and analysis of terrestrial net primary productivity over India by remote-sensing-driven terrestrial biosphere model, Journal of Environment Monitoring and Assessment- 10.1007/s10661-009-1226-9.
Nethaji Mariappan, 2010. Net Primary Productivity Estimation of Eastern Ghats using Multispectral MODIS Data. International Journal Of Geomatics And Geosciences, 1( 3), pp. 406-413.
NRSA 2006. Perspectives of Geoinformatics in Forest Fire Management.
Pandey U, Kushwaha S.P.S, Kachhwaha T.S, Kunwar P and Dadhwal V.K, 2010. Potential of Envisat ASAR data for woody biomass assessment. Tropical Ecology, 51(1), pp. 117-124. Patel N.R, Dadhwal V.K Saha S.K, Garg A and Sharma N, 2010. Evaluating the potential of MODIS data to infer water stress scalar for estimating cropland NPP. Tropical Ecology, 51(1): 93-105.
Patel, N.R., Dadhwal V.K and Saha S.K. (2011) Measurement and scaling of carbondioxide (CO2) exchanges in wheat using flux-tower and remote sensing. J. Indian Society of Remote Sensing 34 ; DOI 10.1007/s12524-011-0107-1.
Patil P., Singh S. and Dadhwal V.K, 2011. Above ground forest phytomass assessment in Southern Gujarat. J. Indian Society of Remote Sensing. DOI: 10.1007/s12524-011-0121-3.
Potter, C.S., Klooster, S.A., Myneni, R.B., Genovese, V., Tan, P. N. and Kumar V., 2003. Continental scale comparisons of
terrestrial carbon sinks estimated from satellite data and ecosystem modeling 1982–1998. Global Planetary Change, 39, pp. 201– 213.
Project Manual Spatial Assessment of Soil C Pool of India, January 2009, ISRO-GBP/NCP-SCP/PM/01.
Rajiv K. Chaturvedi, Ranjith Gopalakrishnan, Mathangi Jayaraman, Govindasamy Bala, N. V. Joshi, Raman Sukumar and N. H. Ravindranath, 2011. Impact of climate change on Indian forests: a dynamic vegetation modeling approach. Mitigation and Adaptation Strategies for Global Change , 16 (2), pp. 119-142. Ranjith Gopalakrishnan, Mathangi Jayaraman, Govindasamy Bala and N. H. Ravindranath, August 10 2011. Climate change and Indian forests. Current Science, 101 (3), pp. 348-355.
Sharma, N., R. K. Nayak, V. K. Dadhwal, Y. Kant, and M. M. Ali, 2011. Diurnal and seasonal variability of measured atmospheric CO2 over Dehradun during 2009. The International
Archives of the Photogrammetry, Remote Sensing and Spatial Information Sciences, Vol. 34, Part XXX.
Subodh K. Sharma, Asim Choudhury, Pinaki Sarkar, Subhashis Biswas, Anil Singh, Pradeep K. Dadhich, Ajay K. Singh, Suman Majumdar, Arti Bhatia, Madhu Mohini, Rajesh Kumar, C. S. Jha, M. S. R. Murthy, N. H. Ravindranath, Jayant K. Bhattacharya, M. Karthik, Sumana Bhattacharya and Rita Chauhan, 2011. Greenhouse gas inventory estimates for India. Current Science, 101 ( 3), pp. 405-415.
Sundareshwar P.V, Murtugudde R, Srinivasan G, Singh S, Ramesh K.J, Ramesh R, Verma S.B, Agarwal D, Baldocchi D, Baru C.K, Baruah K.K, Chowdhury G.R, Dadhwal V.K, Dutt C.B.S, Fuentes J, Gupta P.K, Hargrove W.W, Howard M, Jha C.S, Lal S, Michener W.K, Mitra A.P, Morris J.T, Myneni R.R, Naja M, Nemani R, Purvaja R, Raha S, Santhana Vanan S.K, Sharma M, Subramaniam A, Sukumar R, Twilley R.R and Zimmerman P.R, 2007. Environmental Monitoring Network for India. Science 316 (5822), pp. 204 – 205, DOI: 10.1126/science.1137417.
Velmurugan A., Krishan G, Dadhwal VK, Kumar S, Swarnam TP and Saha SK (2009) Harmonization of soil organic carbon estimation in historical and current data. Current Science, 97(4): 554-557.
Wani N, Velmurugan A, Dadhwal V.K, 2010. Assessment of agricultural crop and soil carbon pool in Madhya Pradesh.
Tropical Ecology, 51(1), pp. 11-19.
ACKNOWLEDGEMENTS