INTEGRATION OF 3D MODELS AND DIAGNOSTIC ANALYSES THROUGH A
CONSERVATION-ORIENTED INFORMATION SYSTEM
A. Mandelli a, *, C. Achille a, C. Tommasi a, F. Fassi a
a Architecture, Built environment and Construction engineering (A.B.C.) Department, Politecnico di Milano, Milano, Italy - (alessandro.mandelli, cristiana.achille, cinzia.tommasi, francesco.fassi)@polimi.it
Commission II, WG II/8
KEY WORDS: Photogrammetry; Structured-Light Scanning; Diagnostic Analyses; BIM; Conservation; Virtual Documentation; Cultural Heritage
ABSTRACT:
In the recent years, mature technologies for producing high quality virtual 3D replicas of Cultural Heritage (CH) artefacts has grown thanks to the progress of Information Technologies (IT) tools. These methods are an efficient way to present digital models that can be used with several scopes: heritage managing, support to conservation, virtual restoration, reconstruction and colouring, art cataloguing and visual communication. The work presented is an emblematic case of study oriented to the preventive conservation through monitoring activities, using different acquisition methods and instruments. It was developed inside a project founded by Lombardy Region, Italy, called “Smart Culture”, which was aimed to realise a platform that gave the users the possibility to easily access to the CH artefacts, using as an example a very famous statue. The final product is a 3D reality-based model that contains a lot of information inside it, and that can be consulted through a common web browser. In the end, it was possible to define the general strategies oriented to the maintenance and the valorisation of CH artefacts, which, in this specific case, must consider the integration of different techniques and competencies, to obtain a complete, accurate and continuative monitoring of the statue.
* Corresponding author
1. INTRODUCTION
The growing interest in CH made this field not only a domain for technical operators and specialists, but also an economic resource for dissemination and valorisation purposes. However, the introduction of new technologies is not so easy because of the resistance in replacing old approaches with new ones based on innovative hardware and software.
Nevertheless, in the last years, new acquisition methods and instruments are becoming a powerful way to present and analyse artworks in virtual environments, in real places, like in museums, or on the web The role of these techniques is fundamental because, on one side helps technicians in managing and analysing scientific data, and on the other, allows the public to understand the characteristics of CH through interactive applications, presentations and very realistic virtual environments.
The targets of this research work were essentially two: 1. test two different survey techniques, image and range
based, to compare methods and results building a reality-based model at 1:1 resolution scale;
2. create an information web system able to present and visualise the large, high-resolution reality-based model, to share the work between the different operators, and to keep the model always updated with the new information.
2. STATE OF ART 2.1 International experiences
Speaking about the knowledge pipeline of a CH artefact, the global trend is to develop dynamic and suitable informative tools able to handle all information about the restoring and
management processes. The 3D model can be used as geometric physical support to link several types of data with the goal to share information and keep the archives always updated. It is possible to find many examples of platforms to visualise the 3D reconstruction of the CH artefacts: usually, they contain the model and some information about the history, the location, the dimension, etc. and other multimedia files as photos, videos, documents, etc. A famous example is Sketchfab (Sketchfab, 2017), a platform that lets to share online the 3D models easily and to create a virtual gallery, used by many museums like the British Museum to valorise and spread the knowledge and the culture.
Another case is 3DHOP (3D Heritage Online Presenter), an open-source software package for the creation of interactive web presentations of high-resolution 3D models, oriented to the CH field. It allows the creation of interactive visualisation of 3D models directly inside a standard web page, just by adding some HTML and JavaScript components in the HTML code (Cyark, 2017). 3D-ICONS (3D ICONS Ireland, 2017) is a European consortium that aims to an exploitation of digital content across the Europe, through the creation of highly accurate 3D models and a range of other materials (images, text and videos) of iconic and internationally famous monuments and buildings to provide access to this data online.
These web platforms represent useful instruments for the online visualisation of 3D models, as they share an intuitive interface that permits to consult the information inserted into the object. On the other hand, they all have standard categories of information, which are the same for every artefact uploaded online. This means that there is a lack of flexibility of these instruments, which cannot be customised to the needs and the unicity of every single piece of art. In this case of study, for example, the project required to add the chemical and physical The International Archives of the Photogrammetry, Remote Sensing and Spatial Information Sciences, Volume XLII-2/W5, 2017
analyses and to relate also the information about the specific equipment used. All these experiences want only to testify the increasing interest in the theme of valorisation through the web, and for this reason, many national programs born with this specific aim. In particular, the one where the research project was developed is called “Smart Culture”.
2.2 “Smart Culture” project
The “Smart Culture” project was financed by Lombardy Region, Italy, within the framework of the “FES-POR Competitività 2007-2013”. Its targets were:
1. to study and establish a platform that gave the users the possibility to easily access to CH;
2. to define and create innovative multi-digitalization methods that permit viewing online digital models related to pieces of arts and query them obtaining information and insights (De Masi et al., 2015); 3. to support the work of the scientists with the
implementation of an advanced diagnostic system aimed at the protection and safeguarding of CH. Thanks to the collaboration between the ABC (Architecture, Built environment and Construction engineering), CMIC (Chemistry, Materials, Chemical Engineering) and FIS (Physics) departments of Politecnico di Milano, it was possible to carry forward a study focused on the procedures for the registration, alignment and integration of several data, surveyed with different methodologies and instruments.
3. PRELIMINARY CONSIDERATIONS
One interesting topic emerged during this project is the realisation of a high detailed model, at 1:1 scale, using as much as possible, low-cost instruments. Indeed, in the last year, there has been an increasing demanding of 3D optical sensors for fast acquisition of complex free-form shapes; the advantages respect to the contact probes are the non-invasiveness, higher speed of measurement and, in some cases, lower costs. Moreover, the availability of powerful software tools for 3D raw data editing and the modelling of the shapes opened the door to a considerable number of applications (Remondino, 2011). Before the beginning of the “Smart Culture” project, some tests were made to define the best procedure to obtain a 1:1 3D model. The test phase was developed using a marble head with some characteristics (shape and material) similar to the object to be surveyed for the “Smart Culture” project. It was measured using photogrammetry and a structured light scanner from the same manufacturer of the one used for the project. The 3D model coming from scanner was assumed as the reference for the tests because the manufacturer certifies its precision as following: 20÷40 micron per each scan, ±0,06 mm theoretical deviation.
It was also decided to assumed the “plotting error” as the primary parameter to discriminate if a model can be considered represented at 1:1 scale. This value derives from the cartography field and is related to the precision of a map, and conventionally is assumed to be equal to 0,2 mm: consequently, sampling a measure from a model, can lead to errors of ± 0,2 mm concerning its representation scale.
There is also a connection between this value and the human eye resolution. In fact, the ophthalmology literature affirms that in optimal light conditions (Liang et al., 1997), at a focus distance of 20-30 cm, a human eye can distinguish ten lines per millimetres, a value that is very close to the 0,2 mm chosen as reference resolution for the 1:1 scale model.
Nevertheless, a 3D model has not only two dimensions, but the
limit value of 0,2 mm has to be investigated in the 3D space domain. For this reason, in the following tests, the resolution of the model was evaluated measuring the mean distance elapsing between two adjacent points, the precision of Z component of each point was compared with the reference scanner model through mesh deviation processes thanks to comparison software.
If both values are under the limit of 0,2 mm, the digital model can be considered recorded at 1:1 scale. Some variables must be considered during the design of the survey project, to achieve the goal.
3.1 Tests and survey rules
The test conducted during the photogrammetric acquisition phase were aimed to the definition of some good practices to achieve a model suitable for 1:1 restitution scale. The variables considered were: i) distance of acquisition, ii) base distance between acquisitions, iii) use of targets, iv) presence of metric references, v) influence of the light conditions, vi) minimum number of photos required to obtain a complete 3D model, vii) sampling of original data. Some other variables, instead, are linked to the instruments employed, namely the sensor size, the focal length and resolution of the images.
Since it is not possible to define apriori the acquisition
The scene was disseminated of targets before the survey. These were useful to adjust the internal camera’s parameters minimising the sum of re-projection errors, operation called optimization in many image based photogrammetric software. Moreover, the overlap between images must be near to 80%. The results obtained from the tests reached the 1:1 representation scale only if the following statements are respected (Campos et al., 2015) (Champion et al., 2015):
1. it is not possible to approach a photogrammetric survey aimed to obtain 1:1 model avoiding the use of measured points (targets);
2. all round objects need an accurate design of acquisition geometry regarding their overhangs; 3. acquire images at the maximum resolution, if
necessary due to time reasons, it is possible to down-sample data during elaboration;
4. good images were obtained using tripods, remote shutters, manual focusing and low ISO. These expedients help to reach the designed precision and correct metric results.
Avoiding some of these steps can lead to wrong outcomes. The images themselves (blurred or noisy) and the process can cause a down-sampling of the final products.
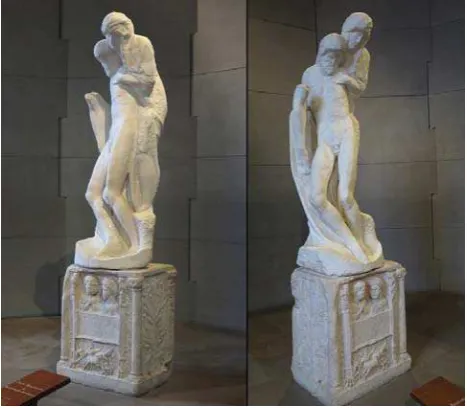
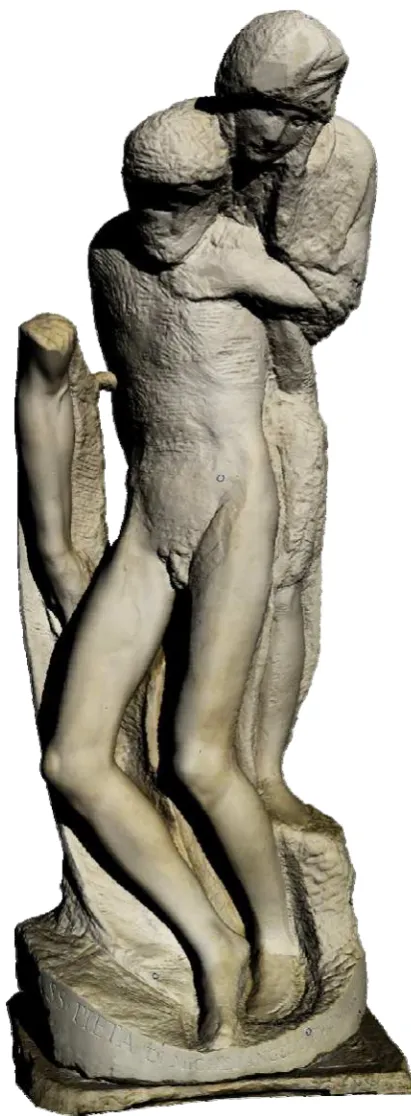
4. CASE STUDY: PIETÀ RONDANINI STATUE The representative object chosen for the “Smart Culture” project was the Pietà Rondanini statue, a marble sculpture made by Michelangelo Buonarroti between the 1550s at the end of his life, in 1564. The theme represented is a revised version of his first Pietà (1499), where Virgin Mary is mourning over the body of the dead Christ.
The developed methods have been experimented with Pietà Rondanini by Michelangelo, on the occasion of its transfer from the Sala degli Scarioni of the museum of Castello Sforzesco to the Ex Ospedale degli Spagnoli area, in the same architectural The International Archives of the Photogrammetry, Remote Sensing and Spatial Information Sciences, Volume XLII-2/W5, 2017
complex. The geometrical survey of the statue and the chemical analyses were necessary to evaluate the physical effects due to its future change of location.
Figure 1: Pietà Rondanini statue.
The studies were conducted before the transfer by the research team of Physics and Chemistry Department; they will be repeated once the statue has reached its new place. Scientific summaries will be repeated in the new location and will build the starting point for a multi-year monitoring program.
The phases necessary to fulfil all the “Smart Culture” requests were:
1. the creation of a high definition model in 1:1 scale; 2. the integration of the data; the import of the 3D model
in a web-platform;
3. the addition of the analysis and the data.
The survey was conducted using different methodologies and sensors: it was used both a structured-light scanner and the photogrammetric approach. The purpose of this phase was double: the realisation of accurate 3D model able to represent the statue at 1:1 scale geometrically and radiometrically and comparing the two methodologies in relation of costs, time, achieved accuracy and reliability of the techniques.
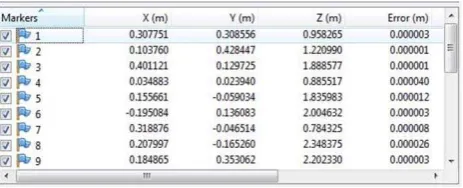
Before starting both the surveys, in very exceptional case, common targets 10 round, non-coded white on black targets with the diameter of 1 cm were placed on the statue, to raw georeference the two model together and to enable the accurate comparison of the results.
5. MULTI-DIGITALIZATION APPROACH 5.1 Scanner survey
The employed tool was Chronos 3D, a structured light scanner composed of a high-resolution projector and two industrial black and white cameras with the resolution of 3,1 Mpixel. The mean distance of acquisition was in a range of 80 cm and 1 m with a footprint of 500 mm X 400 mm. The resolution obtained in this configuration was 0,2 mm. The certified precision of this instrument goes from 20 microns to 40 microns for each scan. The acquiring stage was quite long; it took all day to record 270 high-resolution scans, optimising the position of the scanner to reach all grey areas of the statue.
The final model obtained at the end of the elaboration was a
coloured mesh of 21 million triangles; the colour of each point was obtained interpolating the three RGB components that the projector rapidly flashed on the object before the scan phase.
Figure 3. Scanner survey using Chronos 3D
This colouring method is strongly influenced by the light conditions of the environment, causing misrepresented colours on the model. During the meshing stage, triangles assumed the resulting colour from the interpolation of these three vertices.
Figure 4. Final coloured mesh composed of 21 million triangles, with a certified resolution of 0,2 mm.
5.2 Photogrammetric survey
5.2.1 The survey: The photogrammetric survey was conducted using a Canon 5D Mark III Camera (full frame) with a Canon 35mm F1.2 lens. The camera was setup in aperture priority with fixed focal distance, using an aperture of f/11 and ISO200. Circa 360 photos were acquired using 6 different survey rings around the statue at different heights assuring an overlap of circa 80% among the closed acquisition rings. A tripod and a movable scaffold was used to reach the maximum height of the statue (195 cm) placed on a basement of ca. 120 cm. Since the survey was not repeatable, in the more complex parts of the statue, the legs, the angular step between images was reduced to 5°, instead of the 10°. This assured a high redundancy of photos, allowing the possibility to eliminate eventual bad quality images and covering all the undercuts portions of the statue. The capture distance was between 80-100 cm from the statue, guaranteeing a theoretical mean GSD (Ground Sampling Distance) equal to 0,15 mm.
A calibrated bar was used to scale the photogrammetric model. External lights are used to have an uniform steady light on the statue and to reduce or to eliminate shadows in the hidden parts. To control the capture operation and the image quality a remote streaming video system and a remote shutter were used. The images were taken in RAW format. The post-processing permitted to increase the visible details and to have high quality images to re-project as 1:1 resolution texture on the model. The International Archives of the Photogrammetry, Remote Sensing and Spatial Information Sciences, Volume XLII-2/W5, 2017
Figure 5. On the left: the photogrammetric survey from the ground and from above with a scaffold. On the right: the
geometry of acquisition.
5.2.2 The elaboration: The photogrammetric elaboration was done with Agisoft Photoscan. To better understand the behaviour of image-based modelling software, the data were elaborated in two different ways:
1. using the GCP only to georeference the photogrammetric model;
2. using the GCP to optimise the image orientation process.
The GCP coordinates was extrapolated by the scanner model interpolating geometrically the centre of each marker.
This was done in order to check the feasibility of the 1:1 image-based modelling without the use of external references that often could not be used when it comes to dealing with CH objects.
The elaboration was conducted in the classical way in three different phases: the orientation phase, the dense matching and the mesh creation. After each step an accuracy evaluation and a comparison is computed.
5.3 The model comparison
The correctness of the final model was evaluated taking into account three parameters: the local punctual deviation on the GCPs, the points density and the RMS (Root Mean Square) of the point-mesh deviation computed between the scanner and the photogrammetric models.
5.3.1 Comparisons: scanner vs. photogrammetric – high – non-optimised: In the first case the data were elaborated without the optimising stage. Immediately, observing the result, obtained imposing the position of markers, it was clear that the accuracy was out of the range of 0,2 mm imposed for 1:1 representation scale.
Figure 6. Re-projection errors on targets of the non-optimised model in Agisoft Photoscan.
The errors in the position of markers are between 0,2 and 0,5 mm, meaning that the precision in Z was not respected all over the statue since they were equally distributed on the surveyed object. Since this error is comparable and locally bigger than
the image resolution it means that something was not correct in the photogrammetric process.
For this reason, to better understand what was wrong, a comparison between the dense point cloud and the reference mesh model was important.
The dense matching was done in Agisoft using the option “high” that means sampling the images by ¼; it was obtained a model with 44 million points and a spatial resolution of 0,14 mm. The comparison was done inside Geomagic Design X. The value of the RMS was considerably high, equal to 0,75 mm, the red area on Mary’s back demonstrated a vertical shift of the photogrammetric model respect to the scanner one. The shape of the left tail of Gaussian graphic confirmed this behaviour: a certain number of values went out from the bell while it goes to zero. This was due to a wrong registration of the models probably caused by a misalignment of the images in the upper part of the statue, where it was harder to respect the designed acquisition geometry. The maximum value observed in this area was around 3 mm.
Figure 7. On the left: the red area highlights a shift between models on the back of the statue. On the right: this behaviour is
shown from the left tail of the Gaussian distribution.
5.3.2 Comparisons: scanner vs. photogrammetric - high – optimised: In the second case, it was performed the optimisation stage, fixing the coordinates of the markers as constrain and correcting, in this way, the values of the distortions. It was instantly noticed a great improvement in the re-projection errors of the markers, they decreased by one order of magnitude, passing from a mean of 0,3 mm to an average of 0,01 mm.
The dense point model obtained from the process had the same characteristics of resolution and number of points of the previous one: the mean distance between points was 0,083 mm, a value suitable for the 1:1 rendering scale.
Figure 8. Re-projection errors on targets of the optimised model in Agisoft Photoscan.
After the comparison with the reference model, the RMS error was above the limit of 0,2 mm being equal to 0,35 mm. In particular, not acceptable values were observed in that parts which were not easily reachable during the photographic The International Archives of the Photogrammetry, Remote Sensing and Spatial Information Sciences, Volume XLII-2/W5, 2017
survey: the legs. Despite the extra photographic capture at higher resolution (closer to the object) for these undercuts regions, the model results noisy and with many artefacts due to narrow shadow areas that have too different illumination among the stereo pairs.
Figure 9. On the left: comparison between the scanner and the optimised photogrammetric model. On the right: the Gaussian
distribution associated with the comparison.
Photogrammetrically it was not possible at this stage to get better result, so the mesh was created. The mesh was developed to match the same characteristics of the scanner one, regarding the number and the edge length of triangles. The elaboration of the model was performed with the same software used for the comparisons (Geomagic Design X). First of all, the starting point cloud of 44 million points was filtrated using reduce noise and smoothing algorithms; acting this, all the outliers were avoided from the mesh computation. The point cloud was also resampled obtaining a constant grid of 0,2 mm. This operation permitted to regularise the point cloud before the meshing stage, which considered a series of steps to obtain a light-weight and accurate model. The parameters were setup to create a geometry as much as possible tight to the original data. The defects were fixed removing typical mesh errors such as small clusters, small tunnels, non-manifold, folded and dangling faces.
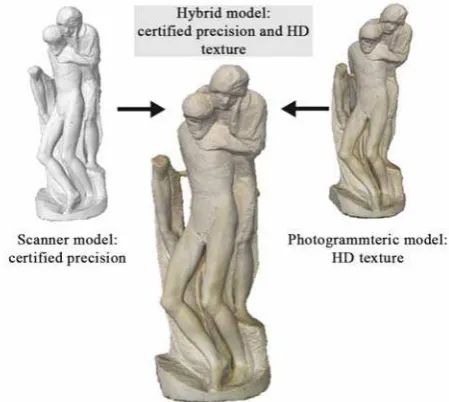
5.4 The hybrid model
Since the aim of the project was to obtain a very precise model of the statue, to georeference all the information and the technical data, it was decided to realise a hybrid model that considers the potentialities of both methods.
It was decided to keep as reference the scanner mesh and use the images to create a high resolution texture. The mesh model is composed by 21 million triangles with a precision certified of 0,2 mm. It is composed by regular, homogeneous and equilateral triangles, which leads to a small dimension regarding MB and a fast visualisation. The photogrammetric model, even if has the same precision and accuracy of the scanner one, presents some absence of data in the dark areas between the legs of the statue.
On the other hand, the limit of the scanner model is the lack of colour information, so it was imported in the photogrammetric software and textured. This operation is supported by the correct alignment between models, achieved with the registration of the targets.
In order to take advantage of the photogrammetric colour details and to obtain a greater texture resolution, a multi-texture model, composed with several atlases, was developed. The texture atlas size and the resulting number of images, was determined taking into account the maximum size of 4096x4096 pixels, supported by the BIM3DSG system, presented below. Moreover, in function of mesh area, the
number of texture atlas with a pixel size standard format (1024/2048/4096) can be calculated to achieve the texture resolution required. In this case fixing a pixel size value of 0,2 mm, which guarantee a 1:1 scale, the mesh model needed 7 atlases with 4096x4096 pixels (81,92x81,92 cm) or 28 atlases with 2048x2048.
Figure 12. The final hybrid model in the 1:1 rendering scale.
Figure 13. Details of the 1:1 high-resolution texture directly onto the model.
In this way, imported this model in the BIM3DSG system, it can be possible to take measurements or map areas on a texture with a high resolution of 1:1 scale, conformed to the mesh model level of detail.
6. ON-LINE INFORMATION SYSTEM
Once a satisfactory model was created, it was ready to be enriched with all the diagnostic information provided and to be imported in a platform able to show and manage it in a user-friendly system (Tonoilo et al., 2015).
There were studied methods for referencing the results of scientific measures on the digital 3D model. This system allows to make the data and analyses available to all conservation professionals in a shared system, where every expert can add and georeference on the subject his investigations.
The system should be able to:
1. visualise very high-resolution 3D models and textures;
2. provide a robust database of information, able to store a large quantity of data;
3. provide metadata and paradata information; the term “metadata” refers to the information of the physical object (such as surface, volume, dimensions, material, etc.). “Paradata” are instead the features that describe its model (tools used to extract the metadata, date of survey, operator, modelling info, etc.);
4. involve users in the active fruition of artefacts through a clear interface.
To satisfy all these features, it was used the BIM3DSG, a system design and created by the 3D Survey Group, in Politecnico di Milano for CH applications. It is an integrated system capable of handling the unicity, the complexity and the needs of the objects belonging to this field and described by three-dimensional and reality based models (Rechichi et al., 2106) (Fassi et al., 2012).
6.1 BIM3DSG and Pietà Rondanini
The aim of BIM3DSG is the same of “Smart Culture” project: to spread and to share the information to help the maintenance and conservation of the CH. It is all possible using a simple platform, intuitive and accessible to everyone: a conventional web browser that does not require any learning effort or new software installation. Besides, thanks to the mobile interface, it can be visualised in any device at any time with an internet connection.
The main features of BIM3DSG are:
1. visualisation of 3D models with high complexity and great accuracy;
2. advanced management of CH needs (conservation, restoration and valorisation purposes);
3. customization of the information; 4. web platform;
5. interoperability; 6. easy use.
Figure 12. General features of BIM3DSG.
In the specific case of Pietà Rondanini, an ad hoc system was created for displaying three-dimensional and textured models, diagnostic and monitoring data. Despite the large size of the complex 3D photogrammetric, scanner and hybrid models, it was decided to load into the system all of them at the maximum resolution. This was possible thanks to de redesigned robust caching mechanism that takes advantages of the persistent cache, ensuring the user-friendliness and the appeal of the
system, allowing almost instantaneous loading time, even on a low-speed network connection.
The via web consultation is now open only with user id and password (http://pietarondanini.bim3dsurvey.it), and all the operators that own the credentials, can consult and integrate the information contained.
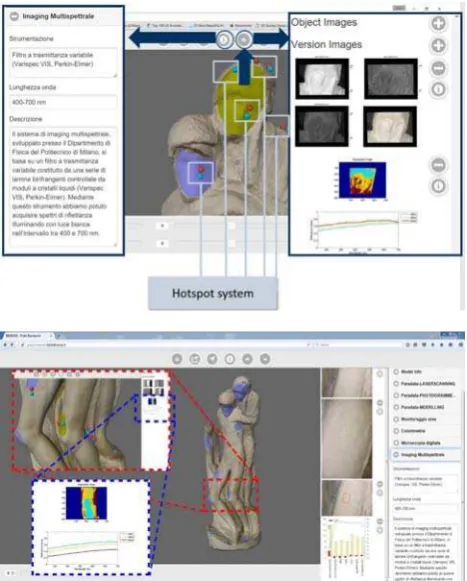
All data, both texts, images and graphs, coming from physical analysis, performed by the team of Physics Department of Politecnico di Milano, were georeferenced on the model using spherical and areal hotspots.
A unique conservation protocol in the field of conservation is not compatible with the heterogeneity of art works, but some “good practices” prefer the use of non-invasive methods that can be applied in-situ.
In particular, it is important to combine multiscale digitalization techniques that consist of three phases. The first is the digital reconstruction of the work in a three-dimensional model. The second is the acquisition of the characteristics of the surfaces with imaging techniques (RGB photography, multispectral imaging, fluorescence imaging, and more), depending on the type of artwork. Finally, the third is an in-depth analysis with quantitative instruments (e.g. colorimeter) and, where possible, with analytical tools such as XRF spectroscopes, Raman, and others.
Figure 13. The analyses can be visualised on the 3D model with a hot spot system which reminds to images, graphics, tables and
textual information.
The hotspots inserted in the on line information system contain data about analysis made on specific parts of the statue concerning: i) microscopy, some significant areas (identified by art conservators) were acquired by macro-photographs (2 mm-500 micron); ii) colorimetric analysis, with general and detailed images of the selected areas; iii) general photographic documentation (UV light) of all sculpture and chosen areas, such as the faces; iv) multispectral imaging through the acquisition of colorimetric coordinates in CIELab color space; The International Archives of the Photogrammetry, Remote Sensing and Spatial Information Sciences, Volume XLII-2/W5, 2017
v) Raman Spectroscopy (sampling on a white marble spot, Raman spectrum shows the principal peaks of calcite; the Raman spectrum on a brownish spot displays the main peaks of calcite and the main peaks of calcium oxalate).
In particular, microscopy, colorimetry, UV images, and Raman analysis since are punctual information of specific parts of the statue are rapresented by spheres. Instead, multispectral analyses are visualised through areas because they insist on bigger parts of the statue. For this last parts, it is possible to map the analyses directly onto the original texture and use it as an additional “layer”. With this solution it is sufficient to zoom in, reaching the 1:1 scale also for the texture.
Further analysis of the same parts, could be implemented over the years: this constitutes an archive of the modifications occurred on the statue during time and space. Since the studies were referred to the models and not to the objects themselves, they can be updated and chronologically organised even if the objects change.
Therefore, the system responds entirely to the need of the project: the platform permits to examine on-line digital models and query them obtaining information and insights, helping the maintenance of the CH artefacts.
The proposed system is easy to use and flexible enough to adapt to the specific needs that may arise during the time and to different operators.
7. CONCLUSION
Here are presented some survey examples with the aim to produce 1:1 models and to use them for studying and georeferencing of detailed physical and chemical analyses. The case study considered the use of fully automated image-based methods checking at the end the quality of the gained results comparing them with reference models obtained from structured light scanner survey. The aim was to check the actual possibility of using this cheap technology for the challenging task to reproduce high accuracy and resolution models. It was demonstrated that approaching the survey of small artefacts with the intent to gain 1:1 scale is possible but cannot neglects the use of reference targets in the scene, in fact, their use permits to constrain the orientation phase. The employing of more calibrated bars is necessary to scale correctly in the absence of a reference scan.
All the comparisons to judge the correctness of models were performed using a structured light scanner. This method is surely advisable in the survey of small artefacts, but the lack of a good texture at the end of the workflow and the difficulty to be aware of some possible errors can lead to rough mistakes without knowing it. On the other hand, the steps of photogrammetric pipeline allow the surveyor to control the whole process in each phase. In the absence of portable scanners, it is demonstrated that a photogrammetric survey correctly designed, can give similar results. Moreover, in some cases, the use of cameras is advisable due to their portability and flexibility of use (possibility to change lenses in function of the objects to be surveyed).
Once the level of detail of the 1:1 scale is reached, the model converged in a web platform, which helps the interoperability between the different operators who contribute to analysing various parts of the statue. The aim of the project required to put different data coming from many fields of study in a single outcome: the 1:1 statue model is the container of much multidisciplinary information. The choice to storage all the information (models, images and texts) on the net has some positive outcomes:
1. different operators can participate to the updating of information;
2. the items saved in the net are always the latest, preventing the creation of various versions of the same object;
3. if the models are stored on local machines, it is necessary to install software for visualisation. A web interface is usually user-friendly also for non-expert people.
Figure 14. The final hybrid 3D model with 1:1 high-resolution texture re-projected.
In conclusion, this project made possible to identify the strategies oriented to the maintenance and the valorisation of a monument, which are:
1. the recording phase must consider the integration of different sensors in relation to the objects, the materials and the surrounding conditions;
2. the conservation requires high detailed 3D models, achievable with an accurate design of the acquisitions, to manage information and different analyses;
3. once a reality-based is obtained, it cannot be mute, but it has to contain all the necessary information and diagnostic data inside it, to help the maintenance and the conservation of the monument;
4. consultation via the web certainly contributes to spread the information and simplify the access to a complex of data which generally cannot be easily consulted by the scientific and public community (Achille et al., 2016);
5. the integration and the cooperation of different competencies from many scientific fields are the best way to manage, conserve and valorise the CH.
ACKNOWLEDGMENTS
The Authors wish to thank: the Project “Smart Culture” financed by Regione Lombardia, Italy, within the framework of the FESR-POR Competitività 2007-13; the colleagues of the CMIC and FIS Department of Politecnico di Milano, in particular, proff. Lucia Toniolo and Gianluca Valentini; great thank-you to Open Technologies Eng. Matteo Carocci.
REFERENCES Agisoft, 2017. www.agisoft.com 3D ICONS Ireland, 2017. www.3dicons.ie
Abate, D., Avgousti, A., Faka, M., Hermon, S., Bakirtzis, N., Christofi, P., 2017. An online 3d database system for endangered architectural and archaeological heritage in the South-Eastern Mediterranean. In: The Int. Arch. Photogramm.
Remote Sens. Spatial Inf. Sci., Nafplio, Greece, Vol.
XLII-2/W3, pp. 1-8, doi:10.5194/isprs-archives-XLII-2-W3-1-2017. Achille, C.; Toniolo, L., Valentini, G., Capogrosso, V., Fassi, F., Goidanich, S., Gulotta, D., Mandelli, A., Mosca, S., Nevin, A. B., 2016. Innovative diagnostic models of artefacts: the study of Michelangelo’s Pietà Rondanini. In: InArt 2nd
Conference on Innovation in Art Research and Technology,
Ghent, Belgium, pp. 134-135.
Adami A., Balletti C., Fassi F., Fregonese L., Guerra F., Taffurelli L., Vernier P., 2015. The bust of Francesco II Gonzaga: from digital documentation to 3d printing. In: ISPRS
Annals of the Photogramm. Remote Sens. Spatial Inf. Sci.,
Taipei, Taiwan, Vol. 2 (5), pp. 9-15.
Apollonio, F. I., Gaiani, M., Basilissi, W., and Rivaroli, L., 2017. Photogrammetry driven tools to support the restoration of open-air bronze surfaces of sculptures: an integrated solution starting from the experience of the Neptune Fountain in Bologna. In: Int. Arch. Photogramm. Remote Sens. Spatial Inf. Sci., Nafplio, Greece, Vol. XLII-2/W3, pp. 47-54,
doi:10.5194/isprs-archives-XLII-2-W3-47-2017.
Campos, M.B., Tommaselli, A.M.G., Ivanova, I., Billen, R., 2015. Data product specification proposal for architectural heritage documentation with photogrammetric techniques: a case study in Brazil. Remote Sensing, 7, pp. 13337-13363,
doi:10.3390/rs71013337.
Champion, Z., Chiabrando, F., Harrington, J., 2015. 3D modelling of the Michigan Tech Husky statue using a close-range photogrammetric approach. In: ASPRS Annual
Conference, Tampa, FL, USA, pp. 243-254.
Cyark, 2017. www.cyark.org
De Masi, A., 2015. Documentation, scale and multi-dimensional representation of CH for the policies of redevelopment, development and regeneration. In: ISPRS Annals of the Photogramm. Remote Sens. Spatial Inf. Sci.,
Taipei, Taiwan, Vol. II-5/W3, doi:10.5194/isprsarchives-XL-5-W7-503-2015.
Fassi, F., Parri, S., 2012. Complex architecture in 3D: from survey to the web. International Journal of Heritage in the
Digital Era, 1, pp. 379-398, ISSN: 2047-4970.
Guidi, G., Micoli, L.L., Gonizzi, S., Brennan, M., Frischer, B., 2015. Image-based 3D capture of CH artefacts, an experimental study about 3D data quality. In: The Digital Heritage
International Congress, Granada, Spain, pp. 321-324.
Liang, J., Williams, D., 1997. Aberration and retinal image quality of the normal human eye. J. Opt. Soc. Am. A., 14 (11),
pp. 2873-2883, ISSN:0030-3941.
Nicolae, C., Nocerino, E., Menna, F., Remondino, F., 2015. Photogrammetry applied to problematic artefacts. In: The Int.
Arch. Photogramm. Remote Sens. Spatial Inf. Sci., Riva del
Garda, Italy, Vol. XL-5, pp. 451-456, doi:10.5194/isprsarchives-XL-5-451-2014.
Rechichi, F., Mandelli, A., Achille, C., Fassi, F., 2016. Sharing high-resolution models and information on the web: the web module of BIM3DSG system. In: The Int. Arch. Photogramm.
Remote Sens. Spatial Inf. Sci., Prague, CZ, Vol. XLI-B5, pp.
703-710, doi:10.5194/isprsarchives-XLI-B5-703-2016.
Remondino, F., 2011. 3D surveying and modelling of complex architectural sites and heritage objects. Disegnarecon, 4, pp.
90-98, ISSN 1828-5961.
Remondino, F., 2011. Heritage recording and 3D modelling with photogrammetry and 3D scanning. Remote Sensing, 3, pp.
1104-1138, doi:10.3390/rs3061104.
Sketchfab, 2017. www.sketchfab.com
Toniolo, L., Borani, M., Guidi, G., 2015. Built Heritage:
monitoring conservation management. Springer, ISSN:
2198-7300.