ANALYSIS
Interrelationships between economic policy and
agri-environmental indicators: an investigative framework
with examples from South Africa
Jamie Morrison *, Richard Pearce
Department of Agricultural Economics and Business Management,Wye College,Uni6ersity of London,Wye,Kent TN25 5AH,UK
Received 3 August 1999; received in revised form 2 December 1999; accepted 23 March 2000
Abstract
A number of methodological approaches to understanding and quantifying the potential impacts of changes in macroeconomic and sectoral policies on the natural resource environment have been developed in recent years. However each has its limitations, resulting in policy change still being implemented without due attention to environmental impacts. Two key drawbacks of those methodologies that do attempt to model these impacts are that they are generally static in their approach, thus may not alert the decision maker to the often quite different long-term implications, and that they attempt to generate rather specific sets of indicators, making them difficult to use and/or interpret outside case study applications. In this paper we expound a framework for addressing these limitations in the context of the agriculture sector. In developing countries in particular the dynamic dimension is critical given the twin pressures of population growth and rising incomes associated with economic growth. In light of the second drawback, it is the propensity of policy to impact upon the natural resource environment via its effect on the type of farming practice adopted that forms the focus of the paper. A methodology is first developed to facilitate the tracing of likely impacts of both price and non-price reforms, via both the incentives and constraints to increased food production. By separating out the impacts on environmental indicators associated with extensification and intensifica-tion of agriculture, it is possible to determine which of these indicators are most likely to be affected by policy changes, and to what degree in both the short and longer term. The framework is then applied to case study data from the South African agriculture sector to demonstrate how consideration of the risk of natural resource degradation earlier in the policy dialogue process could result in the implementation of more effective complementary measures. © 2000 Elsevier Science B.V. All rights reserved.
Keywords:Farming practices; Economic policy; Environmental indicators; South Africa
www.elsevier.com/locate/ecolecon
* Corresponding author. Tel.: +44-1233-812401; fax: +44-1233-813498.
E-mail addresses:[email protected] (J. Morrison), [email protected] (R. Pearce).
1. Introduction
Two central themes of the so-called Global Food Debate, (see, for example, Brown, 1994; McCalla, 1994; Islam, 1995) surrounding the issue of increased agricultural production in poor coun-tries are the influence of the technologies currently deployed and likely to be developed in the future, and the impacts on the natural resource environ-ment as it comes under increasing pressure from attempts to raise the productivity of the resources used in agricultural production. The relationship between the technological choices and the policy environment are well documented, but the link between policy change and the natural resource environment has received much less attention.
While the impacts of specific localised changes in the socio-economic context have received sub-stantial focus, for example, those stemming from the implementation of projects where the associa-tion between acassocia-tion and impact are both visible and measurable, the links between sectoral and macro-economic policy and the sustainability of the natural resource environment have received much less attention. In analysing the impact of any policy change, policy makers would ideally take into account these environmental costs and benefits as well as the economic outcomes in terms of increased efficiency. Often, however, it is difficult even to determine whether the impacts associated with such policy decisions will be posi-tive or negaposi-tive, let alone the magnitude of any effects.
The assessment of the impacts of policy deci-sions on the natural resource environment has been hindered by the absence of a methodology for tracing these impacts (Munasinghe and Cruz, 1994). Even where such relationships are recog-nised they are rarely incorporated at the policy design stage, as it is difficult to determine the magnitude of environmental effects until they be-come apparent. In the context of substantive eco-nomic policy reform, this implies that these effects are not taken into consideration until after the reform process has been implemented and the response is reactive rather than proactive. The latter point highlights the importance of both the environmental impact assessment and the analysis
of the economic costs and benefits of policy deci-sions being completed at the same point in the policy formulation process, a theme central to the Action Impact Matrix (AIM) methodology (Mu-nasinghe and Cruz, 1994).
One problem facing researchers is that their attempts to incorporate sustainability issues into policy analysis are likely to be static in nature because both technology and population growth rates are considered to be exogenous influences. However, models that attempt to treat these vari-ables endogenously are likely to be of little use to policy makers due to their being both highly complex and intractable, while more simplified models are likely to prove unreliable. This paper attempts to develop a framework that demon-strates that farmers’ supply response to changes in incentives resulting from, for example, changes in population density, is influenced by the existing state of technology and subject to the constraints on innovation imposed by government policy, and that this is likely to result in quite different site-specific outcomes.
may result in greater amount of marginal land being brought into production as relative input prices rise. The impacts on the natural resource environment under each scenario might be quite different.
In this paper we restrict our discussion to the effects on the natural resource environment which occur as a result of policy decisions that affect the agricultural sector. There has been substantive work carried out on the environmental impact of different farming practices, and on the develop-ment of technical indicators to describe the direc-tion and magnitude of these impacts, notable among these being the OECD (1997) driving
force-state-response framework. The OECD
framework proceeds by attempting to determine what causes environmental conditions in agricul-ture to change, what effect this is having on the state of the environment, and what actions are being taken to respond to the changing state of the environment. The framework, thereby aids the identification of indicators to explain and quantify these links (OECD, 1999).
However, there are still a number of limitations to the use of these approaches. Pearce (1999) concludes that although the OECD’s framework is valuable in terms of the development of indica-tors within a conceptual framework, there has been limited appreciation of the real driving forces such as missing markets and government policy. Pearce suggests that further research is needed to identify the non-market attributes of agriculture, namely, the external benefits and costs, and the relationship between government policy and the agriculture sector.
Similar reservations are held by Doyle (1999) who finds that too many of the recommended OECD indicators are concerned with measuring the state of the environment in terms of physical and biophysical phenomenon. As such the indica-tors are not able to indicate the propensity of policy change to impact upon the state of the environment. One might conjecture that the rea-son why biophysical and technical indicators form the focus of attention is the difficulty of construct-ing indicators that reflect responses to policy change. Similarly, it could be that indicators are selected because of data availability, not any
par-ticular relevance to policy reform. Doyle states that ‘clear causal links between policy action and resource impacts need to be identified so that links between interpreting the indicators, develop-ing appropriate policy responses and predictdevelop-ing the environmental and economic impacts can be clearly quantified.’
Thomassin (1999), however, relates that the current trend is the development of models in which policy influences production decisions in terms of crop mix and tillage practice. Results from such models are then used to estimate the environmental impacts with bio-physical models. This approach is taken in, for example, the Policy Evaluation Matrix and the Canadian Regional Agriculture Model.
In line with the observations made in this sec-tion, we therefore focus on the ability of policy makers to determine the likely implications of policy reforms on changes in farming practice. In doing so we suggest a framework for considering the likely direction and magnitude of the impact
of such changes on the natural resource
environment.
2. A framework for determining the direction and magnitude of impacts
Morrison and Pearce (1997) have previously suggested that the conjuncture of socio-economic and natural resource environments together with the policy context largely determines the way in which agricultural activity is conducted. Loosely termed the ‘farming practices’, these activities are shown to form a crucial link in the framework and in any consequent analysis, since they provide a bridge between policy change and changes in the status of the natural resource environment.
evolution of technical change as governed by fac-tors including population pressure and the policy environment determines the likely magnitude and significance of the resulting impacts on the natural resource environment.
Technological change creates the potential for farmers to increase production within ecological constraints by shifting the production function upwards (Bumb, 1995). At the same time, how-ever, the policy context often presents a constraint to the adoption of new technologies. For example, in many countries of sub-Saharan Africa, a com-bination of exchange rate, trade and agricultural price polices have eroded any incentives to in-crease agricultural production, such that the mechanisms for transmitting changes in agricul-tural technology have become severely inadequate (Cleaver and Schreiber, 1994).
If we could assume some standard and static technology, we could hypothesise as to the likely response of the farmer to a policy change in terms of any increase or decrease in input levels (both capital and land), and therefore in changes in the proportion of land under annual crops as op-posed to some other use. The nature of produc-tion technology at farm level thus plays a pivotal role in determining the way in which policy influ-ences input use (Fox, 1993).
In a more dynamic scenario, the extent to which technological evolution is driven by, for
example, population growth and/or constrained
by the policy context becomes an important focus: we need to know, therefore, the rate of technical change in order to consider the potential impacts on a range of environmental indicators that are likely to be changed as a result. However, farming practices are varied and are often constrained by the current technology. This impinges not only upon the likely response in terms of changes in farming practice, but also upon the magnitude and significance of any resulting increase or
de-crease in the status of the environmental
indicator.
These impacts are likely to be ambiguous due to the initial starting point of the agriculture sector in terms of the current level of
intensifica-tion and/or extensification of the production
sys-tem, and the likely direction of change towards
the extensive or intensive margins. These are in turn dynamically related to the policy environ-ment, and provide important points of departure when considering how to mitigate any adverse implications of the policy change, or what com-plementary measures might be appropriate to im-plement with the change.
In order to circumvent the ambiguity associated with the impact of policy, it is useful to begin by assuming that policies can be categorised as those that: (a) directly affect relative prices of agricul-tural inputs and outputs, such as input subsidies and taxes, export subsidies, exchange rate policies;
or (b) place/ease constraints on resource access
such as land reform, credit/interest rate policies,
etc.
2.1. Analysing the impacts of price policy
Consider a policy that alters the relative price ratio in favour of annual crops. Under the as-sumption that the supply elasticity in developing countries is positive, we would expect an aggre-gate increase in the production of annual crops. However, this type of analysis tells us nothing of the way in which the additional output is pro-duced. Clearly, this depends upon the farming practice that is adopted. For example, there could be increased environmental damage through in-creased input use resulting in deteriorating water quality; or we could find natural resource degra-dation in the form of soil erosion or deforestation as a result of the opening up of frontier land for crop production.
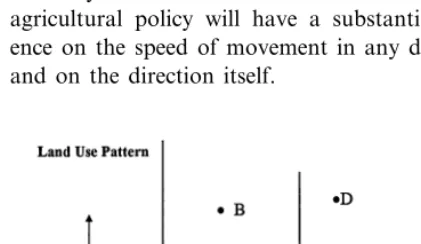
quadrant, e.g. point A, describes a land use sys-tem characterised by a small proportion of crop-ping, and extensive use of the land devoted to pasture or forest, typically mixed farming systems with a long crop rotation or fallow. Analogously, the north-west quadrant, exemplified by point B, describes arable systems which could be described as low-capital or ‘traditional’, while the southeast and northeast quadrants represent more intensive production systems.
The vertical axis can be viewed as representing a movement from production patterns character-ised by a low proportion of arable to, at the extreme, continuous mono-cropping. Movement along the horizontal axis describes an intensifica-tion of producintensifica-tion through increasing land pro-ductivity, although not necessarily rising total factor productivity.
The southwest quadrant represents the type of farming practice likely to be the most benign with regard to the natural resource environment. How-ever, the circumstances in which a farming system characterised by such practices is sustainable are not widespread, since such practices are generally static in terms of output per unit of resource and, when subject to the exogenous pressures such as
population expansion and/or income growth,
both of which increase the demand for agricul-tural output, shift in one of the directions indi-cated by the arrows. Within certain constraints agricultural policy will have a substantial influ-ence on the speed of movement in any direction, and on the direction itself.
2.2. The relationship between farming practice and en6ironmental indicators
The diagram can be extended to capture the relationship between changes in farming practice and changes in the natural resource status, under the contention that there is at best a propensity for natural resource degradation, rather than an inevitability. Developing the distinction between extensification and intensification, two broad forms of environmental degradation can be considered:
1. any form of cropping exposes the land to the risk of soil erosion through a combination of wind and water. Within certain limits it is probably true to say that the more intensive these cropping practices become, the greater the risk of erosion, with consequent on-site and off-site costs.
2. the more intensive the land use activities, the greater the risk of environmental degradation from a number of other causes, including
salinisation, chemical pollution and soil
compaction.
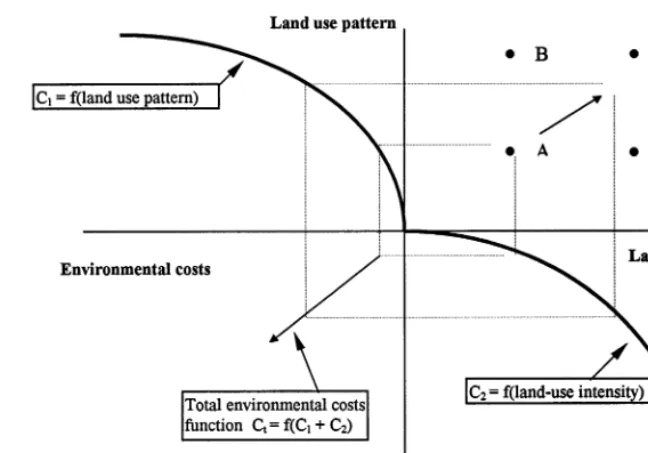
Fig. 2 shows the implications in terms of poten-tial environmental cost of a change in farming practices in a given direction. The shapes of the
two cost functions1
C1 and C2 will vary with the
particular context, especially with the patterns of temperature, rainfall and soil structure. The shape could also vary with the type of crop, since any variation in cultivation technique attributable, for example, to a change in the types or varieties of crop produced may change the magnitude of the environmental impact. Nevertheless, it can be ex-pected that they will be broadly of the shape depicted here, with costs increasing more than proportionately with increases in cropping or land use intensity.
Separating the two functions, therefore, facili-tates the separate consideration of the two under-lying features of agricultural change: extending the extensive margin of cultivation (ploughing of virgin pasture, shortening of fallows, etc.) and extending the intensive margin of cultivation
(typ-Fig. 1. Hypothetical scatter plot of farm practices.
1Note that the total cost function,C
Fig. 2. Farming practices and environmental implications.
ically through the use of improved varieties and agricultural chemicals). Historically, a frequently observed pattern of change would be illustrated by movement from point A to point B, i.e. by an extension of the cultivated area followed by move-ment towards point D, as the available cultivable land is used up and more capital-intensive meth-ods are adopted. A direct movement to point C may also occur in some farming systems as, for example, stocking rates increase owing to restric-tions on the movement of livestock, or where the land is unsuitable for cultivation.
Continuous cereal production is more likely, in most circumstances, to lead to land degradation than adopting a balanced cropping mix which facilitates more general ground cover and nutrient balance. The availability of artificial fertilisers can restore soil nutrients up to a point, but if the retention capacity of the soil is being undermined
by lack of cover and/or crusting, then heavy use
of fertilisers can lead to both acidification and the contamination of groundwater supplies. This key characteristic is described by the two cost func-tions where costs increase more than
proportion-ately with the degree of extensification or
intensification, indicating increasing marginal
damaging both the higher the ratio of crop to other land use and the greater the level of land intensity.
Because the environmental costs associated with an expansion of cropped area will vary with the cropping pattern adopted, policy interventions will influence these costs through their influence on the incentive structure and through this on the type and range of crops produced. An interven-tion, which changes relative output prices, will also influence the relative profitability of individ-ual crops. This would be manifested in Fig. 2 in a
change in the slope of the cost function C1.
Similarly, the intensification of production can involve a variety of different paths or factor com-binations. Most importantly, in many developing country contexts it can involve a choice between more intensive use of labour or capital per unit of land area. The choice will depend, to a significant extent, on relative factor prices. The capacity of
government to influence these, particularly
terms of environmental cost for example; the overuse of machinery leading to soil compaction, or the excessive use of chemical inputs leading to the contamination of water supplies. Analogously to the case of cropping activity, the influence of
policy would be manifest in the shape of the C2
curve, which could change in response to policy initiatives. The effect of policy and the overall influence of agricultural activity on the natural resource environment is depicted by shifts in the
two cost functions C1 and C2. The total cost
function demonstrates that a policy change can reverse, exacerbate or leave unchanged previous trends in natural resource degradation.
It is apparent that the movement from A to B can engender a variety of very different environ-mental impacts. Economic policy, for the reasons described above, can not only influence the way in which increased agricultural activity occurs, but also the way in which a given volume of output is produced, demonstrated by a variety of outcomes at, for example, point B. If we assume that the starting point for a typical or homogenous farm is A, and that policy changes imply that the typical farmer is presented with an incentive to increase crop production, the question arises as to whether an increase in crop production will be achieved by a move to B, where intensity remains constant but land in annual cropping increases, or C, where land under crops remains constant, but input use increases. The response will be determined by the technology or production system currently em-ployed, which in turn will depend upon the rela-tive prices of land to capital as characterised by land availability.
In circumstances where land is plentiful, the relative price of land will be low compared to that of capital inputs. Farmers are therefore unlikely to have the incentive to intensify unless there are tenurial constraints on their access to land. If there are no land constraints, it makes sense to extend the use of land and minimise the use of other inputs, i.e. capital and labour (Cleaver and Schreiber, 1994). Thus a movement towards B is likely to be the preferred response. In this case we could hypothesise, for example, that there would be an increase in the risk of natural resource degradation from soil erosion rather than an in-crease in pollution or acidification.
In some countries, however, for example, Bangladesh, there is no alternative but to continue to intensify agricultural production (Pagiola, 1995). At the same time, it should be noted that natural resource degradation is not an inevitable consequence of intensification; some modern tech-nologies such as high yielding varieties, which require less pesticide application, can have the reverse effect. In these circumstances, the correct policy intervention might be to invest more in farmer education rather than on modifying po-lices affecting prices or resource access.
2.3. Incorporating the existing state of technology
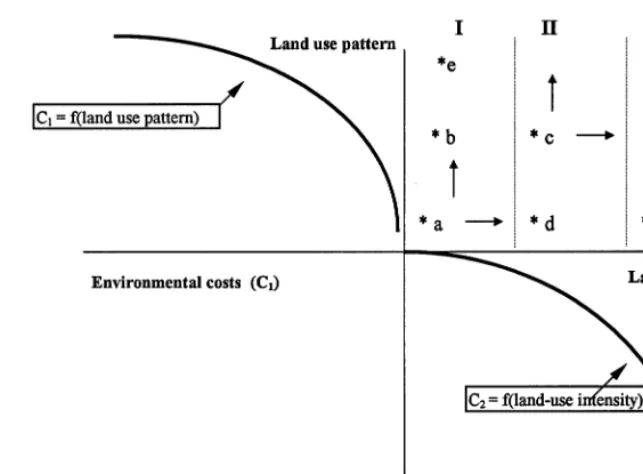
In Fig. 3, hypothetical technology ‘zones’ have been mapped in the northeast quadrant of the diagram. It is assumed that farming practices characterised by so-called ‘traditional’ technolo-gies, typically with low levels of capital and labour input per unit of land, will be located in zone I. At point a, agricultural activity is also characterised by a relatively small proportion of annual crop production: i.e. there has been little pressure on either the extensive or intensive mar-gins of cultivation. Points b and e represent farm-ing practices where the response to population pressure or increased incomes has led to an ex-pansion of area under annual crops. Zone II depicts a zone of limited technical change charac-teristic of many developing country situations where there is limited use of chemical inputs and where labour inputs per hectare may be high compared to zone I. Zone III is more typical of so-called ‘modern’ agriculture, where both the intensive and extensive margins of cultivation (point g) have been extended as far as modern technology will allow. Point f is typical of some developing country agricultural activities where there is a dual system of ownership with a highly skewed form of land ownership which has re-sulted in an intensively operated but highly land-constrained subsector.
ex-Fig. 3. Technology-specific zones.
tensive or intensive is the existing system as al-luded to previously. Of course, local contexts will vary considerably in these respects, and ideally the cost functions for each such context would be calculated. However, this would be an extremely data-intensive exercise, and in most cases, the more practical solution would be to use the ‘typi-cal’ farm context and generalise from this.
The key point here, however, is that agricul-tural policy which brings about changes in farm-ing practice will have different implications for the natural resource environment, depending on the point of departure. This implies that the type of environmental cost typically experienced at the margin in developed countries is often different to that experienced in developing countries. If farm-ing practices are located in zone I, then the
envi-ronmental costs associated with increased
production are likely to be minimal, as suggested by a shift from a to c in Fig. 3, and the concomi-tant movements along the two cost functions. Similarly, a shift from d towards c would imply some increase in external costs, but proportion-ately less than for farmers using practices located
in zone III. For example, the significance of an
x% increase in the magnitude of an
environmen-tal indicator (such as water quality) is likely to be less in an extensively farmed region than in one that is already intensively operated. The relative significance is depicted in the cost functions, which illustrate increasing marginal external cost. In theory at least, the monetary valuation of the external costs associated with intensification or extensification would allow more informed
trade-offs between the two to be made.2 Given that
most farmers in developing countries are likely to be operating close to point b in zone I or point c in zone II, agricultural policies designed to raise food production, for example, could therefore be used to encourage a higher uptake of fertiliser and pesticide use without having a major effect on environmental costs.
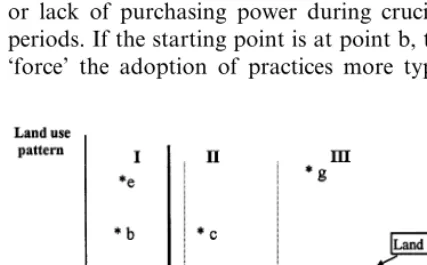
2.4. Implications of non-price policies
Policies such as land reform, infrastructure im-provement and targeted credit schemes will also potentially lead to increased output. We can use the same descriptive framework to describe this process. In Fig. 4, the northeast quadrant of Fig. 3 has been reproduced and constraint lines intro-duced to demonstrate how barriers to resource access may result, in the context of population
growth and/or rising incomes, in the diversion of
farming practices towards more costly solutions in terms of natural resource degradation than would otherwise be the case.
If the starting point was at point d, for exam-ple, and land distribution was highly skewed, the bulk of farmers would be forced, in response to rising population and incomes, to adopt practices typical of point f rather than point c. From the perspective of the natural resource environment, this is the higher cost solution. A redistributive land reform in this context could produce envi-ronmental benefits.
An analogous case can be made with regard to non-price policies which improve the access of farmers to capital inputs. In many developing countries, so-called ‘modern’ inputs are simply not available to large numbers of farmers, for example, as a consequence of poor physical in-frastructure, inadequate marketing infrastructures or lack of purchasing power during crucial time periods. If the starting point is at point b, this can ‘force’ the adoption of practices more typical of
point e rather than the lower cost (in terms of natural resource degradation) point c. Policies to improve access, such as investment in physical and marketing infrastructures, and the provision of low cost credit can overcome this constraint and achieve environmental benefits.
From the discussion above it is apparent that the static, or shortterm, response to a policy change will depend upon the technology currently employed by farmers. In addition, the dynamic or longer-term response will depend upon how con-ducive the policy context is to the adoption of technologies, which impart lower overall costs on the natural resource environment.
3. An application to South African agriculture
The issue of natural resource degradation is a very topical one in a democratic South Africa, currently embarking on a significant land reform. Agriculture has in the past been dominated by the white commercial farming sub-sector. At the same time, there is widespread concern that agricultural activity, especially that practised by commercial farmers, has proved severely detrimental to the natural resource environment. This concern is centred particularly on the issue of soil erosion, which is perceived as a long-standing problem, and more recently on soil degradation through acidification and compaction. The rate at which water supplies are either being ‘mined’ by irri-gated agriculture and forestry or reduced in qual-ity through contamination from a variety of sources has also given rise to some anxiety.
Agricultural policy in South Africa has been characterised by a number of discrete stages, al-though for much of this century it has moved along a persistent path designed to first create, and then sustain, large-scale commercial farms owned and operated by white farmers. The policy environment that characterised the ‘apartheid era’ has been adequately documented elsewhere (see for example, van Rooyen et al., 1994; World Bank, 1994). Among the many policy characteris-tics of this infamous period, it is relevant to stress here: the post-war accent on self-sufficiency which resulted from the increasing isolation of the
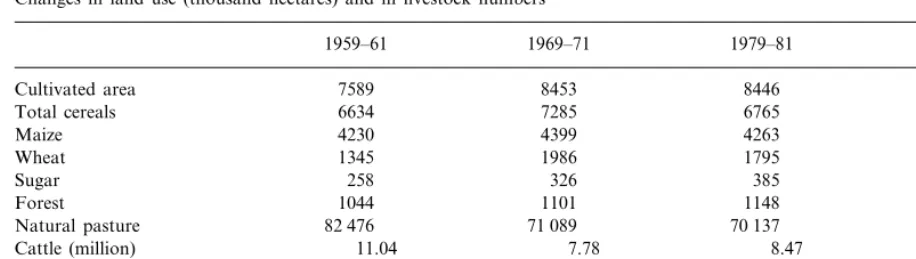
Table 1
Changes in land use (thousand hectares) and in livestock numbersa
1969–71 1979–81 1989–91
1959–61
Cultivated area 7589 8453 8446 7702
7285 6765
6634 5676
Total cereals
4230
Maize 4399 4263 3399
Wheat 1345 1986 1795 1242
326 385
258 375
Sugar
1044
Forest 1101 1148 1815
71 089 70 137
Natural pasture 82 476 67 934
7.78 8.47
11.04 8.63
Cattle (million)
34.84
Sheep (million) 32.81 30.90 29.41
4.96
Pasture/LS unit (ha.) 5.15 4.79 4.68
aNote: a livestock unit is calculated by dividing sheep numbers by seven and adding to cattle numbers. Source: derived from Gander and Forster (1994), Roth et al. (1992), RSA (1995).
regime, and its consequences in terms of increas-ing levels of support and a high degree of border protection. Both the economic and environmental costs of this approach became increasingly evi-dent, however, and the emergence of a more ‘liberal’ approach during the late 1980s, has coin-cided in recent years with political liberalisation and the end of apartheid (LAPC, 1993).
From an extensive review by McKenzie (1994), it is apparent that the principal problems affecting the natural resource environment which stem from agricultural activity in South Africa are the high rate of soil loss through erosion, by both wind and water, and soil degradation through compaction and acidification. These impacts can be considered as resulting from the extensification
and/or intensification of agriculture. A series of
potential links between agricultural activity and the natural resource environment are suggested:
The extension of the arable area onto soils and
slopes unsuited to cultivation has greatly in-creased the rate of soil erosion. This has been due to the encroachment of cereal, particularly maize, cultivation on soils unsuited to arable cropping; and the extension of agricultural ac-tivity, particularly sugar-cane and possibly tim-ber production onto inappropriate gradients.
Overstocking of livestock has contributed both
to soil erosion and soil compaction.
High levels of soil acidity have been
exacer-bated by over-use of (particularly) nitrogenous fertilisers and too little application of lime.
Investment subsidies have led to inappropriate
capital/labour ratios in agriculture, and
exces-sive use of heavy machinery has contributed to problems of soil compaction.
The discussion in the preceding part of this paper highlighted the different implications of relative prices on the one hand, and constraints on resource access on the other. Given the data limitations, however, it is not feasible to review the South African example using the same di-chotomy. Instead, the following analysis concen-trates on those factors leading to an extension in the margin of cultivation, and those leading to intensification.
3.1. Extending the margin of culti6ation
The increase in the proportion of farmland under cultivation, or the decline in the area under permanent natural pasture, has been one of the factors contributing to the level of soil erosion. There are no time series data available for natural resource degradation to match with the changes in land use, but circumstantial evidence suggests that the breaking up of permanent pastures in areas of low and variable rainfall, and where soils have a low clay content, has contributed substantially to the current degree of soil degradation.
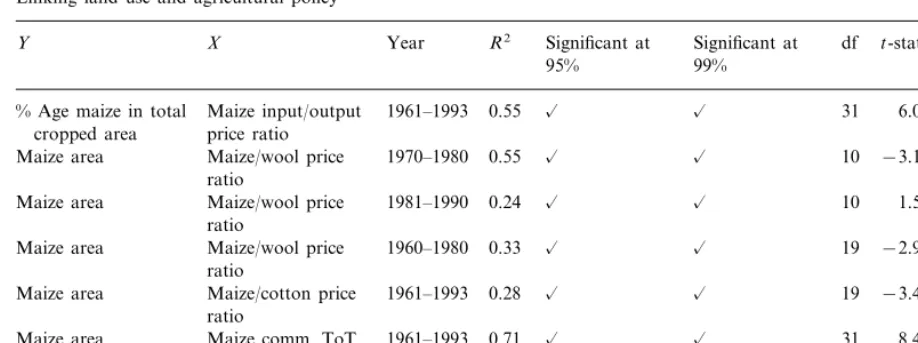
Table 2
Linking land use and agricultural policya
Year R2 Significant at Significant at X
Y df t-stat Fvalue
99% 95%
Maize input/output 1961–1993 0.55 36.88
% Age maize in total ã ã 31 6.07
cropped area price ratio
Maize/wool price 1970–1980
Maize area 0.55 ã ã 10 −3.16 9.99
ratio
Maize/wool price 1981–1990 0.24 ã
Maize area ã 10 1.59 2.53
ratio
Maize/wool price 1960–1980 0.33 ã
Maize area ã 19 −2.95 8.72
ratio
Maize/cotton price 1961–1993 0.28 ã
Maize area ã 19 −3.41 11.60
ratio
1961–1993 0.71 ã ã 31
Maize area Maize comm. ToT 8.48 71.83
1960–1981 0.40 ã ã
Sugar prices 22
Forest area 3.64 13.22
Forest area Sugar prices 1981–1993 0.80 ã ã 12 −6.69 44.77
aSource: authors’ calculations.
these trends have since been partially reversed does not detract from the likelihood that the period including the 1960s, and possibly starting earlier, witnessed a sharp upturn in the extent of arable cultivation in marginal areas, and concomi-tant increase in soil erosion. Not only is the expansion of cropped area driven by the growth in cereal production but, since the latter grows at a faster rate than the former, there may also have been an increase in the degree of continuous cereal production. The latter exacerbates the loss of groundcover and the possibility of soil erosion. Thus, there is some empirical evidence to cor-roborate the premise that there has been an en-croachment of cereal production onto marginal lands, and that this may also have been accompa-nied by rotational changes in farming systems. The question remains, however, as to the extent to which these developments can be linked to agri-cultural policy. Possible links can be developed through an examination of commodity price pol-icy because the latter has been the lynch pin of government support to agricultural production, particularly with respect to cereals.
Analysis of the commodity terms of trade and relative crop price ratios reveals some evidence, albeit limited, to suggest that agricultural price policy may have been an important factor in engendering the expansion in the cultivated area.
The values in Table 2 demonstrate (through cor-relation coefficients) the strength of cor-relationships
between the policy variable (X) and the
conse-quences for farming practice (Y variable).
The crucial period of expansion is that from 1960 to the mid-to-late 1970s, and it is during this period that the relative price of maize favoured the cereal expansion that occurred. Thus, it seems likely that relative prices were important in shap-ing croppshap-ing patterns and rotations. The expan-sion of cereal cultivation, however, in so far as it took place in marginal areas, encroached on rangeland or natural pasture. In this respect the most common competitive output would be from sheep. Wool production is one of the principal outputs from natural pasture, and the conclusion that agricultural price policy was at least partly responsible for the encroachment of arable culti-vation onto marginal lands is reinforced by the
observation that the maize/wool price ratio has
risen consistently for much of the period of ex-pansion in maize area. The price ratio fell back subsequently, again partially explaining the fall back in the area of maize cultivated.
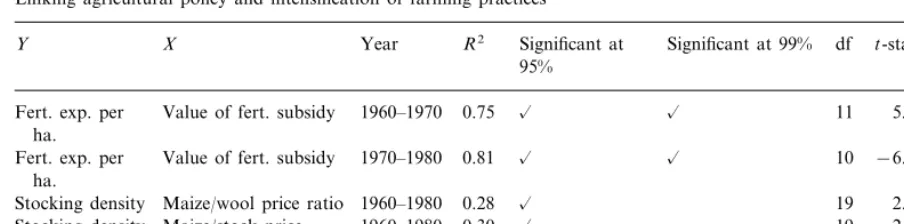
Table 3
Linking agricultural policy and intensification of farming practicesa
Y X Year R2 Significant at Significant at 99% df t-stat Fvalue 95%
Value of fert. subsidy 1960–1970 0.75 ã ã
Fert. exp. per 11 5.14 26.44
ha.
Fert. exp. per Value of fert. subsidy 1970–1980 0.81 ã ã 10 −6.32 39.91 ha.
1960–1980 0.28 ã
Maize/wool price ratio 19
Stocking density 2.66 7.05
Maize/stock price
Stocking density 1960–1980 0.30 ã 19 −2.77 7.68
ratio
aSource: authors’ calculations.
bulk of the sugar cane is produced, and where there is competition for land between timber and sugar cane production. Production of these crops has expanded considerably in recent years, with the area devoted to each growing significantly and, in the case of sugar cane, yields also increas-ing. There is no direct evidence to quantify the extent to which the expansion of either of these activities has led to cultivation of hitherto unculti-vated slopes, but there is substantial anecdotal evidence. From the perspective of soil erosion, timber production can be a preferred alternative to sugar cane, but this has its own problems since forests can be heavier users of scarce water resources.
The link to agricultural policy is tenuous, but not altogether without substance (Table 3). In spite of falling real sugar prices during the 1980s, changes in policy with regard to sugar production facilitated an expansion in small-scale sugar pro-duction, which exacerbated the trend towards hill-side cultivation. The negative correlation between sugar-cane prices and area under timber produc-tion suggests that the expansion in sugar-cane production would have been more pronounced with more severe consequences had it not been for the relative rise in returns to timber production.
3.2. The intensi6e margin of culti6ation
Not only the proportion of cultivated land to the total, but also the management of cultivated land is important in determining the sustainability of agricultural practices, and it is apparent that
intensification of production methods has also been a factor in the degradation of the natural resource base. For example, livestock numbers have not fallen in line with the area of rangeland available for grazing, suggesting more intensive grazing and (conjectural) overstocking, especially because the traditional rangeland animals are sheep rather than cattle.
The data also show that there was an increase in stocking density after 1970, although it is prob-able that it was falling prior to this date. Certainly the index of livestock numbers fell during the 1960s, reflecting a fall in both sheep and cattle numbers, and numbers have not since recovered to the levels of the late 1950s. The fall in stocking intensity is due to the decline in the area under natural pasture, rather than to any increase in numbers. Agricultural policy may have influenced these trends in two ways: (a) by influencing activ-ities in the livestock sub-sector directly; and (b) through the impact on the relative profitability of crop and livestock production. In addition, growth in the use of chemical inputs as well as anecdotal evidence suggesting a growth in mono-cropping point to the potential creation of envi-ronmental problems through intensification of production.
hectare expanded substantially during the 1960s and 1970s, before declining and then levelling off in the 1980s. In the absence of appropriate data any association between changes in fertiliser use and in the level of soil acidity is only conjecture; nevertheless, the fact that quantities applied fol-lowed the observed pattern suggests that applica-tion exceeded the optimal, particularly during the early 1970s. The partial correlation between fer-tiliser subsidies and use per hectare does suggest that the policy of input subsidisation played a role in this.
4. The implications for policy
The discussion in this paper has assumed that agricultural policy can impact on the natural re-source environment through farming practice. At the same time, many of the undesirable conse-quences of agricultural activity in this respect can be mitigated through the simultaneous adoption of conservation measures. The extent to which such measures are adopted will depend not only on the private (as opposed to social) costs and benefits, but also on the effectiveness of the exten-sion service and on environmental policy.
The previous discussion concluded that there were some grounds for believing that agricultural policy had influenced agricultural activity in South Africa in a way which may have been harmful to the natural resource environment. The most apparent ways in which this may have been the case are with respect to: (a) the relative incen-tives provided to cereal production compared to livestock production (particularly wool), leading in the 1960s to a rapid expansion of the area under cereal cultivation; (b) the probability that fertiliser use was greater than optimal; and (c) the high levels of protection afforded the sugar-cane sector and the consequent expansion of cultiva-tion onto inappropriate terrain.
The assumption that agricultural policy could influence the extent to which the natural resource base is degraded or eroded may be a tenable one, but there is no agreement concerning either the direction or extent of influence. Successful envi-ronmental policy requires a combination of three
principal components: knowledge of environmen-tal status and the ability to monitor it at the local level; the legislative framework or set of laws and codes of practice governing farmers’ activities (en-vironmental policy per se); and the will and ability to implement the policy.
In many cases none of these are present, and it is probably rare that all three combine in an effective manner. In South Africa the Soil Conser-vation Act was designed to institute preventative action through the establishment of Soil Conser-vation Committees in 1946, which were commit-tees constituted and run by the local farming community. They were designed to place responsi-bility for the implementation of environmental policy in the hands of farmers themselves, exer-cised through the committees invested with the necessary powers to monitor and prosecute farm-ers for failing to take appropriate soil conserva-tion measures. Other legislative efforts included a drought insurance scheme for stock farmers, a veld reclamation scheme and a stock reduction
scheme.3
It is estimated that R130 million was spent by the Government of South Africa on financial aid for soil conservation between 1948 and 1983, prior to the Conservation of Agricultural Re-sources Act. The Soil Conservation Scheme was established under the latter Act and implemented
by the Soil Conservation Committees. The
Scheme provides subsidies or low-interest loans for soil conservation works such as the construc-tion of weirs, storm water furrows, contour banks and cover cropping; drainage; veld utilisation pro-grammes such as fencing and watering systems; and drought relief activities such as fodder storage facilities and feed paddocks. Between 1988 and 1993, subsidies to the value of some R37 million were paid for soil conservation efforts through the
scheme, and around R13 million provided
through low interest loans.
While payments under the Act were substantial, the enforcement of conservation policy was weak. There were very few successful prosecutions (Bar-low, 1995). It appears that the policy of allowing
farmers to police their own activity through the Soil Conservation Committees did not prove suc-cessful. The necessary legislative framework may be in place, but the means and will to implement it are perhaps absent.
If the options for changing land use are limited, the onus shifts to environmental (or conservation) policy to protect the natural resource environ-ment. ‘Free’ markets for agricultural produce, at least as far as the major staple commodities are concerned, do not exist anywhere and are unlikely to exist in the future, although there is a trend towards less intervention and more transparency, at least in developing countries. Governments, including the South African Government, will continue to intervene in some respect. The ques-tion then arises as to whether such intervenques-tion (in the form of agricultural policy) should take account of any prospective environmental conse-quences, or whether conservation is the exclusive domain of environmental policy.
There is no straightforward answer to this ques-tion, but knowledge of the consequences of policy action is a necessary starting point. At the same time, it is most probably fair to conclude that the greater the number of targets attributed to any single policy intervention, the less it is likely to achieve any.
5. Concluding remarks
It is important for policy makers to realise that a specific policy change can have a wide array of potential impacts upon the natural resource envi-ronment, depending upon the wider policy
con-text and the type of technology currently
employed. As demonstrated with the South African application, it should be possible in a limited information scenario, to trace the likely response of farmers with regard to the practices used in agricultural activity, in order to achieve an a priori indication regarding which natural re-source indicators should be monitored, and what complementary measures are likely to be neces-sary in order to offset any unacceptable environ-mental costs.
Definitive conclusions in a study of this kind are hard to draw. The use of aggregate data often masks as much as it reveals. In addition, although South Africa is better placed than many countries, particularly other developing countries, with re-gard to the documented knowledge of environ-mental degradation, the lack of local (or even regional) estimates, and of time series data, makes correlation with specific agricultural policies little more than conjectural. The evidence suggests that such links can be made if routed through vari-ables associated with farming practice, but the argument remains for the present largely circum-stantial. It should be stressed, however, that the approach outlined in this paper is merely designed to preface more detailed research prior to policy implementation. In particular, more empirical in-vestigation would be required to: (1) classify farm-ing practices in terms of (a) the technology employed and (b) how close existing systems are to the margin; (2) determine the extent and trajec-tory of the environmental costs as represented by the shape of the cost curves.
It is also apparent that in the analysis we have not attempted to incorporate the effects of conser-vation measures and the effects that extension and other environmental policy interventions might have in terms of the adoption of more sustainable farming practices. An extension of the above to incorporate such interventions into the analysis in a similar manner to that describing alternative economic policies would, however, be relatively straightforward.
References
Barlow, G.R., 1995. Soil conservation in South African com-mercial agriculture: economic implications for soil conser-vation policy formulation, with reference to selected areas in Kwazulu – Natal. MSc Thesis, Department of Agricul-tural Economics, University of Natal.
Cleaver, K., Schreiber, G., 1994. Reversing the Spiral: The Population, Agriculture and Environment Nexus in Sub-Saharan Africa. The World Bank, Washington, DC. Doyle, C.J., 1999. Overall summary of the Workshop
discus-sion and recommendations. In: OECD, Environmental In-dicators of Agriculture, Issues and Design: The York Workshop, vol. 2. OECD, Paris, pp. 49 – 64.
Fox, G., 1993. The Environmental Assessment of Agricultural Policies: A Canadian Perspective. Agriculture Canada, Ott-awa, Mimeo.
Gander, M., Forster, S., 1994. Impact of commercial af-forestation on the rural areas of South Africa. Land and Agricultural Policy Centre Working Paper No. 8. LAPC, South Africa.
Islam, N. (Ed.), 1995. Population and Food in the Early Twenty-First Century: Meeting Future Food Demand of an Increasing Population. IFPRI, Washington, DC. Land and Agricultural Policy Centre (LAPC), 1993.
Agricul-tural marketing and pricing in a democratic South Africa. Policy Paper No. 2, September.
McCalla, A., 1994. Agriculture and food needs to 2025: why should we be concerned? Sir John Crawford Memorial Lecture. International Centres Week, 27 October, Wash-ington, DC.
McKenzie, C., 1994. Degradation of arable land resources: policy options and considerations within the context of rural reconstruction in South Africa. Development Bank of South Africa. Paper presented to the LAPC Workshop, March, Land and Agricultural Policy Center, Johannesburg.
Morrison, J.A., Pearce, R., 1997. A methodology for investi-gating the impact of agricultural policy on the natural resource environment in developing countries. In: Kirk-patrick, C., Lee, N. (Eds.), Sustainable Development in a
Developing World: Integrating Socio-Economic Appraisal and Environmental Assessment. Edward Elgar, Cheten-ham, UK, pp. 88 – 111.
Munasinghe, M., Cruz, W., 1994. Economywide Policies and the Environment. World Bank, Washington, DC. OECD, 1997. Environmental Indicators for Agriculture.
OECD, Paris.
OECD, 1999. Environmental Indicators for Agriculture: Con-cepts and Framework, Vol. 1. OECD, Paris.
Pagiola, S., 1995. Environmental and natural resource degra-dation in intensive agriculture in Bangladesh. Environmen-tal Economic Series Paper No. 15. Environment Department Papers. World Bank, Washington, DC. Pearce, D., 1999. Measuring sustainable development:
implica-tions for agri-environmental indicators. In: OECD, Envi-ronmental Indicators of Agriculture, Issues and design: The York Workshop, vol. 2. OECD, Paris, pp. 29 – 46. Roth, M., Dolney, H., Wiebe, K. 1992. Employment,
effi-ciency and land markets in South Africa’s agricultural sector: opportunities for land policy reform. University od Wisconsin, Mimeo, May.
Republic of South Africa (RSA), 1995. Abstract of agricul-tural statistics, Department of Agriculture.
Thomassin, P.J., 1999. Using agri-environmental indicators to assess environmental performance. In: OECD, Environ-mental Indicators of Agriculture, Issues and Design: The York Workshop, vol. 2. OECD, Paris, pp. 131 – 152. van Rooyen, J., Kirsten, J.F., van Zyl, J., Vink, N. 1994.
Structural adjustment and agricultural policy reform in South Africa. Working Paper, USAID Southern African Trade and Structural Adjustment Project.
World Bank, 1994. South African Agriculture: Structure, Per-formance and Options for the Future. Agriculture and Environment Division, South Africa Department, January.