European Journal of Agronomy 12 (2000) 251 – 268
A survey on actual agricultural practices and their effects
on the mineral nitrogen concentration of the soil solution
Carlo Grignani *, Laura Zavattaro
Dipartimento di Agronomia,Sel6icoltura e Gestione del Territorio,Uni6ersita` di Torino,6ia Leonardo da Vinci,44,
10095Grugliasco,Italy
Received 19 April 1999; received in revised form 1 October 1999; accepted 4 February 2000
Abstract
In intensive integrated crop-livestock farming systems, the surplus of N at the farm scale may be large and reflects on the N balance at the field scale. A study was conducted to assess the N fertilizer efficiency in four private farms in intensively cropped areas of NW Italy, and to monitor the effects of agricultural practices on the mineral N concentration of the soil solution, sampled every 2 weeks for 2 years and considered as an indicator of potential leaching. Two cultivation systems were compared in each farm, one involving continuous maize rotation, the other assuring a continuous soil cover (permanent meadow or winter cereal-maize double cropping system). The fertiliza-tion level in the arable crops was high (369 – 509 kg N ha−1year−1) compared to the crop removals, and resulted in
a low efficiency, as indicated by the four examined efficiency indexes (calculated N surplus, N removal-fertilizer ratio, N apparent recovery, N use efficiency). The soil-water-nitrate concentration showed large temporal variations in the range of 1 – 150 mg l−1for five out of the eight cropping situations, while concentrations smaller than 10 mg l−1were
always recorded in the meadows and in one of the four soils (Aeric epiaquept). The fertilizer management that characterized each cropping system affected the soil-mineral-nitrate content in shallow arable soils. The longer soil cover duration in double-cropping systems did not result in a reduction of soil N compared to maize as a single crop, not even in winter (the bare-soil intercropping period in maize-based systems). However, the temporal oscillations of the concentration were buffered by the crop cover duration and by the presence of a shallow water table (1 m deep) in the soil profile. The average nitrate content of the soil could be predicted by the N uptake of the crop, the N removal – fertilizer ratio, the soil pH and sand content, however no simple explanatory relationship was found with the experimental factors. Hence, in farm conditions, in the absence of sufficient data for a deterministic model approach, the target of reducing the risk of leaching should be achieved by maximizing the fertilizer efficiency. © 2000 Elsevier Science B.V. All rights reserved.
Keywords:Cultivation systems; Fertilizer efficiency; Nitrogen leaching; Soil nitrate content
www.elsevier.com/locate/euragr
1. Introduction
Environmental sustainability of intensive inte-grated crop-livestock farming systems lies
primar-* Corresponding author. Tel.:+39-11-6708777; fax:+ 39-11-6708798.
E-mail address:[email protected] (C. Grignani)
ily in the efficiency of the use of nutrients, above all nitrogen (Schepers and Fox, 1989). A study on different kinds of breeding farms in Piemonte (Grignani, 1996) showed a general imbalance be-tween farm global inputs and outputs, with a nitrogen surplus of 300 kg ha−1 year−1, on aver-age. The nitrogen inputs were mainly concentrates and fertilizers, but only 30% of the total input was found in farm outgoing products (meat, milk and grain). Consequently, most of the nitrogen input was leached with drainage water, lost in volatile compounds or accumulated in the farm system, such as in soil organic pools. These and similar results obtained in other countries (Jarvis, 1993; Simon et al., 1994; Weissbach and Ernst, 1994; Cuttle, 1997) have often led policy makers to ascribe high nitrate leaching losses to intensive livestock farming systems.
Although several studies of nitrogen leaching have been undertaken over many decades in vari-ous environments (Juergens-Gschwind, 1989), the general understanding of the effects of agricul-tural practices on N leaching remains fragmen-tary. Assessment of N leaching is in particular greatly influenced by the method used to measure leachable mineral N (such as soil-core extractions, ceramic cups, lysimeters, tile drainage, plot or farm balance), as well as by the scale at which N leaching quantification is undertaken (such as soil profile, experimental plot, farm or catchment; Armstrong and Burt, 1993).
Most studies have been conducted at the point measurement scale, focusing on the soil mineral N concentration (Cavazza et al., 1986; Patruno, 1987; Verte´s and Decau, 1992; Benoit, 1994; Par-dini et al., 1995; Grignani et al., 1996). At this scale, a theoretical deterministic description of the vertical water and solutes movement is available, obtained from several decades of laboratory ex-periments (Jury and Flu¨hler, 1992). Two-dimen-sional field studies have been conducted, mainly using tile drains (Decau and Le Corre, 1992; Scholefield et al., 1993; Lewan, 1994; Drury et al., 1996; Borin, 1997), while three-dimensional stud-ies on catchments and model applications coupled to GIS systems are becoming extremely popular (Shaffer et al., 1996; David et al., 1997; Richter et al., 1998 among others).
A further difficulty encountered in N leaching research is that of the representativeness of exper-imental treatments in comparison to the agricul-tural practices adopted by farmers. Crop management is often conditioned to a great extent by farm organization systems, in particular in forage systems oriented to livestock production, where both the forage yield (in terms of fodder quality, rather than DM production) and the organic fertilizer supply are connected to animal husbandry. Hence, choices on the crop, rotational system, time, amount and type of fertilizer appli-cations, tillage, irrigation, etc., are not indepen-dent, and an evaluation of the real effects of the cultivation system can be carried out through an analysis of real situations, in real farms. Some authors have therefore tried to work in situations where agricultural practices were a variable rather than a factor (Benoit et al., 1995; Vereijken, 1997), although this may imply a higher degree of uncertainty, as not all variables can be measured with the same precision as in experimental plots. The objective of this study was to assess the response of the mineral nitrogen concentration of the soil solution to various aspects of forage system management (crop and crop rotation, kind of fertilizer supplied, time and amount of supply) in real conditions, after monitoring the effectively adopted agricultural practices. The analysis was conducted in four private farms, two dairy cow-breeding farms and two pig cow-breeding farms, com-paring two fields cultivated with different crops.
2. Materials and methods
2.1. Experimental design
Two typical breeding systems of the western Po plain were considered in four private farms in Piemonte (NW Italy): two were intensive dairy cow breeding farms (C) and two intensive pig breeding for fattening farms (P). As reported in Table 1, two farms of each kind lay on shallow and stony soils (CS and PS) and two on deep soils (CD and PD). The analysis was carried out in two fields, or cultivation systems, in each farm, a and
C
.
Grignani
,
L
.
Za
6
attaro
/
Europ
.
J
.
Agronomy
12
(2000)
251
–
268
253
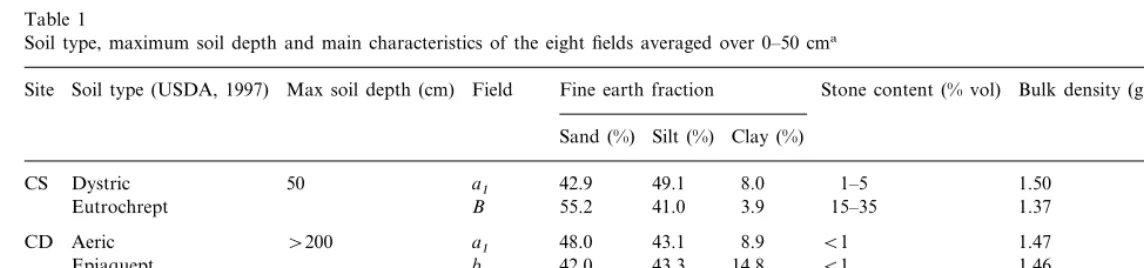
Table 1
Soil type, maximum soil depth and main characteristics of the eight fields averaged over 0–50 cma
Site Soil type (USDA, 1997) Max soil depth (cm) Field Fine earth fraction Stone content (% vol) Bulk density (g cm−3) OM (%) N (%)
Silt (%) Clay (%) Sand (%)
8.0 1–5 1.50 2.66
42.9 0.154
CS Dystric 50 a1 49.1
Eutrochrept B 55.2 41.0 3.9 15–35 1.37 4.34 0.256
8.9 B1 1.47 1.60 0.106
43.1
CD Aeric \200 a1 48.0
14.8 B1 1.46 1.40 0.094
Epiaquept b 42.0 43.3
12.1 5–15 1.58 1.75
52.1 35.8 0.112
a2
60 Typic
PS
65.0 29.4 5.6 15–35 1.44 2.00 0.133
Haplustalf b
9.7 1–5 1.50 1.92 0.129
43.5 46.8 PD Aquic ustochrept 100 a2andb
1. field a was a permanent meadow in the dairy cow breeding farms (a1), and a double crop-ping with barley or Italian ryegrass as a winter crop, and maize (marrow plant in one in-stance) as a summer crop in the pig breeding farms (a2);
2. field b was cultivated with grain maize or silage maize as a single crop at all four sites. Maize as a single crop was chosen as an exam-ple of a crop that leaves the soil bare during winter. Because it is very frequent in the Po plain it was used as a common treatment for all the farms. The other crops in fieldawere chosen from those that provide an active growing potential during winter, and differed according to the farm organization. However, the permanent meadow
(a1) represented a less intensive cultivation system
compared to maize as a single crop, while the double cropping (a2) was more intensive. In this work the crop systems are analyzed as the whole combination of crops on a year basis, without referring to single components.
All the measurements were carried out in two 6×8 m plots, drawn within a large field and considered as replicates. The distance between the two plots ranged approximately from 30 to 60 m, depending on the field size, but the plots were far enough from the field edges to avoid border ef-fects. The experiment was carried out for 2 years, between autumn 1994 and autumn 1996.
2.2. Soil characteristics and climate
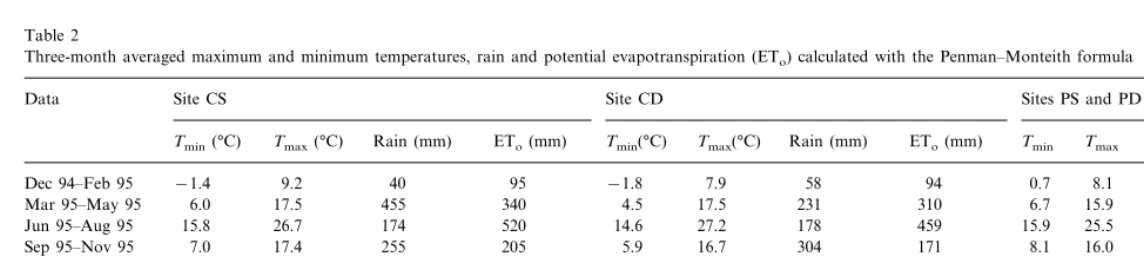
Three soils were Inceptisols (sites CS, CD and PD) and one was an Alfisol (site PS), as reported in Table 1. The soils at sites CS and PS were particularly shallow because the stone content exceeded the fine earth fraction below 40 – 60 cm. The texture in these soils was coarser than at the CD and PD sites. The soil at site CD, evolved on loess depositions, was deep and less stratified than the other three, which evolved on river deposi-tions. At site PD, a water table lay in a gravel layer below the 1-m deep topsoil, the depth of which oscillated between 90 and 120 cm (Zavat-taro, 1998). The total N and OM contents of the soil were particularly high at CS, compared to the other locations, which were more representative of normal soil conditions in the area. Further details on the soil characteristics are reported in Zavattaro (1998). Synthetical weather information is reported in Table 2.
2.3. Agricultural practices
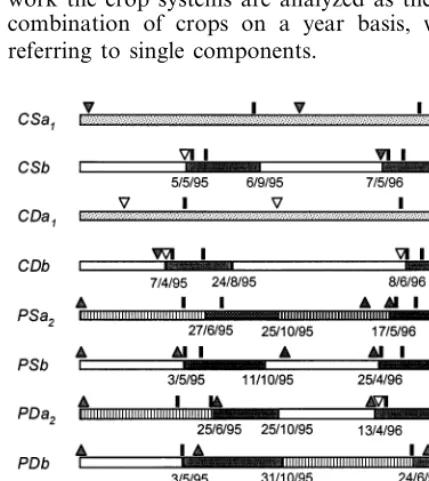
The experimental activity did not interfere with the farmers’ choices on agricultural practices. No external machinery was used. Neither the time nor the amount of fertilizer supply was influenced, except in the zero-nitrogen plots, as indicated below. The time and kind of nitrogen supply for each crop are reported in Fig. 1.
2.4. Nitrogen supply
The amount of effectively spread organic fertil-izer was measured at each application. Cow ma-nure spread on two 2×2 m-plastic sheets laid side by side was weighed at each plot. The amount of
Fig. 1. Crop sequence in the eight examined fields. The sowing and harvesting dates, and the time of nitrogen fertilizer appli-cations are also indicated. CS, cattle breeding and shallow soil; CD, cattle breeding and deep soil; PS, pig breeding and shallow soil; PD, pig breeding and deep soil; a1, permanent
C
.
Grignani
,
L
.
Za
6
attaro
/
Europ
.
J
.
Agronomy
12
(2000)
251
–
268
255
Table 2
Three-month averaged maximum and minimum temperatures, rain and potential evapotranspiration (ETo) calculated with the Penman–Monteith formula
Sites PS and PD Site CD
Data Site CS
Tmax(°C) Rain (mm) ETo(mm) Tmin Tmax Rain (mm)
Tmin(°C) ETo(mm)
Tmin(°C) Tmax(°C) Rain (mm) ETo(mm)
−1.8
−1.4 9.2 40 95 7.9 58 94 0.7 8.1 23 109
Dec 94–Feb 95
17.5 231 310 6.7 15.9 284
4.5 323
6.0
Mar 95–May 95 17.5 455 340
14.6
15.8 26.7 174 520 27.2 178 459 15.9 25.5 191 468
Jun 95–Aug 95
5.9
7.0 17.4 255 205 16.7 304 171 8.1 16.0 194 197
Sep 95–Nov 95
4.6 232 59 0.0 5.3 122
−1.3 75
246 80
Dec 95–Feb 96 −1.0 6.5
5.4
6.7 16.7 205 340 16.2 199 280 7.0 15.1 272 306
Mar 96–May 96
27.2 164 460 15.6 25.1 134
Jun 96–Aug 96 16.1 26.5 210 503 13.9 460
16.3 254 173 7.8 14.9 361
6.9 185
16.7
Sep 96–Nov 96 7.4 312 189
5.7
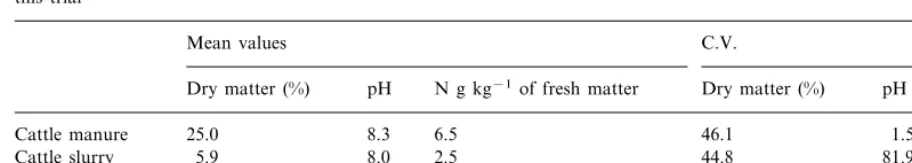
Table 3
Average dry matter, pH and total nitrogen content and their variability (coefficient of variation) of the organic fertilizers used in this trial
C.V. Mean values
pH N g kg−1of fresh matter
Dry matter (%) Dry matter (%) pH (%) N (%)
8.3 6.5
Cattle manure 25.0 46.1 1.5 28.0
8.0 2.5 44.8
5.9 81.9
Cattle slurry 21.0
8.2 6.0 11.7 89.4 14.3
Pig slurry 5.9
cattle and pig slurry was measured in 15 circular basins (40 cm in diameter and 6 cm in height) placed in each plot at a rectangular grid of 6×4 m. A chemical analysis was performed on a sam-ple of organic fertilizer, at each application. Only the results concerning the total N content are here discussed. Some relevant average characteristics are reported in Table 3.
The mineral fertilizer supply was not directly measured. The total amount spread over the field was simply divided by the field area.
2.5. Crop production and uptake
Crop and grass yields were measured just be-fore harvesting on sampling areas randomly placed at each plot. Sampling areas were 18 m2 for maize, 4 m2for barley, and 0.5 m2for ryegrass and meadows. Total above-ground biomass and grain yield were weighed over the whole sampling area. A sub-sample of about 2 kg was dried at 70°C for 48 h for determination of DM produc-tion. DM tissues was subsampled and ground for subsequent total N analysis.
Two additional zero-nitrogen plots were drawn in each field, to test the fertilizer efficiency. No N-fertilizer was spread over these plots over the two years. Yield and N uptake were the only measurements carried out in the 0-N plots.
Four indexes for N fertilizer efficiency were considered: calculated surplus (fertilizer minus re-moval); removal-fertilizer ratio; apparent recov-ery, obtained as (N uptake in the fertilized plots minus N uptake in the 0-N plots) / N supplied through fertilization; N use efficiency, obtained as (DM production in the fertilized plots minus DM production in the 0-N plots)/N supplied through fertilization (Guillard et al., 1995).
2.6. Monitoring the soil solution concentration
The nitrate and ammonium concentration of the soil solution was monitored every 2 weeks, although samples could not be collected when the soil was too dry. The soil solution was extracted by creating a suction of approximately 0.7 bar in a set of three porous cups placed about 1 m apart in each plot. After 24 h, the contents of the three cups were extracted and mixed, and a sample was refrigerated and analyzed using a colorimetric technique (Verte´s and Decau, 1992). Three cups were used to average the small-scale spatial vari-ability and also to assure a sufficient amount of solution for the analysis.
Porous cups are widely used to assess solute leaching through unsaturated soil. Although sev-eral authors pointed out that results may be af-fected by the fact that they sample water from a limited size of pores, expecially from macropores (Grossman and Udluft, 1991; Webster et al., 1993), there are evidences that they are reliable and accurate for monitoring nitrate leaching on fairly homogeneous soils, particularly where the amount of clay is not too high, as in the situations examined here (Poss et al., 1995). Another advan-tage of ceramic cups is the fact that, as they can be left in place, changes over time are not con-founded with changes due to sampling from dif-fering locations as is the case with successive soil sampling (Poss et al., 1995).
pre-C.Grignani,L.Za6attaro/Europ.J.Agronomy12 (2000) 251 – 268 257
vailed over the fine earth fraction (Table 1). In all soils and fields the number of roots remark-ably decreased below 40 – 60 cm, hence the depth of 50 cm can be considered as the bottom boundary of the active root system in all the explored situations. Additional cups were placed in the two deep soils and used for modelling nitrate leaching (Zavattaro, 1998), but field re-sults are not discussed here. In the permanent meadows, the cups were completely buried and collecting tubes were gathered in a pit, in order not to hinder mechanical operations. In the arable fields, the cups were removed before tillage and installed again afterwards, 2 – 4 times a year, depending on the crop rotation. In maize, they were placed along the crop rows.
The ceramic cups used were 3 cm in diameter and 7.4 cm long, with a nominal conductivity of 8×10⁻⁷ cm s−1 and an air entry value of 100 kPa.
2.7. Statistical treatment of the nitrate concentration data of the soil solution
In order to test whether the nitrate concentra-tion of the soil soluconcentra-tion was different in the two fields in each site, due to the effect of the culti-vation system (field a versus b) or the season (summer versus winter, where winter is the bare soil period in field b), an analysis of variance for repeated measures, corresponding to a split-split-plot design (Diggle et al., 1994), was performed on the time series of NO3-N concentration. Time was regarded as a factor onn-levels, in a hierar-chical design, with time units as sub-sub-plots.
The data represented time successions and were tested for autocorrelation. This analysis was made shifting each series by multiples of the time lag, corresponding to the sampling interval. The serial correlation coefficient (Camussi et al., 1995) was calculated for each pair. The signifi-cance (a=0.05) of the serial correlation coeffi-cient was tested according to Vianelli (1959).
The variables affecting the average nitrate concentration in the soil solution were searched for with a simple correlation and a multiple re-gression approach. The input variables tested were:
the physical characteristics of the soil:
percent-ages of sand and clay, volumetric stone con-tent, saturated hydraulic conductivity at the soil surface (Ks), bulk density, soil depth. All these variables (except Ks) were measured at a depth of 50 cm;
the chemical characteristics of the soil: organic
carbon, humus carbon (extracted in sodium pyrophosphate according to IPLA, 1984), total nitrogen, potentially mineralizable N (Stanford and Smith, 1978), C/N ratio, pH and cation exchange capacity;
crop variables (averaged over 2 years): N
up-take and removal, days of bare soil between subsequent crops;
management variables (averaged over 2 years):
N fertilizer supply, fertilizer supplied before ploughing or harrowing (that is, excluding sur-face applications), total N supply (fertilizer and crop residues);
N fertilizer efficiency indexes: calculated
sur-plus, removal-fertilizer ratio, apparent recov-ery, as previously defined.
The concentration of the soil solution (depen-dent variable) was averaged over the 2 years after weighting over time, while the two plots were considered separately, therefore the total number of cases was 16. The selection of variables was stepwise, with the entry criteriona=0.05 and the removal criterion a=0.10. The input variables were tested for correlation, to ensure that the choice of variables entering the model was not for numerical reasons.
2.8. Assessing nitrate leaching using the LEACHM model
3. Results and discussion
3.1. Nitrogen supplied with fertilization and N remo6al
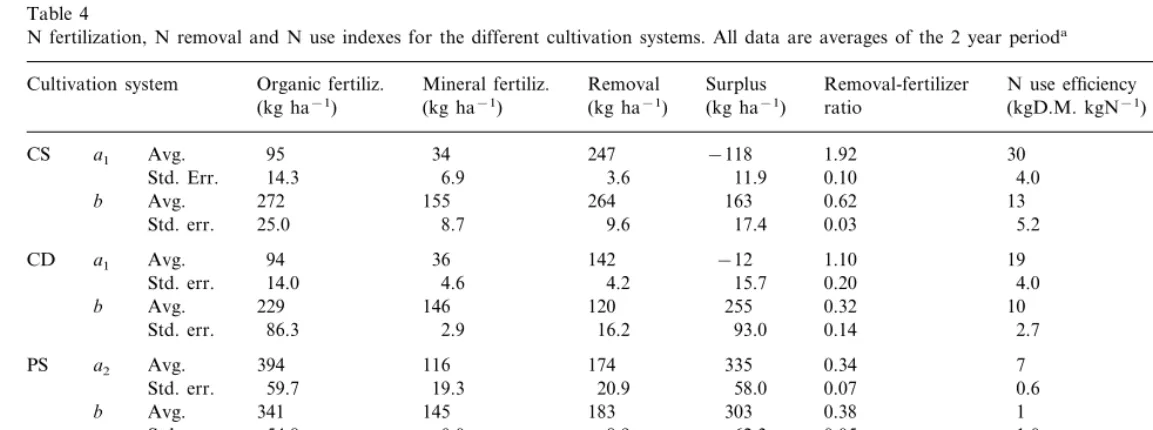
Table 4 reports the amounts of N supplied as fertilizer and N removal at harvest in the eight examined cultivation systems, as an average of 2 years, and the corresponding variability. The four indicators of the fertilizer efficiency are also re-ported in the table.
The total amount of N fertilizer supplied by the farmers was remarkably different over the cultiva-tion systems. The permanent meadows (CSa1 and CDa1) received approximately 130 kg N ha
−1
year−1, the lowest fertilization level of all the crops. N was supplied mainly as cow manure, which was spread in winter and spring, after the first cut. N removal exceeded fertilization, expe-cially at CSa1, maybe because of the N fixation, as the contribution of white clover to the sward composition was about 12%. The N apparent recovery in the meadows ranged from 19 to 30%. In all the other situations, where annual crops were cultivated, the total N inputs were remark-ably high, ranging from 369 to 509 kg N ha−1 year−1
, as has frequently been recorded in the Po plain (Borin et al., 1997). In general, organic fertilizers were applied just before soil tillage, in spring (before maize) or in autumn (before winter cereals). Only at PSb, in both years, was pig slurry spread partly in autumn and partly in spring, with spring ploughing. Another exception was maize at PD. In the first year slurry was in fact supplied in autumn 1994, and in spring 1996 in the second year, and, in both cases, ploughing followed in 1 – 2 days. The high fertilization levels in all the cropping systems resulted in a calculated surplus of 128 – 335 kg N ha−1
year−1
. The N removal-fertilization ratio ranged from 0.32 to 0.65, which is consistent with what was reported by Smith et al. (1994), while only the highest value corre-sponded to what was measured by Vetter and Lorenz (1990). The apparent recovery index showed a high variability (between 0 and 26%), which corresponded to a N use efficiency index that ranged between 1 and 13 kg of the total DM kg N−1. Schro¨der and Ten Holte (1994) reported
higher apparent N recovery values (about 10 – 39%), on silage maize fertilized with manure, as did Bocchi and Tano (1994), who found that manure fertilization produced 3 – 14 kg of maize grain per kg of manure-N.
The low values of all N efficiency indexes, also compared with literature values, have demon-strated that the examined arable crops were over-fertilized. The accumulation of nitrogen over the years led to a build up of a high soil mineraliza-tion potential, as indicated by the unfertilized plots, where the plant uptake was 117 – 209 kg N ha−1
year−1
in the meadows, and ranged from 95 to 272 kg N ha−1
year−1
in the arable crops. The maize generally tolerated the N surplus, with the exception of site PSb, where even negative appar-ent recovery indexes were recorded.
The results shown in Table 4 show that N fertilization was not modulated on the crop up-take or the crop removal, as frequently occurs in intensive livestock farming systems. The necessity of disposing of excreta cannot entirely explain the large recorded N surplus. In three situations out of four (CS, CD and PS) mineral fertilization, in fact, greatly contributed to a build up of the N surplus. Only at PD did the farmer efficiently use slurry also to top dress maize, thus reducing the mineral N input.
When compared to maize as a single crop, the combination of summer and winter crops did not modify the N removal-fertilizer ratio: at PS, be-cause both the removal and fertilizer input were similar in both situations, and at PD, because they both increased compared to maize as a single crop.
The amount of fertilization supply showed a remarkable variability, which was higher than what was measured for the crop removals. This confirmed an arbitrariness by the farmers as far as fertilization is concerned.
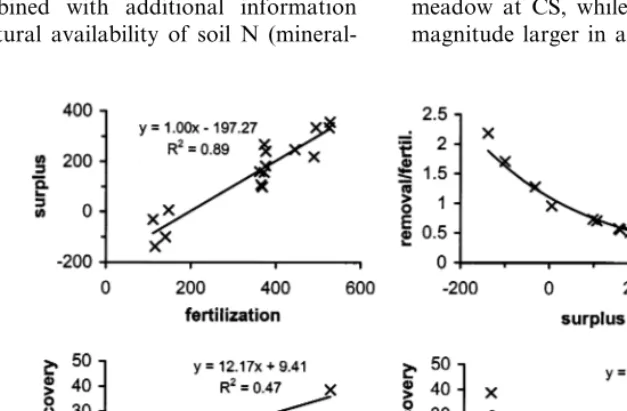
The data presented in Table 4 can be better analyzed on the basis of the relationships pro-posed in Fig. 2. These indexes are among the most used to evaluate the sustainability of crop with regard to the use of fertilizers.
C
.
Grignani
,
L
.
Za
6
attaro
/
Europ
.
J
.
Agronomy
12
(2000)
251
–
268
259
Table 4
N fertilization, N removal and N use indexes for the different cultivation systems. All data are averages of the 2 year perioda
Removal Surplus Removal-fertilizer N use efficiency Apparent recovery Cultivation system Organic fertiliz. Mineral fertiliz.
(kg ha−1) (kg ha−1) (kg ha−1) (kg ha−1) ratio (kgD.M. kgN−1) (kgN 100kgN−1)
−118 1.92 30 30
247
a1
CS Avg. 95 34
3.6 11.9 0.10 4.0 6.8
Std. Err. 14.3 6.9
264
b Avg. 272 155 163 0.62 13 26
17.4 0.03 5.2 6.1
9.6
Std. err. 25.0 8.7
a1 Avg. 94 142 −12 1.10 19 19
CD 36
4.2 15.7 0.20 4.0 8.7
Std. err. 14.0 4.6
255 0.32 10 15
120 146
229 Avg.
b
2.9 16.2 93.0 0.14 2.7 4.5
Std. err. 86.3
335 0.34 7 15
116
PS a2 Avg. 394 174
20.9 58.0 0.07 0.6 1.9
Std. err. 59.7 19.3
183
b Avg. 341 145 303 0.38 1 0
62.3 0.05 1.0 3.1
8.9 0.0
54.8 Std. err.
242
a2 Avg. 297 74 128 0.65 3 16
PD
67.1 0.11 6.0 11.9
33.3
56.0 30.3
Std. err.
197
B Avg. 358 11 171 0.54 4 17
6.4 25.6 11.2 0.03 3.6 6.3
Std. err. 37.9
aThe standard error shows the sum of spatial (between the two plots) and temporal (between the two years) variability. CS, cattle shallow, CD, cattle deep, PS,
but it is the most simple way to approach the N balance at the field scale, and therefore it is very suitable to judge fertilization management. The calculated N surplus increased linearly as the fer-tilization input increased (R2=0.89), with a break-even point at about 200 kg N ha−1 and a slope equal to one. If one excludes meadows CSa1 and CDa1, where nitrogen fixation altered the N surplus calculation, the equation did not change in practice (y=1.05x+216.92: R2=0.66). Well-managed crop systems should show both a low N surplus and an independence of the calcu-lated surplus from the fertilization level.
The same variables used to calculate the surplus index can be combined in the removal-fertilizer ratio. As expected, the two indexes were closely and inversely correlated (R2
=0.95), through an exponential function that suggests a minor varia-tion of the ratio as the surplus increases. The calculated surplus index should therefore be used to better discriminate among highly intensive sys-tems, as it is more variable when fertilization is expected to be much higher than crop removal.
Finally, the N removal and the N fertilization can be combined with additional information about the natural availability of soil N
(mineral-ization and residual mineral N) in another com-monly used index: the N apparent recovery. Fig. 2 shows that the N apparent recovery was nega-tively correlated with the nitrogen surplus — more N supplied than taken up by the crop — (R2=0.50), and positively correlated to the re-moval-fertilizer ratio (R2=0.47). Even when the N surplus was close to zero, the apparent recovery was :25%. This shows that the soils were highly
fertile and apparently provided a large share of the N necessary for the crop uptake.
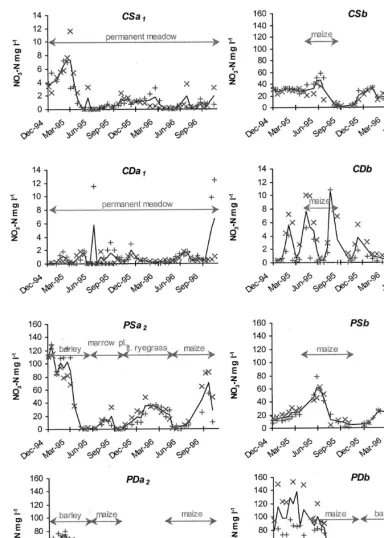
3.2. Temporal patterns of nitrogen in the soil solution
Fig. 3 shows the temporal pattern of the nitrate concentration of the soil solution extracted at a depth of 50 cm with porous cups. As it was pointed out above, this depth corresponds to the maximum extent of the active portion of roots in all the examined situations.
The nitrate-N concentration was always lower than 15 mg l−1in the permanent meadow and the maize system at CD, and in the permanent meadow at CS, while it was about one order of magnitude larger in all the other examined cases.
Fig. 2. Significant relationships between some indexes for fertilization efficiency. The calculated surplus is expressed in kg ha−1
C.Grignani,L.Za6attaro/Europ.J.Agronomy12 (2000) 251 – 268 261
Fig. 3. Temporal patterns of NO3-N in the soil solution extracted by porous cups at a 50 cm depth. The two plots are indicated
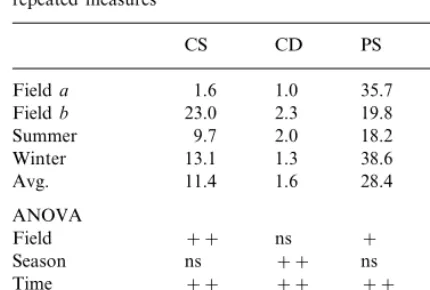
Table 5
Average NO3-N concentration of the soil solution extracted at
a 50 cm depth and results of the analysis of variance for repeated measures
Fieldb 23.0 52.0
2.0 18.2
9.7 29.2
Summer
1.3
Winter 13.1 38.6 53.1
1.6 28.4
Field×season ns ns
ization (Cavazza et al., 1986; Grignani and Acutis, 1994). In this trial the effect of spring mineralization on the nitrate concentration was not clearly distinguishable from the increase due to nitrogen fertilizer supply in combination with tillage. When the organic fertilizer was applied in autumn and ploughed in, the soil nitrate concen-tration resulted to be remarkably higher than following autumn applications without ploughing. Examples of the former case were found in PSa2, PDa2 and PDb in winter 1994 – 1995, while an example of the latter was found in PSb for both winters.
In the meadows the rather scarce surface N applications did not produce any concentration peaks, although values higher than the average, ranging from 2 to 8 mg l−1, were recorded in CSa1 in winter 1994 – 1995, after a cattle slurry application of about 110 kg N ha−1.
3.3. Factors affecting the nitrate concentration of the soil solution
The nitrate concentration of the soil solution was affected by the cultivation system in shallow soils (CS and PS), as Table 5 reports. The ‘field’ effect should be regarded as the sum of the effects of the crop physiology and the agricultural prac-tices to the crop, including the time and amount of fertilizer applications, the amount of irrigation, tillage, crop duration, etc.. The concentration in the permanent meadow (a1) was smaller than in the maize (b) at CS, whereas the multiple crop-ping system (a2) involved higher concentrations than maize as a single crop (b) at PS, which is consistent with what was observed concerning the N fertilizer surplus and efficiency (Table 4).
The average concentration in winter resulted to be significantly higher than in summer only in PD (+23.9 mg NO3-N l−1
). The opposite trend was observed in CD (although the difference was only 0.7 mg NO3-N l
−1), while in the other situations
the seasonal differences were not significant, prob-ably also as a consequence of the large variability over the years. Moreover, in three out of four sites the response of the two cultivation systems to the seasonal effect was similar (non-significant ‘field×season’ interaction), while in CD the inter-Even though at low concentrations, in CD in the
maize-cropped field (CDb) the soil nitrate content showed temporal and seasonal variations, while in the meadow (CDa1) it was more buffered.
The ammonium-N variations were limited over the situations (data not shown). The average value was, in all cases, smaller than 2 mg l−1
and less than 1% of the data exceeded 4 mg l−1
. A higher NH4-N concentration was recorded in the three situations where the nitrate concentration was lower (CSa1, CDa1and CDb), but no signifi-cant relationship was found between the NO3-N and NH4-N concentrations. These data confirm what was found by Decau (1997) concerning fre-quent high ammonium concentrations in meadows.
mineral-C.Grignani,L.Za6attaro/Europ.J.Agronomy12 (2000) 251 – 268 263
action was significant owing to the higher buffer capacity of the meadow compared to maize, but once again with differences of scarce practical importance. Date by date, the concentration in the two systems was different in all the sites (significant ‘time’ effect), and temporal patterns were not parallel (significant ‘field×time’ interac-tion).
The concentration in shallow soils seemed to be more reactive to crop and tillage effects than deep soils monitored at the same depth, where soil and seasonal effects prevailed. The duration of the crop cover did not necessarily reduce the average soil nitrate concentration, however seasonal varia-tions resulted to be somewhat buffered. On the contrary, several authors have observed that the soil cover during winter reduced the soil nitrate content and smoothed variations over the years (e.g. Ru¨egg et al., 1998). Weather conditions pre-sented in Table 2 might help in explaining our results. The crop uptake is limited by cold winter conditions. The summer evapotranspiration is of-ten inof-tense and the severely depleted soil water reservoirs are only partially replenished by
au-tumn and winter rainfalls. Therefore, the drainage period is often unpredictable and in winter solute movement within the soil is slow. In both mead-ows examined in this study the soil nitrate content was low and buffered over time, as in the cases examined by Smith et al. (1990), and Grignani and Acutis (1994) for grass and lucerne leys, compared to continuous maize rotation and Ital-ian ryegrass-maize double cropping. However, in none of the examined meadows was the N surplus as high as in the maize. It would therefore be interesting to monitor meadows with higher nitro-gen inputs.
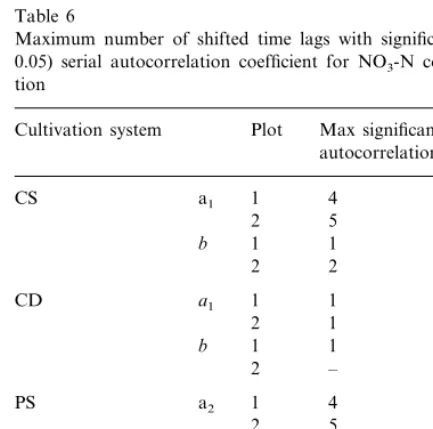
To confirm that the soil cover duration was a stabilizing factor on the soil solution concentra-tion, an approximated time series analysis was performed on data, and a serial correlation coeffi-cient was calculated. The shape of the autocorre-lation function, with an exponential decay and damped sine waves, suggested an autoregressive generating process in all cases (Box et al., 1994). Table 6 reports the level of autocorrelation for the NO3-N concentration in the time series. In all the cases, the longer extent of the autocorrelation period in cultivation systems a compared to sys-tems b, showed that the buffer capacity for min-eral nitrogen was higher where a crop was present during the whole recording period. Instead, in PD the high autocorrelation in the concentration time series, found in both fields, could be due to the buffering capacity of the shallow water table (about 1 m deep).
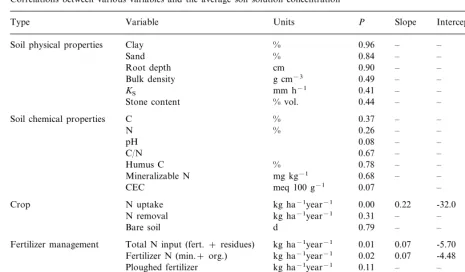
In order to test whether various soil and man-agement factors could influence the nitrate con-centration of the soil solution, averaged over the 2-year period, simple correlation coefficients were calculated, and are reported in Table 7. The soil mineral N concentration was correlated with the overall fertilizer input (R2
=0.33); the total N supply, namely fertilizer and residues of the pre-ceding crop (R2
=0.42); and the crop uptake (R2
=0.51). This correlation would suggest that every kg of N input produced an increase in the concentration of 0.07 mg NO3-N l
−1, and that
every mg NO3-N l
−1produced an increase in the
crop uptake of 2.3 kg ha−1year−1. However, none of the soil characteristics and the examined fertilizer efficiency indexes proved to be
signifi-Table 6
Maximum number of shifted time lags with significant (PB 0.05) serial autocorrelation coefficient for NO3-N
concentra-tion
Plot
Table 7
Correlations between various variables and the average soil solution concentrationa
Units
Type Variable P Slope Intercept R2
% 0.96
Soil physical properties Clay – – –
%
Sand 0.84 – – –
cm 0.90 –
Root depth – –
g cm−3 0.49 – –
Bulk density –
mm h−1 0.41 –
KS – –
% vol. 0.44 – – –
Stone content
% 0.37
Soil chemical properties C – – –
N % 0.26 – – –
pH 0.08 – – –
0.67 –
C/N – –
Humus C % 0.78 – – –
mg kg−1 0.68 –
Mineralizable N – –
meq 100 g−1 0.07 –
CEC –
kg ha−1year−1 0.00
Crop N uptake 0.22 -32.0 0.51
kg ha−1year−1 0.31
N removal – – –
d 0.79 –
Bare soil – –
Fertilizer management Total N input (fert.+residues) kg ha−1year−1 0.01 0.07 -5.70 0.42
kg ha−1year−1 0.02 0.07 -4.48
Fertilizer N (min.+org.) 0.33
kg ha−1year−1 0.11 –
Ploughed fertilizer – –
Fertilizer efficiency Calculated surplus kg ha−1 0.08 – – –
0.06 – –
Removal/fertilizer –
kgN 100 kgN−1 0.38 – – –
Apparent recovery
aThe number of cases is 16.
cantly correlated to the NO3-N soil content. This shows that, in intensive farming, the soil mineral N concentration results from a great number of interacting factors, and simple relationships are not sufficient to predict the risk of N leaching.
A multiple regression approach yielded better results, as Table 8 reports. The average nitrate concentration was positively correlated to the plant N uptake (as was reported by Brandi-Dohrn et al., 1997), indicating that crops take advantage of a higher N content in easily-available water extracted using porous cups. The relation was inverse for the removal-fertilizer ratio (the larger the fertilizer excess, the higher the concentration), as well as for the soil pH and sand content. As the soil biological processes are promoted in sub-al-kaline conditions, the relationship to the soil pH could indicate that a high microbial activity in synthetizing organic compounds is effective in maintaining mineral N concentrations low. The
inverse relationship to the sand would suggest that the soil mineral N content is lower where the permeability and drainage capacity are higher.
Although these results may serve only as an empirical tool and they do not lead to a mechanis-tic interpretation, they indicate that, in the
follow-Table 8
Coefficients of the multiple regression model. Standardized coefficients allow comparisons between variables in different unitsa
bstandardiz. Adj.R2
B coefficient Variables
146.09 (Constant)
0.18
N uptake 0.58 0.480
N −19.09 −0.56 0.643
removal-fertil izer ratio
−19.60
pH −0.42 0.739
−0.43
Sand −0.32 0.848
C.Grignani,L.Za6attaro/Europ.J.Agronomy12 (2000) 251 – 268 265
Table 9
Nitrogen leaching as predicted with the LEACHM model in the December 1994–December 1996 period (modified from Zavattaro, 1998).
Cultivation system NO3-N leaching (kg ha−1)
1995 1996
CS a1 0 4
35 56
b
CD a1 0 2
b 0 3
10
PS a2 61
37 64
b
−10
PD a2 21
b −4 10
while in 1996 the opposite occurred, but on the medium period these two processes were almost balanced. The variability in leaching amounts be-tween the two years was large (the coefficient of variation was only smaller than 100% in CSband PSb), expecially where capillary rise movements were remarkable.
The poor relationship between the average ni-trate concentration of the soil solution and leach-ing (R2
=0.05, ns), mainly due to the importance of the capillary rise in the examined situations, confirmed that the mineral N content of the soil is only an indicator of potential leaching, and that losses can be evaluated only when both compo-nents are assessed. However, the mean concentra-tion of pollutants in the groundwater recharge is of great interest, as, in the long term, the ground-water assumes the same concentration as its recharge (Brandi-Dohrn et al., 1997).
4. Conclusions
Several authors have pointed out that the re-lease of nutrients from cropped fields to the envi-ronment can only be minimized by increasing fertilizer efficiency (Smith et al., 1990). The survey presented here on agricultural practices actually adopted by farmers in intensive forage systems in the Po plain has shown that the possibilities of increasing fertilizer efficiency in real situations are remarkable. In particular, this target can be achieved through a reduction of the overall amount of fertilizer and a better synchronization between the time of application and the require-ments of the crop.
In the examined situations, the total amount of N supplied to the crops was large and abundantly exceeding the crop removal. The main source of N supply was that of organic fertilizers, but in most cases additional chemical fertilizers were applied, in particular as top dressing. The manure and slurry spreading times were often dictated by the necessity of simplifying the farm labour orga-nization, rather than modulated to the crop re-quirements. Consequently, great amounts of N were not recovered, thus enhancing the risk of N ing order, crop, management, soil chemical/
micro-biological, and physical factors are all important to predict the soil solution concentrations. How-ever, most of the variability in the regression was explained by the ‘N uptake’ factor. This would suggest that the practices that have been adopted in the examined situations to improve crop pro-duction through nitrogen, resulted in an increase of the soil mineral N content all year round.
3.4. Nitrogen leaching
losses. In particular, surface applications of ma-nure and slurry, not followed by ploughing, seemed not to increase the concentration of the soil water, but caused remarkable losses as volatile compounds (Zavattaro, 1998), while au-tumn applications followed by tillage determined a remarkable increase in the mineral N content of the soil, for several months after spreading.
The efficiency indexes obtained from a com-parison of the fertilizer inputs, crop N removal and apparent recovery, and their relationships, can be used to elaborate a N balance sheet useful to propose a more efficient fertilization manage-ment. If, for instance, the surplus were reduced to 50 kg N ha−1, according to the exponential rela-tion reported in Fig. 2, the N removal-fertilizer ratio would be 91% and the N apparent recovery index 23%. However, in our environmental condi-tions such indexes were not correlated to the soil nitrate content, because of the influence of several other parameters.
Only qualitative and non-explanatory relations were found between the soil water nitrate content and soil and management factors. Moreover, the nitrate concentration might not be as effective as in other environments to predict leaching in the short term (Powlson et al., 1986), due to the importance of the capillary rise in the water bal-ance of the examined soils. Leaching did not often result to be as high as expected from the high measured nitrate concentrations in the soil.
The weak relation between the N concentration and fertilizer supply confirmed what has been found by other authors (such as Macdonald et al., 1989; Kengni et al., 1994), who reported that fertilizer N represented only a small fraction of the residual N of the soil, compared to that derived from mineralization. This would suggest that the effects of fertilization practices on the concentration were indirect, and mediated by the crop and soil characteristics.
The nitrate concentration fluctuated over the seasons without any predictable pattern. The indi-cations that autumn is a critical period for leach-ing, owing to a concentration peak occurring after harvest (Kengni et al., 1994; Van der Ploegh et al., 1995, among others), and that spring crops in-crease the risk of autumn leaching (Jenkinson,
1986), were therefore not confirmed in this study. The observations by Borin et al. (1997), also confirmed that in the Po plain conditions no difference exists in most situations between the amount of nitrogen released during the bare soil period and during the maize growing period. The soil cover during winter was not important to reduce N leaching owing to climatic conditions (low temperature and dry soil during winter), however a long permanence of plants assured a certain buffer capacity on temporal variations of the mineral N content of the soil. Rather than reduce the N content of the soil, plants took advantage of high concentrations, consequently the plant uptake resulted to be positively corre-lated to the N content of the soil. A difference was found between the response of shallow and deep soils to external agents: in the former, crop and tillage factors influenced the N concentration, while in the latter season and soil factors pre-vailed. The presence of a shallow water table in the profile was effective in smoothing temporal variations, and the capillary rise during summer remarkably reduced the net leaching amount in the medium and long terms.
C.Grignani,L.Za6attaro/Europ.J.Agronomy12 (2000) 251 – 268 267
Acknowledgements
The authors would like to thank the staff of the Soil Division of IPLA for the soil pedological analyses, and the referees for their valuable sug-gestions. This research was funded by the Regione Piemonte – Assessorato Ambiente.
References
Aarts, H.F.M., Biewinga, E.E., Van Keulen, H., 1992. Dairy farming systems based on efficient nutrient management. Neth. J. Agri. Sci. 40, 285 – 299.
Armstrong, A.C., Burt, T.P., 1993. Nitrate losses from agricul-tural land. In: Burt, T.P., Heathwaite, A.L., Trudgill, S.T. (Eds.), Nitrate: Processes, Patterns and Management. John Wiley and Sons, Chichester, England, p. 445.
Benoit, M., 1994. Risque de pollution des eaux sous prairie et sous culture: influence des pratiques d’apport d’engrais de ferme. Fourrages 140, 407 – 420.
Benoit, M., Saintot, D., Gaury, F., 1995. Mesures en parcelles d’agriculteurs des pertes en nitrates. Variabilite´ sous divers syste`mes de culture et mode´lisation de la qualite´ de l’eau d’un bassin d’alimentation. CR Acad. Agric. Fr. 81 (4), 175 – 188.
Bocchi, S., Tano, F., 1994. Effects of cattle manure and components of pig slurry on maize growth and production. Eur. J. Agron. 3 (3), 235 – 241.
Borin, M., 1997. Effects of agricultural practices on nitrate concentration in groundwater in north east Italy. Ital. J. Agron. 1 (1), 47 – 54.
Borin, M., Giupponi, C., Morari, F., 1997. Effects of four cultivation systems for maize on nitrogen leaching. 1. Field experiments. Eur. Jour. Agron. 6, 101 – 112.
Box, G.E., Jenkins, G.M., Reinsel, G.C., 1994. Time series analysis: Forecasting and control. Prentice Hall, Engle-wood Cliffs, NJ, p.598.
Brandi-Dohrn, F.M., Dick, R.P., Hess, M., et al., 1997. Ni-trate leaching under a cereal rye cover crop. J. Environ. Qual. 26, 181 – 188.
Camussi, A., Mo¨ller, F., Ottaviano, E., Sari Gorla, M., 1995. Metodi statistici per la sperimentazione biologica, 2nd ed. Ed. Zanichelli, Bologna, Italy.
Cavazza, L., Patruno, A., Pistelli, E., 1986. Variazione del contenuto di azoto nitrico del terreno. Influenza della lavorazione, della coltura e del decorso meteorico. Riv. Agron. 20 (2 – 3), 204 – 217.
Cuttle, S.P., 1997. Nitrogen budges for an organic dairy farm. In: Jarvis, S.C., Pain, B.F. (Eds.), Gaseous nitrogen emis-sions from grasslands. CAB International, Oxon, UK, pp. 413 – 415.
David, M.B., Gentry, L.E., Kovacic, D.A., Smith, K.M., 1997. Nitrogen balance in and export from an agricultural water-shed. J. Environ. Q. 26, 1038 – 1048.
Decau, M.L., 1997. Flux d’azote en prairies pature´es par des bovins: de l’etude du compartiment mineral et de la lixivia-tion a` la modelisalixivia-tion de l’ensemble du syste´me. Ph.D. thesis, University of Caen, p. 121.
Decau, M.L., Le Corre, S., 1992. A drained plot study of the impact of cutting and/or grazing management and N fertil-ization on nitrate leaching under grassland. In: Proceedings of the 15th General Meeting of EGF. Wageningen, The Netherlands, pp. 213 – 217.
Diggle, P.J., Liang, K.-Y., Zeger, S.L., 1994. Analysis of Longitudinal Data. Oxford University Press, Oxford, USA, p. 253.
Drury, C.F., Tan, C.S., Gaynor, J.D., Oloya, T.O., Welacky, T.W., 1996. Influence of controlled drainage-subirrigation on surface and tile drainage nitrate loss. J. Environ. Qual. 25, 317 – 324.
Grignani, C., 1996. Influenza della tipologia di allevamento e dell’ordinamento colturale sul bilancio di elementi nutritivi in aziende padane. Riv. Agron. 30 (3 suppl.), 414 – 422. Grignani, C., and Acutis, M., 1994. Organic fertilization
effi-ciency and nitrogen leaching in maize based forage sys-tems. Proceedings of the 3rd ESA Congress, Abano, Italy, pp. 804 – 805.
Grignani, C., Acutis, M., Reyneri, A., Cavallero, A., Lom-bardi, G., 1996. Flussi di azoto da colture foraggere nel-l’areale padano: interazioni con la tipologia di suolo. Riv. Agron. 30 (3 suppl.), 339 – 349.
Grignani, C, Zavattaro, L., Petrella, F., Piazzi, M., 1998. Confronto tra metodi per la valutazione dell’attitudine dei suoli allo spandimento dei liquami zootecnici. Riv. di Agron 32, 244 – 252.
Grossman, J., Udluft, P, 1991. The extraction of soil water by the suction-cup method: a review. J. Soil Sci. 42, 83 – 93. Guillard, K., Griffin, G.F., Allinson, D.W., et al., 1995.
Nitrogen utilization of selected cropping systems in the US northeast. I. Dry matter yield, N uptake, apparent N recovery, and N use efficiency. Agron. J. 87, 193 – 199. IPLA, 1984. Metodi Analitici: Fertilizzanti Organici,
Com-post, Fanghi Degli Impianti di Depurazione, Rifiuti Or-ganici, Substrati in Fermentazione Metanica, Biogas. IPLA, Torino, Italy.
Jarvis, S.C., 1993. Nitrogen cycling and losses from dairy farms. Soil Use Manag. 9, 99 – 105.
Jenkinson, D.S., 1986. Nitrogen in UK arable agriculture. J. R. Agric. Soc. Engl. 147, 178 – 189.
Juergens-Gschwind, S., 1989. Ground water nitrates in other developed countries (Europe) — relationship to land use patterns. In: Follett, R.F. (Ed.), Nitrate management and ground water protection. Elsevier, New York, USA, pp. 75 – 138.
Jury, W.A., Flu¨hler, H., 1992. Transport of chemicals through soil: mechanisms, models, and field applications. Adv. Agr. 47, 142 – 201.
Lewan, E., 1994. Effects of a catch crop on leaching of nitrogen from a sandy soil: simulations and measurements. Plant Soil 166, 137 – 152.
Macdonald, A.J., Powlson, D.S., Poultun, P.R., Jenkinson, D.S., 1989. Unused fertiliser nitrogen in arable soils — its contribution to nitrate leaching. J. Sci. Food Agric. 46, 407 – 419.
Pardini, G., Volterrani, M., Grossi, N., Miele, S., Gaetani, M., 1995. L’ammendamento del terreno con torba lacustre: influenza su lacune caratteristiche fisiche e sulla liscivi-azione dell’azoto. Riv. Agron. 29 (3 suppl), 499 – 506. Patruno, A., 1987. Dilavamento dell azoto nitrico e perdita
nelle acque di drenaggio. Irr. Dren. 34 (1), 37 – 43. Poss, R., Noble, A.D., Dunin, F.X., Reyenga, W., 1995.
Evaluation of ceramic cup samplers tp measure nitrate leaching in the field. Eur. J. Soil Sci. 46, 667 – 674. Powlson, D.S., Hart, P.B.S., Pruden, G., Jenkinson, D.S.,
1986. Recovery of15N-labelled fertilizer applied in autumn
to winter wheat at four sites in eastern England. J. Agric. Sci. Camb. 107, 611 – 620.
Richter, G.M., Beblik, A.J., Schmalstieg, K., Richter, O., 1998. N-dynamics and nitrate leaching under rotational and continuous set-aside-a case study at the field and catchment scale.’’ Agric. Ecos. Envir. 68, 125 – 138. Ru¨egg, W.T., Richner, W., Stamp, P., Feil, B., 1998.
Accumu-lation of dry matter and nitrogen by minimum tillage silage maize planted into winter cover crop residues. Eur. J. Agron. 8, 59 – 69.
Schepers, J.S., Fox, R.H., 1989. Estimation of N budgets for crops. In: Follett, R.F. (Ed.), Nitrate management and ground water protection. Elsevier, New York, USA, pp. 221 – 246.
Scholefield, D., Tyson, K.C., Garwood, E.A., Armstrong, A.C., Hawkins, J., Stone, A.C., 1993. Nitrate leaching from grazed grassland lysimeters: effects of fertilizer input, field drainage, age of sward and patterns of weather. J. Soil Sci. 44, 601 – 613.
Schro¨der, J., Ten Holte, L., 1994. Manure placement effects on silage maize. Anim. Waste Manag 7th Tech. Consult. ESCORENA Netw. FAO REUR Tech. Ser. 34, 183 – 189. Shaffer, M.J., Hall, M.D., Wylie, B.K., Wagner, D.G., 1996. NLEAP/GIS approach for identifying and mitigating re-gional nitrate-nitrogen leaching. In: Corwin, D.L., Loague, K. (Eds.), Applications of GIS to The Modeling of Non-point Source Pollutants in the Vadose Zone. Soil Science
Society of America, Madison, WI, USA, p. 319 Special Publ. no. 48.
Simon, J.C., Le Corre, L., Verte`s, F., 1994. Nitrogen balances on a farm scale: results from dairy farm in North West France. Proceedings of the 15th General Meeting of EGF, Wageningen, The Netherlands, pp. 429 – 433.
Smith, S.J., Schepers, J.S., Porter, L.K., 1990. Assessing and managing agricultural nitrogen losses to the environment. Adv. Soil Sci. 14, 1 – 32.
Smith, K.A., Chambrs, B.J., Jackson, D.R., 1994. Utilization of slurry and solid manure nitrogen in arable cropping rotations: Animal Waste Management, 7th Technical Con-sultation ESCORENA Network, FAO REUR. Tech. Ser. 34, 157 – 163.
Stanford, G., Smith, S.J., 1978. Oxidative release of potentially mineralizable soil nitrogen by acid permanganate extrac-tion. Soil Sci. 126, 210 – 218.
Van der Ploegh, R.R., Ringe, H., Machulla, G., 1995. Late fall site-specific soil nitrate upper limits for groundwater pro-tection purposes. J. Environ. Qual. 24, 725 – 733. Van der Werff, P.A., Baars, A., Oomen, G.J.M., 1994.
Nutri-ent balances and measuremNutri-ent of nitrogen loss on mixed ecological farms on sandy soils in the Netherlands. Biol. Agri. Hortic. 11, 41 – 50.
Vereijken, P., 1997. A methodical way of prototyping inte-grated and ecological arable farming systems (I/EAFS) in interaction with pilot farms. Eur. J. Agron. 7, 235 – 250. Verte´s, F., Decau, M.L., 1992. Suivis d’azote mineral dans le
sol: risque de lessivage de nitrate selon le couvert ve´ge´tal. Fourrages 129, 11 – 28.
Vetter, H., Lorenz, F., 1990. Efficient slurry fertilization. Recent Dev. Anim. Waste Util. Consult. Eur. Coop. Res. Netw. FAO REUR Tech. Ser. 17, 249 – 259.
Vianelli, S., 1959. Prontuari per Calcoli Statistici: Tavole Numeriche e Complementi. Ed. Calderini, Bologna, Italy. Webster, C.P., Shepherd, M.A., Goulding, K.W.T., 1993. Comparison of methods for measuring the leaching of mineral nitrogen from arable land. J. Soil Sci. 44, 49 – 62. Weissbach, F., Ernst, P., 1994. Nutrient budgets and farm management to reduce nutrient emissions. Proceedings of the 15th General Meeting of EGF, Wageningen, The Netherlands, pp. 343 – 360.
Zavattaro, L., 1998. Assessing Water and Nitrogen Dynamics in Various Soils and Forage Crops: Measurements and Simulations. Ph.D thesis, University of Torino. p. 130.
.