Efficiency of grain production of winter wheat as affected
by N fertilisation under particular consideration of single
culm sink size
E. Sticksel *, F.-X. Maidl, F. Retzer, J. Dennert, G. Fischbeck
Technische Uni6ersita¨t Mu¨nchen,Lehrstuhl fu¨r Pflanzenbau und Pflanzenzu¨chtung,Alte Akademie12, 85350Freising-Weihenstephan,Germany
Received 3 December 1999; received in revised form 5 April 2000; accepted 28 April 2000
Abstract
Grain yield and yield components of winter wheat were recorded during 2-year field trials in Southern Bavaria, Germany. The impact of single ear sink size on the efficiency of grain production was studied in plants differing in single ear weight. While total grain yield showed only slight differences between N fertiliser treatments, significant variations were detected in harvest index and N harvest index. For single culms, a decrease in ear weight was related to decreasing values of harvest index and N harvest index. This correlation could not be altered by means of N fertilisation. The most efficient grain production, i.e. high value of harvest index and N harvest index, was regularly recorded in plant stands developing large single ear weights. The study confirms that with increasing sink size, the efficiency of grain production in winter wheat is improved. A N fertilisation strategy, favouring the formation of a large sink size, is described. In this respect, lower N rates in early spring and emphasis on N fertilisation during stem elongation proved to be decisive. This strategy favoured the generative growth at the expense of vegetative growth without excessively decreasing the corresponding source size. © 2000 Elsevier Science B.V. All rights reserved.
Keywords:Winter wheat; Nitrogen; Grain yield; Harvest index; N harvest index; Sink size
1. Introduction
Improving the efficiency in wheat production is dependant on increasing grain yield while simulta-neously maximising harvest index (HI) and N harvest index (NHI). Different opinions exist
re-garding the impact of N fertilisation strategy on HI and NHI. This is perhaps not surprising be-cause of the influence environment exerts on plant growth and yield formation. Nevertheless, there is broad agreement that excess N application causes a decline in both HI and NHI (Austin et al., 1993; Webb et al., 1998). Hay (1995) reported that, up to the optimum rate, N application has little effect on HI. Peltonen (1992) stated that there was no indication that the timing of nitrogen application
* Corresponding author. Tel.:+49-81-61713488; fax:+ 49-81-61714511.
E-mail address:[email protected] (E. Sticksel).
Table 1
Amount and timing of N fertiliser in winter wheat
Early spring EC 30 EC 32 EC 47
Treatment Total N applied (kg N per ha)
40 30
N1 110 – 40
N2 110 40 – 30 40
70
N3 140 30 – 40
70 30
170 30
N4 40
could affect HI. In contrast to this, in long-term field trials Fischbeck et al. (1993), Diepolder (1994) demonstrated that a low start N dressing together with emphasis on N fertilisation during stem elongation regularly led to high grain yield and high HI and NHI. These results were confi-rmed by Maidl et al. (1998).
The objective of this study was to examine the interrelation between N fertiliser applications dif-fering in amount and timing, and yield formation of winter wheat. Particular attention was paid to the detailed analysis of single culms with varying ear weights.
2. Material and methods
2.1. Trial site
Field trials were conducted at Technical Uni-versity of Munich’s research station ‘Roggenstein’ in the Northern Munich gravel plain during the 1991 and 1992 growing seasons. The soil was a sandy loam with a profile depth of 65 cm above gravel material. The C/N ratio in the plough layer was 11.5 with Corg=14.9 mg g−1, values for
CAL-P2O5 and CAL-K2O (mg 100 g−1 dry soil)
were 10 and 30, respectively.
2.2. Management and layout of the field trials
In both the years, sowing took place on 10 October under favourable conditions. The seed rate (cv. Ares) was 400 kernels per m2. Plant
protection was applied as necessary. Except for plant residues, no organic fertiliser was used dur-ing the last 15 years. The preceddur-ing crop for the first trial year was oat, with a grain N balance of approximately 0 kg N per ha. The preceding crop in the second year was rape, with a N surplus of +100 kg N per ha.
Experimental layout was a completely ran-domised block design with four replications, each plot 30 m2 in size. Treatments were divided into
double plots, one-half was used for sampling, the second for final harvest at grain maturity. Four fertilisation treatments with varying N rates and N timings were compared (Table 1). Developmen-tal stages (EC stages) were determined according to the scheme of Tottman (1987).
2.3. Growing conditions during trial periods
The weather conditions during the 1991 and 1992 growing periods are presented in Table 2. In both the years, the beginning of the growing period coincided with the three-leaf stage. Above
Table 2
Monthly precipitation (P, mm) and mean air temperature (T, °C) during the growing periods 1991 and 1992 (deviation from long-term mean in parenthesis)
May June July
March April
163.7 (+55.0) 129.1 (+50.6)
38.9 (−25.2) 85.2 (−17.5)
37.1 (−13.8) P(1991)
9.4 (−2.6) 14.8 (−0.2)
T(1991) 6.1 (+2.2) 7.1 (90) 19.5 (+1.8)
97.8 (−4.9)
114.7 (+63.8) 144.3 (+35.6)
P(1992) 68.4 (+4.3) 2.8 (−75.7)
16.3 (+1.3) 14.5 (+2.5)
7.5 (+0.4) 4.5 (+0.6)
average temperatures in March 1991 were fol-lowed by average temperatures during tillering along with a low amount of rainfall (Table 2). During stem elongation, cool and moist weather conditions restrained plant development and the supply of soil borne nitrogen. The transition into the second node stage was delayed consequently.
Grain filling occurred under favourable
conditions.
In 1992, the tillering phase was prolonged be-cause of moist and cool weather conditions. Ris-ing temperatures at the end of April compensated for retarded plant development and simulta-neously enhanced nitrogen supply from the soil. High temperatures and very low rainfall in May markedly restricted vegetative plant development. Sufficient rainfall in June led to favourable condi-tions for yield formation during the subsequent growth period.
In both seasons, NO3– N leaching losses were
calculated according to a method described by Riess (1993). In 1991, leaching was negligible, whereas in 1992 about 20 kg NO3 – N per ha were leached out during tillering (end of March).
2.3.1. Grain yield and yield components
Grain yield was determined on 15 m2
plots with a plot combine and corrected to 86% dry matter content. Yield components (ears per m2, grains
per ear, 1000 grain weight, N in the grain, N in the straw) were recorded on 0.2 m2(1991) and 0.4
m2 (1992) subplots. HI was calculated as grain
yield divided by total above-ground dry matter production. Total N concentration of oven-dried samples was determined by Kjeldahl analysis. NHI was calculated as N uptake in grain divided by total above-ground N uptake in biomass.
2.4. Detailed analysis of culms differing in single ear weight
The detailed analysis was carried out on wheat plants taken from 0.1 m2(1991) and 0.2 m2(1991)
subplots at EC 92. Culms were divided into three categories according to their single ear weight. The grades were, ears, \2; 1 – 2; and B1 g. Within these categories, ears per m2, grain yield,
straw yield, grains per ear, 1000 grain weight, and
N content in grain and straw were measured. In addition, HI and NHI were calculated.
2.5. Statistical analysis
Statistical analysis was carried out with the statistical package SPSS (SPSS, 1993). Analysis of variance was carried out with the procedure UNI-VARIATE. The Tukey-B-test was used for the comparison of mean values.
3. Results
3.1. Grain yield and yield components
Though grain yield differed between trial years, there was no significant interaction between year and N fertiliser treatment. On average, over 2 years, the grain yield ranged from 10.26 t ha−1
(N1) to 10.82 t ha−1 (N4) (Table 3). Differences
between the fertilised treatments were statistically not significant. Nevertheless, there were signifi-cant variations in yield component values. While N3 and N4 were characterised by high plant densities, N2 produced maximum number of grains per ear. A high 1000 grain weight was recorded in N1 and N2 thus leading to above average single ear yields (N1, 2.08 g per ear; and N2, 2.34 g per ear), thus compensating for low plant density. In addition, significant differences were observed in HI and NHI. Lowest values were computed for N4 (HI, 0.505; and NHI, 0.769) receiving 170 kg N per ha which was the highest amount of fertiliser N. Maximum values for HI and NHI were attained in N1 and N2 receiving 110 kg N per ha each. The significant difference between N1 and N2 was due to varia-tions in timing of split N doses.
Table 3
Grain yield and yield components as affected by N fertiliser treatment (values followed by different letters are significantly different atP=0.05)
N2 N3
Treatment N1 N4
110
N amount (kg N per ha) 110 140 170
Grain yield (t ha−1) 10.26 10.46 10.76 10.82
Plant density (ear per m2) 495 b 448 b 573 a 573 a
49.3 a 42.2 b
44.1 b 44.8 b
Kernel number per ear
47.2 a
1000 Grain weight (g) 47.5 a 44.7 b 42.3 c
2.08 b
Single ear yield (g) 2.34 a 1.88 c 1.89 c
216.5 bc 231.4 ab
207.3 c 247.1 a
N uptake grain (kg N per ha)
20.2 b
Grain N content (mg g−1) 20.7 b 21.6 ab 22.9 a
0.578 a 0.517 c
0.546 b 0.505 d
Harvest index
0.862 a 0.799 c 0.769 d
N harvest index 0.841 b
3.2.Yield formation as affected by single ear weight
Single ear weight was analysed in detail in order to assess the cause of the differences in efficiency of yield formation and N uptake as affected by N fertiliser treatment. First, yield performance in relation to single ear weight will be discussed. Second, yield formation and N uptake as affected by N fertilisation will be described.
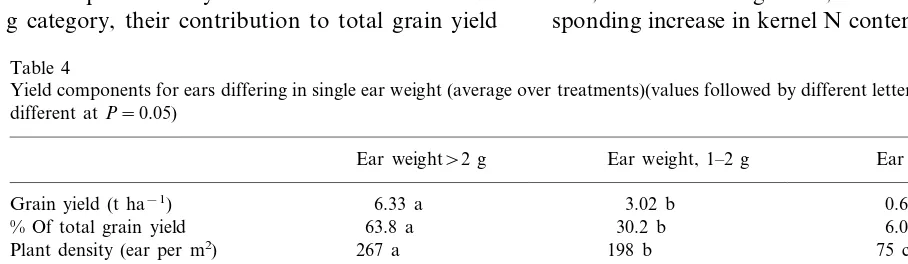
Ears\2 g made up for most of total grain yield (6.33 t ha−1 or 63.8%), this being a result of the
high contribution of plants in this ear category to total plant density (267 ears per m2
or 49.9%) (Table 4). As a result of the lower absolute and relative plant density of ears in the 1 – 2 and B1 g category, their contribution to total grain yield
declined sharply. It was remarkable that the rela-tive contribution of earsB1 g to plant density (13.8%) was nearly twice as high as their relative contribution to grain yield (6.0%), indicating a lower efficiency of grain production in small ears. This resulted in declining values of HI (Table 4). The differences in single ear weight were mainly due to differences in kernel number per ear (Table 4). In contrast, variations in 1000 grain weight were negligible. N content of kernels and straw only varied slightly between \2 and 1 – 2 g ear category, while small ears (B1 g) reached maxi-mum N contents in kernels (23.5 mg g−1) and
straw (6.6 mg g−1
). It should be emphasised that the increase of N content in the straw of small ears, relative to large ears, exceeded the corre-sponding increase in kernel N content. This
obser-Table 4
Yield components for ears differing in single ear weight (average over treatments)(values followed by different letters are significantly different atP=0.05)
Ear weight, 1–2 g Ear weightB1 g Ear weight\2 g
6.33 a
Grain yield (t ha−1) 3.02 b 0.60 c
% Of total grain yield 63.8 a 30.2 b 6.0 c
Plant density (ear per m2) 267 a 198 b 75 c
49.9 a
% Of total plant density 36.3 b 13.8 c
52.5 a 17.8 c
Kernel number per ear 34.8 b
44.9 44.3
1000 Grain weight (g) 45.4
Grain N content (mg g−1) 20.4 b 20.6 b 23.5 a
Straw N content (mg g−1) 5.1 b 4.7 b 6.6 a
Harvest index 0.514 a 0.499 a 0.430 b
vation suggests, that in small ears, nitrogen was transferred less efficiently from straw to kernels. Therefore, NHI for earsB1 g was 0.762, being significantly lower than for ears 1 – 2 g (NHI, 0.838) and ears\2 g (NHI, 0.834). These results indicate that small ears have a negative effect on the HI and NHI for the plant stand as a whole.
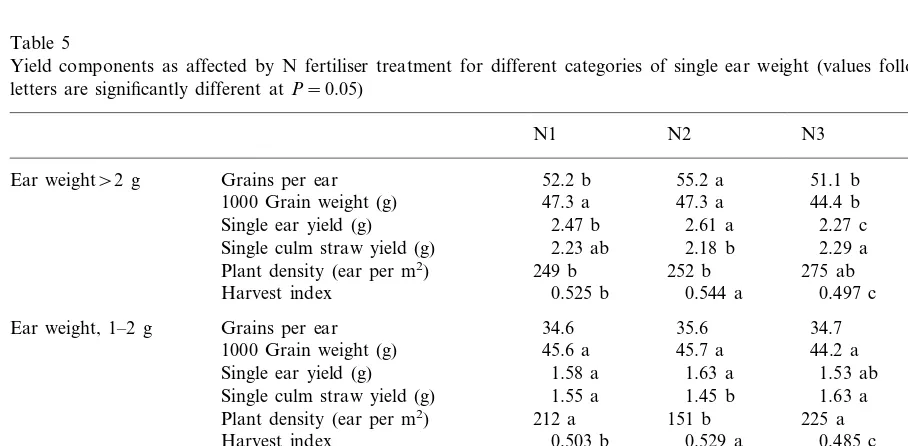
3.3. Yield components as affected by N fertiliser treatment for different categories of single ear weight
For N1 and N2 treatments, the number of grains per ear and 1000 grain weight was maxi-mum or above the average for all treatments and ear categories (Table 5). The superiority of N2 was evident when considering single ear yield. In contrast, single plant straw yield for the N2 treat-ment was below average for all ear categories.
For all ear categories, low rates of fertiliser N (110 kg ha−1; N1, N2) were associated with the
highest values of HI (Table 5). The timing of fertiliser N application led to significant variations in HI values. Treatment N2, receiving low N rates
during early growth stages, was superior as com-pared with N1, suggesting the altered timing of split N application resulted in differences in HI. In each ear category, treatment N2 was more efficient in supporting grain production than treatment N1. Larger amounts of fertiliser N (N3, N4) resulted in larger plant densities (\2 and 1 – 2 g ear categories), while plant density in ear categoryB1 g was almost unaffected by N fer-tiliser treatment. Plant densities of N1 and N2 only differed significantly in ear category 1 – 2 g.
As previously reported, a low single ear weight coincided with a low HI value (Table 4). This correlation could not be altered by the amount of fertiliser N used nor by the timing of N application.
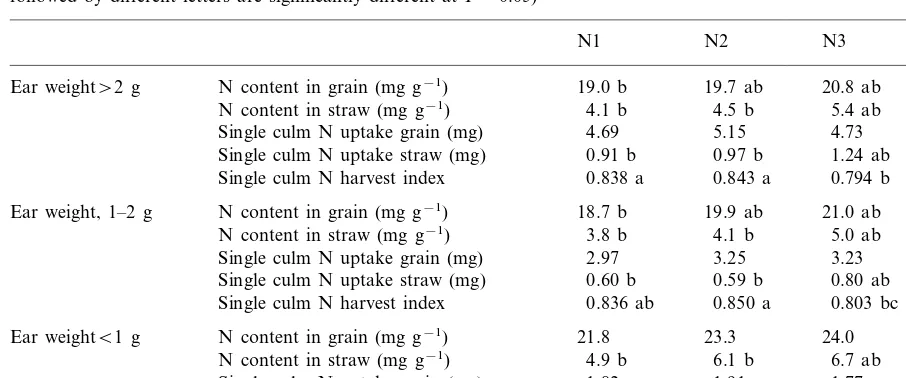
3.4. N utilisation as affected by N fertiliser treatment for different classes of single ear weight
As expected, N content in grain and straw increased by increasing the amount of N fertiliser applied (Table 6). However, due to variations in single ear yield (Table 5), the resulting N uptake
Table 5
Yield components as affected by N fertiliser treatment for different categories of single ear weight (values followed by different letters are significantly different atP=0.05)
N3 N4
Single ear yield (g) 2.27 c
2.27 a Single culm straw yield (g) 2.23 ab 2.18 b 2.29 a
252 b 275 ab 291 a Ear weight, 1–2 g
45.7 a 44.2 a 41.6 b 1000 Grain weight (g) 45.6 a
Single ear yield (g) 1.58 a 1.63 a 1.53 ab 1.42 b
1.56 a 1.63 a
1.45 b 1.55 a
Single culm straw yield (g)
Plant density (ear per m2) 212 a 151 b 225 a 205 a
0.529 a 0.485 c 0.477 c
Harvest index 0.503 b
Grains per ear 18.4 18.4 16.2 18.1
Ear weightB1 g
1000 grain weight (g) 45.5 44.7 45.8 43.7
0.79
Single ear yield (g) 0.84 0.82 0.74
1.15 a
0.93 c 1.11 ab
1.05 b Single culm straw yield (g)
Plant density (ear per m2) 70 70 86 74
Table 6
N content, N uptake and N harvest index as affected by N fertiliser treatment for different categories of single ear weight (values followed by different letters are significantly different atP=0.05)
N1 N2 N3 N4
N content in grain (mg g−1)
Ear weight\2 g 19.0 b 19.7 ab 20.8 ab 22.1 a
4.1 b 4.5 b
N content in straw (mg g−1) 5.4 ab 6.3 a
Single culm N uptake grain (mg) 4.69 5.15 4.73 4.83 0.91 b 0.97 b 1.24 ab 1.43 a Single culm N uptake straw (mg)
0.838 a 0.843 a 0.794 b
Single culm N harvest index 0.775 b
18.7 b 19.9 ab
Ear weight, 1–2 g N content in grain (mg g−1) 21.0 ab 22.6 a 3.8 b 4.1 b
N content in straw (mg g−1) 5.0 ab 6.0 a
Single culm N uptake grain (mg) 2.97 3.25 3.23 3.23 0.60 b 0.59 b
Single culm N uptake straw (mg) 0.80 ab 0.94 a
Single culm N harvest index 0.836 ab 0.850 a 0.803 bc 0.778 c
Ear weightB1 g N content in grain (mg g−1) 21.8 23.3 24.0 25.1
4.9 b 6.1 b
N content in straw (mg g−1) 6.7 ab 8.7 a
1.82 1.91 1.77
Single culm N uptake grain (mg) 1.98
0.51 c 0.57 bc
Single culm N uptake straw (mg) 0.77 ab 0.96 a
Single culm N harvest index 0.783 a 0.778 a 0.700 b 0.674 b
per ear varied only slightly between treatments. Comparing all N fertiliser treatments, the differ-ences in total N uptake of straw were greater than those for the total N uptake of grain. The decline of NHI under increasing N application rates was mainly due to the fertiliser induced variation of N uptake in straw.
For each fertiliser treatment, the differences in grain or straw N content in the \2 and 1 – 2 g ear categories were small (Table 6). In the B1 g ear category, there was a strong increase in N content both in grain and straw as compared with larger ears. The relative increase of N content in straw exceeded the relative increase of N content in grain, thus leading to a sharp decline in NHI. As with the HI (Table 6), this decline could not be altered by means of N fertilisation.
Significant deviations were observed in single culm NHI as affected by N fertiliser treatment (Table 6). With increasing amount of N fertiliser applied, the NHI declined in each ear category. The differences between N1 and N2 were statisti-cally not significant though N2 reached slightly higher values in the ear category of \2 and 1 – 2 g and also contributed to higher plant densities (Table 5).
4. Discussion
In addition, source capacity might be more limit-ing to yield in modern wheat cultivars if grain yield increased at the expense of vegetative biomass and surpassed an upper limit (Evans, 1993; Feil, 1998).
In this study, HI and NHI were mainly affected by single ear weight (Tables 5 and 6). An increase in single ears weight was linked to an increase of HI and NHI. It is therefore necessary to increase single ear weight in order to improve HI or NHI for a distinct and site specific level of grain yield potential. This finding is corroborated by several experimental data proving the significance of a large sink size for an efficient plant production. Rawson et al. (1976), Atsmon et al. (1986) suggest that an increase in sink size slowed the decline and prolonged the duration of photosynthetic ac-tivity of wheat. Larger ears are competing more efficiently for assimilates with other sinks than smaller ears (Cook and Evans, 1983). Apel et al. (1973), Austin et al. (1977) reported that a re-duced grain number resulted in a greater storage of assimilates in stems which were not remobilised and translocated to the ear. Wang et al. (1997) confirmed that partitioning of dry matter was mainly controlled by sink size.
Although total grain yield was not affected by N fertiliser treatments, the data proved that effi-ciency of grain production was indeed depending on N fertiliser treatment. In addition, one may draw some conclusions how the N amount and timing of fertilisation should be managed in order to improve the agronomical traits of a wheat stand, and the efficiency of grain production. Large amounts of N fertiliser, and pronounced fertilisation in early developmental stages en-hanced vegetative growth at the expense of gener-ative growth and single ear weight. This led to a decline in HI and NHI. This conclusion is in close agreement with findings of Fischbeck et al. (1993), proving that an excessive promotion of vegetative growth was not necessary for increasing grain yield and sometimes even may be detrimental. A reasonable explanation is that an enhanced devel-opment in the early growth stages may cause an initiation of components such as number of ears per m2, and florets per spike beyond optimum
values (Heyland and Triebel, 1982; Pommer and
Fink, 1992). According to the results of Maidl et al. (1998), there was evidence that reduction of yield components was intensified when initiation of these components surpassed optimum values. Maidl et al. (1998) also point out that reduction in the initiation process generally implies an un-productive consumption of resources. The authors concluded that N fertilisation should aim at mod-erating the reduction of initiation process rather
than stimulating the initiation of yield
components.
The presented data demonstrate that N fertili-sation strategies with moderate start N dressing result in lower plant densities, and simultaneously allow single culms to develop large single ear weights in all ear categories. The large sink size was the basis for an efficient grain production. The efficiency of translocation of assimilates and N compounds from the vegetative biomass to grain, as evident in the differences in N content in straw, proved to be the crucial determinant. This was strongly affected by the sink size.
References
Apel, P., Tschape, M., Schalldach, I., Aurich, O., 1973. Die Bedeutung der Karyopsen fu¨r die Photosynthese und Trockensubstanzproduktion bei Weizen. Photosynthetica 7, 132 – 139.
Atsmon, D., Bush, M.G., Evans, L.T., 1986. Effects of envi-ronmental conditions on the expression of the ‘Gigas’ characters in wheat. Aust. J. Plant Physiol. 13, 365 – 379. Austin, R.B., Edrich, J.A., Ford, M.A., Blackwell, R.D., 1977.
The fate of dry matter, carbohydrates and 14C lost from the leaves and stems of wheat during grain filling. Ann. Bot. 41, 1309 – 1321.
Austin, R.B., Ford, M.A., Morgan, C.L., Yeoman, D., 1993. Old and modern wheat cultivars compared on the Broad-balk wheat experiment. Eur. J. Agron. 2, 141 – 147. Cook, M.G., Evans, L.T., 1983. The roles of sink and location
in the partitioning of assimilates in wheat ears. Aust. J. Plant Physiol. 10, 313 – 327.
Diepolder, M., 1994. Untersuchungen zur Ableitung von Richtlinien fu¨r die Optimierung der N-Du¨ngung zu Win-terweizen. Diss. TU Mu¨nchen-Weihenstephan.
Evans, L.T., 1993. Crop Evolution, Adaptation and Yield. Cambridge University Press, Cambridge.
Fischbeck, G., Dennert, J., Mu¨ller, R., 1993. Untersuchungen zur Optimierung der N-Aufnahme von Winterweizenbe-sta¨nden durch erga¨nzende Du¨ngungsmaßnahmen. J. Agron. Crop Sci. 171, 82 – 95.
Hay, R.K.M., 1995. Harvest index: a review of its use in plant breeding and crop physiology. Ann. Appl. Biol. 126, 197 – 216.
Heyland, K.-U., Triebel, U., 1982. Gezielte Stickstoffdu¨ngung zur gesteuerten Ertragsbildung von Winterweizen unter Beru¨cksichtigung verschiedener anbautechnischer Maßnahmen. Bayer. Landw. Jb. 69 (4), 133 – 148. Kruk, B.C., Calderini, D.F., Slafer, G.A., 1997. Grain weight
in wheat cultivars released from 1920 to 1990 as affected by post-anthesis defoliation. J. Agric. Sci. Camb. 128 (3), 273 – 281.
Lopez-Castaneda, C., Richards, R.A., 1994. Variations in temperate cereals in rainfed environments. I. Grain yield, biomass and agronomic characteristics. Field Crops Res. 37 (1), 51 – 62.
Maidl, F.-X., Sticksel, E., Retzer, F., Fischbeck, G., 1998. Effect of varied N-fertilization on yield formation of winter wheat under particular consideration of mainstems and tillers. J. Agron. Crop Sci. 180, 15 – 22.
Naylor, R.E.L., Stokes, D.T., Matthews, S., 1998. Biomass, shoot uniformity and yield of winter barley. J. Agric. Sci. Camb. 131, 13 – 21.
Peltonen, J., 1992. Ear developmental stage used for timing
supplemental nitrogen application to spring wheat. Crop Sci. 32, 1029 – 1033.
Pommer, G., Fink, K., 1992. Ausrichtung der zweiten Stickst-offgabe bei Winterweizen an der Entwicklung der A8hrenanlage in den Haupthalmen. Bayer. Landw. Jb. 69 (4), 447 – 451.
Rawson, H.M., Gifford, R.M., Bremner, P.M., 1976. Carbon dioxide exchange in relation to sink demand in wheat. Planta 132, 19 – 23.
Riess, F., 1993. Untersuchungen zur Nitratauswaschung nach mineralischer und organischer Du¨ngung von Ackerland und Gru¨nland mittels der Saugkerzenmethode. Diss. TU Mu¨nchen-Weihenstephan.
Slafer, G.A., Savin, R., 1994. Source – sink relationships and grain mass at different positions within the spike in wheat. Field Crops Res. 37 (1), 39 – 49.
SPSS, 1993, SPSS for Windows. User’s Guide, Release 6.0. SPSS, Chicago, USA.
Tottman, D.R., 1987. The decimal code for the growth stages of cereals, with illustrations. Ann. Appl. Biol. 110, 441 – 445. Wang, Z., Fu, J., He, M., Tian, Q., Cao, H., 1997. Planting density effects on assimilation and partitioning of photosyn-thates during grain filling in the late sown wheat. Biol. Plant. 39 (3), 379 – 385.
Webb, J., Seeney, F.M., Sylvester-Bradley, R., 1998. The response to fertilizer nitrogen of cereals grown on sandy soils. J. Agric. Sci. Camb. 130 (3), 271 – 286.