10 (2000) 1 – 14
Is the foreign exchange market ‘risky’? Some
new survey-based results
Ronald MacDonald *
Department of Economics,Uni6ersity of Strathclyde,100Cathedral St.,Glasgow G4 0LN,UK Received 9 April 1998; accepted 12 November 1998
Abstract
In this paper we examine the evidence in favour of time-varying risk premia for four foreign exchange markets. The main novelty in our work is that we use survey-based expectations data to generate risk premia, rather than exploiting the rational expectations assumption. In contrast to the perceived wisdom on the existence of a foreign exchange risk premium, we present positive evidence for the view that risk is an important variable in foreign exchange markets. © 2000 Elsevier Science B.V. All rights reserved.
Keywords:Exchange risk premia; Survey data JEL classification:F3; G15
www.elsevier.com/locate/econbase
1. Introduction
It has become something of a stylised fact that the forward market for foreign exchange is inefficient, in the sense that the forward premium is a biased predictor of the actual exchange rate change1. Two main interpretations have been given for
this finding: either it reflects a time-varying risk premium (Fama, 1984), some form of expectational failure, such as a ‘peso’ effect (Krasker, 1980), learning (Lewis, 1989) or simple irrationality (Bilson, 1981). A considerable amount of research
* Tel.: +44-141-548-3861; fax: +44-141-552-5589.
E-mail address:[email protected] (R. MacDonald)
1See Hodrick (1987) and Engel (1996) for comprehensive overviews of this literature.
effort has been devoted to discerning which of these interpretations is respon-sible for the rejection, with the largest effort being devoted to the risk premium interpretation. Conditional on the assumption of rational expectations, a number of researchers have sought to test for the existence of a time-varying foreign exchange risk premium and also attempted to model it. A fair assessment of this literature would be that the evidence in favour of a risk pre-mium is rather limited2. More positive results have been reported by researchers
who have sought to interpret the biasedness result as stemming from the ex-pectational failures of risk neutral agents. This literature has involved using forward forecast errors to generate trading rules which turn out, in an ex post sense, to be profitable (Bilson, 1981; Bilson and Hsieh, 1987; Marsh and Power, 1996).
A problem with either the risk premium or expectational interpretation of forward rate biasedness is that it is just that — an interpretation. In order to avoid taking a position on whether agents are risk neutral and/or rational, a number of researchers have advocated using survey data on foreign exchange market partici-pants expectations of exchange rates (see, inter alia, Frankel and Froot, 1987, 1989, 1990; Dominguez, 1986; MacDonald and Torrance, 1988, 1990; MacDonald, 1990b, 1992; Cavaglia et al., 1993, 1994; Frankel and Chinn, 1993; MacDonald and Marsh, 1994, 1996; Chinn and Frankel, 1994). This research may be thought of as trying to decompose the measure of forward rate biasedness, recorded in numerous regression results, into a component due to risk and a component due to irrationality3. A fair summary of this burgeoning literature is that it suggests that
both irrationality and time-varying risk premia are responsible for the rejection. However, all of the above-noted survey tests are concerned with testing for the existence of time-varying risk premia. None, to our knowledge, actually attempts to empirically model the risk premium generated from survey data. This is the purpose of the present paper. Our approach is wholly empirical. In particular, we use survey data collected by Money Market Services (UK) to construct risk premia for four currencies. We then analyse the time series properties of these premia using different time series methods. In contrast to practically all of the extant literature which exploits the rational expectations assumption to construct risk premia, we report a considerable amount of evidence supportive of time-varying risk premia.
The outline of the remainder of this paper is as follows. In the next section we define the survey- and rational expectations-based foreign exchange risk premia and briefly discuss two models which facilitate the pricing of foreign exchange risk. In Section 3, the data set used in the paper is defined. In Section 4, ARCH and GARCH models are used to generate explanatory variables for the risk premium. The paper closes with a concluding section.
2See, for example, Hodrick (1987), Engel (1996) and MacDonald (1988, 1990a).
3See Frankel and Froot (1989) for a formal derivation of this decomposition for the slope coefficient
2. The foreign exchange market risk premium
The foreign exchange risk premium is the amount required by a risk averse investor to compensate her for taking a position in a foreign asset whose character-istics are identical in all respects to an equivalent domestic asset, apart from its currency of denomination. It is normally defined as:
lt=(ftt+k−st)−(ste+k−st) (1)
where lt denotes the risk premium, ftt+k denotes the period tforward rate with a
maturity date in period t+k(henceforth this shall be denoted asft), ste+kdenotes
the spot exchange rate expected to prevail in period t+k, conditional on informa-tion available in period t, st denotes the period t spot rate and all variables are
expressed in natural logarithms. The first term in parenthesis in Eq. (1) is the forward premium, while the second term is the expected change in the exchange rate (for future reference it is worth noting that Eq. (1) implies the risk premium can be defined more succinctly as:ft−st+k
e ). The expectation pertaining to the spot
exchange rate is a subjective expectation.
The traditional approach to defining lt has involved assuming that the included
expectation is formulated conditional on information available in period t; that is, expectations are rational. This assumption may be expressed as:
ste+k=E[st+kIt], st+k=ste+k+ht+k (2)
where E denotes the mathematical expectations operator, It is the information set
on which agents base their expectations and ht+k is a random forecast error,
orthogonal to the information set4
. The ‘rational’ risk premium is therefore defined as ft−st+k+ht+k, and we label this lt
re
.
The approach adopted in this paper involves using survey-based expectations to define the risk premium. This gives an alternative definition, labeledlt
su. We believe
that the latter is a more direct measure of the risk premium since it should capture the expectations of agents who are ‘close to the market’. The measured mean value of the survey expectation is defined as st+k
su,e. For a variety of reasons, such as the
imperfect synchronisation of survey responses and the use of a consensus response (mean or median), which is extracted from only a fraction of market participants, it is unlikely that the survey expectations will be identically equal to the ‘true’ subjective expectation value, ste+k. Consistent with researchers who have tested
various expectational properties of survey data (see, for example, Frankel and Froot (1987), we assume that the measured expected value is equal to the ‘true’ value plus a random measurement error:
st+k
su,e
=st+k
e
+8t+k (3)
where 8t+k is the survey forecast or measurement error. This implies that lt
su
is given by ft−st+k
su,e
+8t+k.
4In the presence of overlapping data (i.e. where the expectational horizon is longer than the
One key issue in defining the rational expectations risk premium is that it is model-dependent: the econometrician has to make some assumption about the conditioning information set and a particular empirical result may be driven by a mismatch between the information set used by forecasters and that used by the econometrician. The major advantage of survey data as a measure of expectations is that there is no difference between the investor’s and the econome-trician’s information sets. Having said that, however, in order to model our measures of the risk premium we use two classes of theoretical models which have been exploited to test the rational expectations risk premium, namely the portfolio balance model (PBM)5 and the general equilibrium asset pricing
(GEAP) nodel6
. Clearly, survey expectations are unlikely to conform to model-consistent expectations (especially given the extant empirical evidence using such data). Our purpose here, therefore, is simply to use these models as a guide to the kinds of variables that are likely to be important for the evolution and pricing of the risk premium, rather than test a particular model of the risk premium. Our approach is therefore in the spirit of Dominguez and Frankel (1993a,b) who use a survey-based measure of the risk premium to test the effectiveness of foreign exchange market intervention in the context of the portfolio balance model. Since both classes of models are well known, we do not give a detailed account of their derivation (see Hodrick (1987) and Engel (1996) for a detailed description).
Following Dooley and Isard (1982) and Frankel (1982), the PBM may be summarised by the following equation7:
it−i*t−Dstsu,e+k=g0+g1st+g2stxt+8t+k (4)
where anidenotes an interest rate, an asterisk a foreign magnitude, st denotes the
variance of returns and xt is the ratio of domestic assets in investors portfolios as
a proportion of total wealth. Since covered interest parity is known to hold (Frankel, 1993)8, Eq. (4) may alternatively be expressed as:
ft−stsu,e+k=g0+g1st+g2stxt+8t+k (5)
Eq. (5) predicts that an increase in the variance of returns, by increasing uncertainty, or an increase in the supply of domestic assets relative to wealth produces an increased risk premium.
Central to the GEAP class of models is a first-order condition of the following form:
5See, inter alia, Branson (1977), Allen and Kenen (1980) and Frankel (1982).
6That is, the model of Lucas (1982) which has been estimated, using the assumption of rational
expectations by, inter alia, Hodrick (1989), Mark (1985), Canova and Marrinan (1993).
7See Dominguez and Frankel (1993a,b) for a fuller discussion.
8Given the way in which banks set forward rates on the basis of interest rates, covered interest parity
lt=
ln!
Et[Y1t+k(M1t+k)−1U
1t+k]
Et[Y2t+k(M2t+k)−1U2t+k]
"
−Etln!
Y1t+k(M1t+k)−1U1t+k
Y2t+k(M2t+k)−1U2t+k
"
(6) where of variables not previously defined, M denotes the quantity of money, Yis real income and U denotes marginal utility (other variables, may affect the risk premium through the marginal utility terms) and the subscripts 1, 2 denote, respectively, country 1 and 2. In this model the risk premium is related to relative money supplies and relative income levels between the two countries in the way predicted by the monetary model of the exchange rate. In order to say anything about the expected relationship between the fundamentals and the risk premium, a closed form version of Eq. (6) has to be derived. Canova and Marrinan (1993) offer one such solution. Here we present the following second-order Taylor approxima-tion to Eq. (6), which is a useful empirical representaapproxima-tion of the GEAPltsu=bE
t(zt+k)+dVart(zt+k)+jt+k (7)
wherezt={x1t,x2t} represents the state vector, withxit=[mit,yit] (i=1,2) andband dare vector coefficients (on the basis of the argument given earlier, we have written this expression for the survey-based risk premium). Hence from this model the risk premium is seen to be related to the conditional means, variances and covariances of the state vector. In Section 5 we discuss the empirical implementation of Eqs. (5) and (7) for our data set.
3. Data sources
The survey data for this study consist of the median value of Money Market Services (MMS) 1-month expectations of the Deutschmark – US dollar (Mark), Sterling – US dollar (Sterling) and Japanese yen – US dollar (Yen). The data are observed weekly and span the period 2 January 1985 through to 12 December 1991. Flood and Rose (1994) have argued that the forward rate is a less biased predictor for exchange rates participating in the EMS. Given that for part of our sample, at least, the pound sterling could be thought of as an ERM currency — shadowing the mark (in the late 1980s) and from October 1990 to the end of our sample was an actual member of the ERM — we also constructed the Sterling – Deutschmark (STMK) cross rate from the (Mark) and (Sterling) rates9. Does the implied risk
premium for this country behave any differently to the US dollar bilaterals? Our source for actual data on spot and forward exchange rates is Citibank and MMS, and this data has been carefully matched to the survey data. In particular, the spot rate dated on the survey date,st, is that recorded by MMS and is the spot
rate available to agents when making their forecast. The spot rate prevailing on the forecast date, st+k and the forward rate prevailing on the day the survey is
conducted are both sourced from Citibank10
. The spot and forward rates supplied
9The construction of this exchange rate, of course, assumes that the expected rate produced with
triangular arbitrage is consistent with the actual forecasts that forecasters would have produced for this currency.
10This is defined as the rate prevailing 30 days from the survey date. If this date was a holiday, we
by Citibank are close-of-business bid rates. We also utilise aggregate country stock market indices and these have also been sourced from Citibank for each of the survey dates. The indices used are: the FT100 (UK), the DAX (Germany), the Nikkei 225 (Japan), and the S and P Composite (US).
4. The time series properties of risk premia
4.1. Some descripti6e statistics
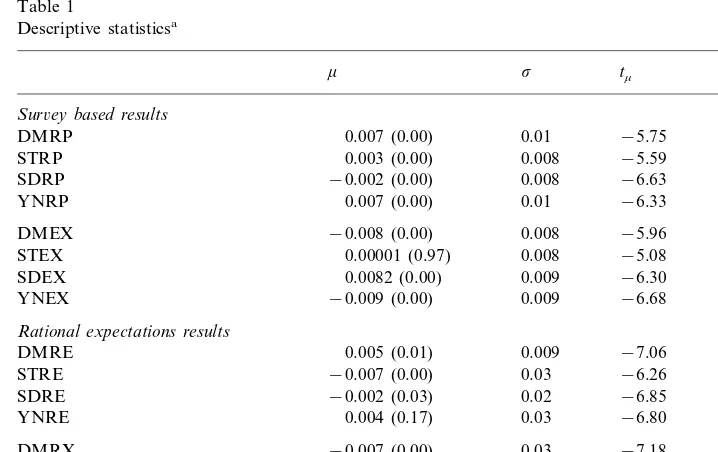
In Table 1 some descriptive statistics for our data set are presented. We note, first, that the mean value of the survey-based risk premium is significantly positive for all of the currencies, apart from the sterling – mark rate which is significantly negative. Plots of these risk premia, along with the corresponding forward premia for each of the currencies, reveal a considerable degree of variability in risk premia relative to forward premia11. It turns out that the negative mean value of the
11These plots are available on request from the author.
Table 1
STRP 0.003 (0.00) 0.008 −5.59 −5.59
−6.63
STEX 0.00001 (0.97) 0.008 −5.08 −5.16
−6.30
aThe mnemonics DM, ST, SD and YN denote, respectively, the mark–dollar, sterling–dollar,
sterling–mark and yen–dollar exchange rates. The letters after the currency definitions have the following interpretation: RP and EX denote, respectively, the survey-based risk premium and expected exchange rate change, RE and RX denote, respectively, the rational expectations-based risk premium and expected exchange rate change;mis a sample mean (marginal significance in parentheses) andsa sample S.D. The numbers in the columns labeledtmandttare augmented Dickey Fullert-ratios, for the level of the
risk premium, with, respectively, a constant (tm) and a constant and a time trend in the deterministic set
STMK rate is driven by a preponderance of negative values in the 1989 – 90 period (suggesting that there were gains from shadowing the mark and ERM participa-tion), and also from the period up to 1987.
Another stylised fact in the data is that the rational risk premia are much more volatile than the survey-based measures, a finding confirmed by a visual inspection of the data and also in Table 1 where the sample S.D.s of the rational risk premia are larger in every case than the comparable survey premia (by a factor of around three). The source of this greater instability results from a greater volatility in the rational expected change in the exchange rate compared to the survey expected exchange rate change, a finding also confirmed in Table 1. Given our discussion in the previous section, we interpret this as evidence that the rational-based risk premium is noisier than its survey-based counterpart.
Another interesting feature of the two series of risk premiums is that they exhibit very different time series properties. In particular, the survey-based measures have more complicated autocorrelation functions than their rational expectations coun-terparts. The sterling – dollar rate gave the most striking example of this, since nine out of 20 autocorrelation spikes were statistically significant on the basis of the survey-based measure, while only three were significant using the rational-based premium. This is perhaps a first indication that survey-based measures of the risk premium will be more amenable to modelling than the rational-based measure. A prediction of the GEAP model is that the risk premium should be a stationary process (Cavaglia et al., 1994) and this is indeed confirmed in the final two columns of Table 1, where augmented Dickey Fuller statistics are reported.
5. Explaining the predictability of the risk premium using ARCH and GARCH models
The results in the previous section indicate that there is a substantial amount of predictability in the behaviour of survey-based risk premia. The purpose in this section is to attempt to explain such predictability in terms of the ‘fundamentals’ noted in Section 2. The fundamentals suggested by the GEAP model, and con-tained in the z vector, are unfortunately not available on a weekly basis. To implement the GEAP approach, therefore, we adopt the more limited approach of Domowitz and Hakkio (1985), who argued that the GEAP class of model can be proxied using an autoregressive conditional heteroskedasticity (ARCH)-in-mean model. In the current application this model has the following form:
st+4 su,e
−st+4=u0+ot+4+u1ot+3+u2ot+2+u3ot+1 (8)
ot+4ItN(O,ht+4 2
) (9)
ht+4 2
=g0+ %
n
j=1
gj
2
ot+4−j
2 (10)
whereht+1
2 denotes the conditional variance and the overlapping nature of the data
pro-cess. As an alternative to the ARCH structure of Eq. (10), we also estimate GARCH(1,1) models of the following form:
ht+1
where the conditional variance now depends on lagged values of the conditional variance in addition to lagged squared forecast errors. The system (Eqs. (8) – (10) and (10%)) was estimated using full information maximum likelihood. The
condi-tional S.D. generated by these systems was then used to construct projection equations of the following form:
ltsu
=a+bht+1 (11)
Eq. (11) implies that the time series properties of the risk premium are deter-mined solely by the movement of the conditional variance. Further, note that an important implication of the modelling strategy reflected in Eqs. (10) and (10%) is that the risk premium can be positive or negative. Stockman (1978), for example, noted that ‘the point estimates of the risk premium change signs’ when a hypothe-sised measure of the risk premium was estimated over different sub-samples. This, of course, differs from a ‘closed economy’ risk premium — say that on equities — simply because the risk premium studied here refers to the relati6e price of two
currencies.
The PBM model highlights two variables as being important for the determina-tion of the risk premium: the variance of returns and the ratio of assets to wealth. The first variable is amenable to modelling by both ARCH and GARCH methods. Unfortunately, the components of the second variable are not available on a weekly basis (indeed wealth data, if available at all, is often only available on a quarterly basis). However, since stock price changes are generally regarded as having important revaluation effects on wealth we propose using stock price indices as our proxy for a wealth effect. To be consistent with our other modelling, we again utilise ARCH and GARCH methods to model stock price volatility.
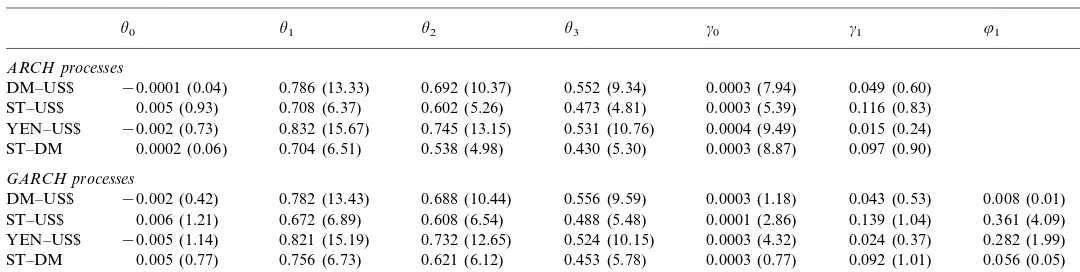
The estimates of the ARCH and GARCH models associated with Eq. (8) are reported in Table 2. As expected, given the overlapping nature of the data, the estimates of the moving average coefficients are all strongly significant. The evidence of ARCH effects are somewhat disappointing in that for all four curren-cies it is only the mean term, g0, which is statistically significant. However, the
GARCH models appear to be more promising since the lagged variance term is statistically significant in addition to the mean term in two of the equations. The success in extracting information about the conditional S.D. of the expected change in the exchange rate using these models is the first step in understanding the behaviour of the risk premium. The second step involves relating these measures of conditional volatility to the risk premia.
R
.
MacDonald
/
J
.
of
Multi
.
Fin
.
Manag
.
10
(2000)
1
–
14
9
Estimates of ARCH and GARCH processesa
u3 g0 g1 81
u1 u2
u0
ARCH processes
−0.0001 (0.04) 0.786 (13.33) 0.692 (10.37) 0.0003 (7.94) 0.049 (0.60)
DM–US$ 0.552 (9.34)
0.116 (0.83) 0.0003 (5.39)
ST–US$ 0.005 (0.93) 0.708 (6.37) 0.602 (5.26) 0.473 (4.81)
0.0004 (9.49)
−0.002 (0.73) 0.832 (15.67) 0.745 (13.15) 0.531 (10.76) 0.015 (0.24) YEN–US$
0.0002 (0.06) 0.704 (6.51) 0.538 (4.98) 0.0003 (8.87) 0.097 (0.90)
ST–DM 0.430 (5.30)
GARCH processes
0.043 (0.53) 0.008 (0.01) 0.782 (13.43)
DM–US$ −0.002 (0.42) 0.688 (10.44) 0.556 (9.59) 0.0003 (1.18)
0.488 (5.48) 0.0001 (2.86) 0.139 (1.04) 0.361 (4.09) 0.672 (6.89)
ST–US$ 0.006 (1.21) 0.608 (6.54)
YEN–US$ −0.005 (1.14) 0.821 (15.19) 0.732 (12.65) 0.524 (10.15) 0.0003 (4.32) 0.024 (0.37) 0.282 (1.99) 0.092 (1.01) 0.056 (0.05) 0.005 (0.77) 0.756 (6.73) 0.621 (6.12) 0.453 (5.78) 0.0003 (0.77)
ST–DM
aThe non-bracketed numbers underu
0tou3are the estimates of the constant (u0) and the coefficients (uutou3) of the third-order moving average error
structure implied by the overlapping data set. The non-bracketed numbers under thegterms are the estimates of the coefficients in Eqs. (10) and (10%), with j=1, whilst the non-bracketed numbers under81are the estimates of the81coefficient in Eq. (10%) withj=1. The numbers in parentheses are estimated
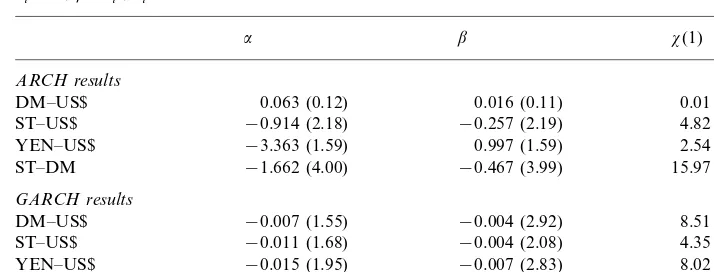
Table 3
Regressions of the risk premium on the conditional S.D. of ARCH and GARCH forecast errorsa
lt=a+bcsdt+ut
b x(1)
a
ARCH results
DM–US$ 0.063 (0.12) 0.016 (0.11) 0.01 (0.91)
4.82 (0.02)
aThe non-bracketed numbers in the columns labeledaandbare the point estimates of the coefficients
of the constant and coefficients in Eq. (9). GMM t-ratios (which correct the S.E. for conditional heteroskedasticity and the implied moving average error structure) are reported in parentheses. The non-bracketed numbers in the column headedx(1) are linear Wald statistics which test the hypothesis thatb=0. These have a centralx2distribution with one degree of freedom; marginal significance levels
are reported in parentheses.
both the constant and coefficient on the conditional S.D. are significantly negative at the 5% level, indicating that a long position in forward foreign currency requires an expected loss. For the yen – dollar market there is some evidence that the conditional S.D. is important in determining the risk premium (at the 11% significance level) while for the mark – dollar rate, there is no evidence of such effects.
The estimates of b generated using the GARCH model for the error process are more encouraging than the ARCH-based results, since for three of the currencies this coefficient is statistically significant at the 5% level, or better, in all cases. The sterling – mark coefficient is significant at only the 13% level. In each case the b coefficient is negative, again indicating that a long position in forward foreign currency requires an expected loss. Also it is noteworthy that the order of magnitude of the coefficient estimates is similar across currencies. Such significant results contrast with much of the extant empirical evidence on modelling foreign exchange risk premia using the rational expectations assump-tion.
In implementing the PBM model, we found that the effect of the variance of returns on the risk premium was similar, in terms of the statistical significance, to those reported for the forecast errors. These results are therefore not reported here, but are available from the author on request. Our tests of the PBM model concentrate on the effect of stock price revaluations on the risk premium and are based on:
Table 4
ARCH and GARCH models of stock price seriesa
u0 g0 g1 81
(i)ARCH models of indi6idual country stock price indices
US 0.004 (3.75) 0.0002 (11.12) 0.518 (9.64) 0.294 (3.63)
(ii)GARCH models of indi6idual country stock price indices
0.479 (10.00) 0.361 (10.09) 0.0001 (5.09)
0.005 (4.89) US
0.0004 (6.04)
0.0008 (0.46) 0.284 (3.39) 0.122 (1.08)
Germany
0.0006 (25.77)
0.002 (0.66) 0.059 (1.03) 0.0009 (0.08)
UK
0.362 (4.21) 0.613 (10.77) 0.00005 (2.52)
Japan 0.004 (4.01)
aIn part (i) of the table are the estimates of ARCH (1) models for the stock market indices of the
countries noted in column 1 (see Table 2 for definitions of theganduterms). The GARCH(1,1) models for the stock price indices are presented in part (ii).
where CSD(hsp) is the conditional S.D. of the home stock price change and CSD(ussp) is the conditional S.D. of the foreign (i.e. US) stock price series. The separation of the source of time-varying risk into a home and foreign component means that b1 is expected to be positive — an increase in the riskiness of the
domestic stock market increases the risk premium — while b2 is expected to be
negative. Again, as in our application of the GEAP model, both ARCH and GARCH models are used to capture the volatility of the stock price series.
The estimated ARCH and GARCH models used to construct the CSD(hspt) and
CSD(usspt) terms are reported in Table 4. For all of the currencies, apart from
sterling, there is evidence of significant ARCH effects and two of the countries display significant GARCH effects (the US and Japan).
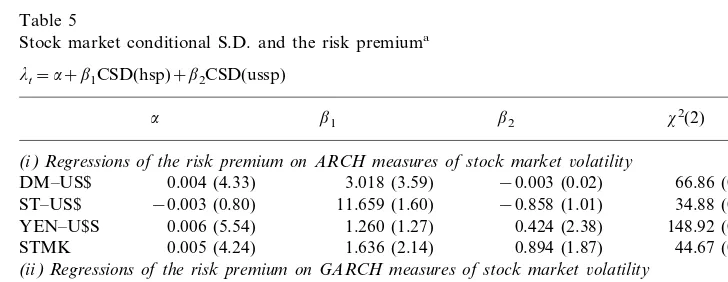
Table 5
Stock market conditional S.D. and the risk premiuma
lt=a+b1CSD(hsp)+b2CSD(ussp)
x2(2)
b2
b1
a
(i)Regressions of the risk premium on ARCH measures of stock market6olatility 3.018 (3.59)
DM–US$ 0.004 (4.33) −0.003 (0.02) 66.86 (0.00)
34.88 (0.00) ST–US$ −0.003 (0.80) 11.659 (1.60) −0.858 (1.01)
1.260 (1.27) 148.92 (0.00)
0.006 (5.54)
YEN–U$S 0.424 (2.38)
STMK 0.005 (4.24) 1.636 (2.14) 0.894 (1.87) 44.67 (0.00) (ii)Regressions of the risk premium on GARCH measures of stock market6olatility
28.43 (0.00)
Our tests of Eq. (12) are presented in Table 5 part (i) (ARCH estimates) and (ii) (GARCH estimates). These estimates appear to be highly successful in that the majority of the coefficients on the conditional S.D. terms are statistically significant and, indeed, the joint hypothesis that the coefficients on the home and foreign S.D. are zero can be rejected at the 1% significance level in all instances. The b1
coefficients, in all but one case, are positive suggesting that increased domestic stock market volatility increases the risk premium. Three of theb2coefficients are
negatively signed (although insignificantly so) suggesting that an increase in US stock market volatility decreases the home currency risk premium. This seems intuitive enough. The finding of a positive b2 coefficient in the
remain-ing relationships seems counter-intuitive, but perhaps indicates the importance of the US stock market as a leading indicator of stock market developments in the home market (through a contagion effect). We judge these results to be supportive of our implementation of the portfolio balance model, and this again contrasts with the extant literature (using rational-based risk premia) which, in general, does not find significant evidence of a time-varying foreign exchange risk premium.
6. Concluding comments
Until fairly recently, the conventional wisdom was that the evidence for the existence of a foreign exchange risk premium was rather weak (MacDonald, 1990a). However, to our knowledge, all of this evidence was predicated on the assumption of rational expectations. In this paper we have used survey-based measures of risk premia for four foreign exchange markets in an attempt to shed some light on the existence of foreign exchange risk premia.
Our main results may be summarised in the following way. First, survey-based risk premia are time-varying and volatile (especially when compared to forward premia), but not as volatile as rational-based risk premia. Second, survey risk premia, although stationary, exhibit considerable persistence. ARCH- and GARCH-based models were used to test a version of the general equilibrium asset pricing model of the risk premium and this reveals that foreign exchange risk premia are significantly related to the conditional variance of forecast errors. This result differs from the findings of Domowitz and Hakkio (1985) who tested the GEAP model with risk premia defined using the rational expectations assumption. Finally, our survey-based measures of the risk premium were used to test a variant of the portfolio balance model and again this proved successful since statistically significant relationships between risk premia and the conditional variance of stock market volatility were reported. We did not find any evidence of a ‘DM effect’, in the sense that the DM-based risk premium analysed in this paper behaved in a similar fashion to the US-based premia.
Acknowledgements
I am grateful to an anonymous referee and the Editor, Ike Mathur, for helpful comments on an earlier version of this paper. The usual disclaimer applies.
References
Allen, P.R., Kenen, P., 1980. Asset Markets, Exchange Rates and Economic Integration. Cambridge University Press, Cambridge.
Bilson, J.F.O., 1981. The speculative efficiency hypothesis. J. Bus. 54, 435 – 451.
Bilson, J.F.O., Hsieh, D.A., 1987. The profitability of currency speculation. Int. J. Forecasting 3, 115 – 130.
Branson, W., 1977. Asset markets and relative prices in exchange rate determination. Institute for International Economic Studies, Reprint Series No. 98.
Canova, Marrinan, 1993. J. Monetary Econ. 32, 259 – 286.
Cavaglia, S., Verschoor, W., Wolff, C., 1993. Further evidence on exchange rate expectations. J. Int. Money Finance 12, 78 – 98.
Cavaglia, S., Verschoor, W., Wolff, C., 1994. On the biasedness of forward foreign exchange rates. J. Bus. 67, 321 – 343.
Chinn, M., Frankel, J.A., 1994. Patterns in exchange rate forecasts for 25 currencies. J. Money Credit Banking, 26.
Dominguez, K., 1986. Are foreign exchange forecasts rational? new evidence from survey data. Econ. Lett. 21, 277 – 281.
Dominguez, K., Frankel, J., 1993a. Does foreign-exchange intervention matter? The portfolio effect. Am. Econ. Rev. 83 (5), 1356 – 1369.
Dominguez, K., Frankel, J., 1993b. Does Foreign Exchange Market Intervention Work? Institute for International Economics, Washington, DC.
Domowitz, I., Hakkio, C., 1985. Conditional variance and the risk premium in the foreign exchange market. J. Int. Econ. 19, 47 – 66.
Dooley, M., Isard, P., 1982. A portfolio-balance rational-expectations model of the dollar-mark rate. J. Int. Econ. 12, 257 – 276.
Engel, C., 1996. The forward discount anomaly and the risk premium: A survey of the recent evidence. J. Empir. Finance 3, 123 – 192.
Fama, E.F., 1984. Forward and spot exchange rates. J. Monetary Econ. 14 (3), 319 – 338.
Flood, R., Rose, A.K., 1994. Fixes: Of the forward discount puzzle, NBER, Working Paper No. 4928. Frankel, J.A., 1982. In search of the exchange risk premium: A six currency test assuming mean-variance
optimisation. J. Int. Money Finance 1, 255 – 274.
Frankel, J.A., 1993. On Exchange Rates. MIT Press, Cambridge, MA.
Frankel, J., Chinn, M., 1993. Exchange rate expectations and the risk premium: tests for a cross section of 17 currencies. Rev. Int. Econ. 1, 136 – 144.
Frankel, J., Froot, K., 1987. Using survey data to test some standard propositions regarding exchange rate expectations. Am. Econ. Rev. 77 (1), 133 – 153.
Frankel, J., Froot, K., 1989. Interpreting tests of forward discount bias using survey data on exchange rate expectations. Q. J. Econ. 104, 139 – 161.
Frankel, J., Froot, K., 1990. Exchange rate forecasting techniques, survey data, and implications for the foreign exchange market. NBER Working Paper No. 3470.
Hodrick, R.J., 1987. The Empirical Evidence on the Efficiency of Forward and Futures Foreign Exchange Markets. Harwood, London.
Hodrick, R.J., 1989. Risk, uncertainty and exchange rates. J. Monetary Econ. 23, 433 – 459.
Lewis, K., 1989. Changing beliefs and systematic forecast errors. Am. Econ. Rev. 79, 621 – 636. Lucas, R.E., 1982. Interest rates and currency prices in a two-country world. J. Monetary Econ. 16,
335 – 360.
MacDonald, R., 1988. Floating Exchange Rates: Theories and Evidence. Unwin Hyman, London. MacDonald, R., 1990a. Exchange rate economics: an empirical perspective. In: Bird, G. (Ed.), The
International Financial Regime. Surrey University Press, Surrey.
MacDonald, R., 1990b. Are foreign exchange market forecasters rational?: some survey based tests. Manchester School Econ. Social Stud. LVIII, 229 – 241.
MacDonald, R., 1992. Exchange rate survey data: A disaggregated G-7 approach. Manchester School Econ. Social Stud. 60, 147 – 162.
MacDonald, R., Marsh, I., 1994. Combining exchange rate forecasts: what is the optimal consensus measure? J. Forecasting 13, 313 – 332.
MacDonald, R., Marsh, I.W., 1996. Foreign exchange forecasters are heterogenous confirmation and consequences. J. Int. Money Finance 15, 665 – 685.
MacDonald, R., Torrance, T.S., 1988. On risk, rationality and excessive speculation in the deutsche-mark-US dollar exchange market: some evidence using survey data. Oxford Bull. Econ. Stat. 50 (2), 1 – 17.
MacDonald, R., Torrance, T.S., 1990. Expectations formation and risk in four foreign exchange markets. Oxford Econ. Pap. 42, 544 – 561.
Mark, N., 1985. On time-varying risk premia in the foreign exchange market. J. Monetary Econ. 16, 3 – 58.
Marsh, I.W., Power, D.M., 1996. A note on the performance of foreign exchange forecasters in a portfolio framework. J. Banking Finance 20, 605 – 613.
Stockman, A., 1978. Risk information and forward exchange rates. In: Frenkel, J.A., Johnson, H.G. (Eds.), The Economics of Exchange Rates. Addison-Wesley, Reading, MA.