IJG Vol. 46, No.2, December 2014 (195 - 207) © 2014 Faculty of Geography UGM and he Indonesian Geographers Association
he Livelihood Analysis in Merapi Prone Area Ater 2010 Eruption
Susy Nofrita, B.G.C.M. Bart Krol
Received: 14 06 2014 / Accepted: 04 08 2014 / Published online: 31 12 2014 © 2014 Faculty of Geography UGM and he Indonesian Geographers Association
Abstract As stated in Regent Regulation No. 20 Year 2011 about Merapi Volcano Disaster-Prone Area, Merapi eruption in 2010 afected larger area than before included Kalitengah Lor, Kalitengah Kidul and Srunen hamlet which was now categorized as prone area zone III or the most dangerous area related to Merapi volcano hazard and was forbidden to live at. But its local people agreed to oppose the regulation and this area had been 100% reoccupied. his research examined about the existing livelihood condition in Kalitengah Lor, Kalitengah Kidul and Srunen that had been changed and degraded ater 2010 great eruption. he grounded based information found that 80% of households sample were at the middle level of welfare status, meanwhile the high and low were at 13% and 7% respectively. Each status represented dif-ferent livelihood strategy in facing the life in prone area with no one considered the Merapi hazard, but more economic motivation and assets preservation. he diversity in strategy was found in diversiication of livelihood resources which were dominated by sand mining, farming and dairy farming.
Abstrak Sebagaimana yang tercantum dalam Peraturan Bupati Nomor 20 Tahun 2011 tentang Kawasan Rawan Bencana
Gunung Merapi, letusan Merapi pada tahun 2010 mempengaruhi wilayah yang lebih luas dari sebelumnya, termasuk Dusun Kalitengah Lor, Kalitengah Kidul dan Srunen yang kini dikategorikan sebagai kawasan rawan bencana zona III atau daerah yang paling berbahaya terkait dengan bahaya gunung berapi Merapi dan merupakan daerah yang dilarang untuk ditinggali. Meskipun demikian, masyarakat lokal sepakat untuk menentang peraturan tersebut dan daerah ini telah 100% menduduki kembali. Penelitian ini meneliti tentang kondisi mata pencaharian yang ada di Kalitengah Lor, Kaliten-gah Kidul dan Srunen yang telah berubah dan terdegradasi setelah letusan besar 2010. Informasi dari kegiatan lapangan menunjukan bahwa 80% dari sampel rumah tangga memiliki status kesejahteraan tingkat menengah, sedangkan kelas tinggi dan rendah masing-masing adalah 13% dan 7%. Setiap kondisi tersebut mewakili strategi mata pencaharian yang berbeda dalam menghadapi hidup di daerah rawan bencana dimana bahaya Merapi tidak dianggap penting, tetapi lebih mengutamakan motivasi dan aset secara ekonomi. Keragaman dalam strategi bertahan hidup yang ditemukan terdiri dari diversiikasi sumber mata pencaharian yang didominasi oleh penambangan pasir, pertanian, dan peternakan sapi perah. Keywords: Merapi prone area, livelihood strategy, Kalitengah Lor, Kalitengah Kidul, Srunen, sand mining, farming
Kata kunci: daerah bahaya Merapi, strategi bertahan hidup, Kalitengah Lor, Kalitengah Kidul, Srunen, penambangan
pasir, pertanian
Merapi volcano has erupted 61 times since the 15th century, with an average repose of 3.5 years [houret et al., 2000]. According to both houret et al. [2000] and Barrett et al. [2001], some 60% of Java’s population lives around active volcanoes. Also the slopes of Merapi are occupied by a dense population. he Merapi area supports 300 villages, with 440,000 people living in the area prone to volcanic hazards, most of them in large extended families. here are 1.1 million people living in the wider area around Merapi, with high-intensity and low-technology agriculture as the dominant landuse [houret et al., 2000].
Research by Voight et al., [2000] and Young et al. [2000] about the activity of Merapi volcano shows that
Susy Nofrita, Bapeda kota solok
email: [email protected]
B.G.C.M. Bart Krol
Faculty of Geo-information and Earth Observastion, University of
its impact on human culture and land use activities is by now ten times larger than it was about 100 years ago. Tephra/ash fall is a major problem for people living in a wider area around active volcanoes. Moreover, many people that are living even closer to a volcano crater, in the direct hazard prone area, also need to worry about pyroclastic lows, landslides, and lahar hazards. When an eruption occurs on Merapi pyroclastic material and lahars can low more than 8 and 20 km respectively through its slope [Esperanza et al., 2008].
In response to the efect of volcanic eruptions many households near Merapi have established a mechanism of both on-farm and of-farm activities. Almost all people in rural areas around Merapi diversify their income sources, assets and activities [Sagala et al., 2009a; Sagala et al., 2009b]. It is one of the ways to reduce risk and respond to crisis. And the decision to diversify into a non-farm job can be a form of risk management and coping strategy with frequent shocks [Barrett et al., 2001].
his research wants danalyze and developed recommendations to improve the livelihood system in Merapi prone area by ssessing the existing land use condition ater 2010 Merapi eruption in Kalitengah Lor, Kalitengah Kidul and Srunen as prone area zone III and assessing the livelihood strategies occurring Kalitengah Lor, Kalitengah Kidul and Srunen related to volcanic activities. Developing recommendations of improvement for an appropriate livelihood is based on the analysis of resource used, and in the context of volcanic hazard in the Merapi area.
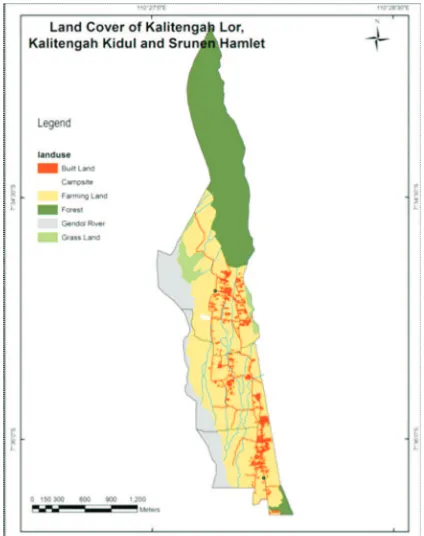
he research took place in three hamlets on the southern slope of Merapi which are still occupied even though in prone area zone III (Figure 1). he area is Kalitengah Lor, Kalitengah Kidul and Srunen hamlet that located in Glagaharjo village, in Cangkringan district of Sleman Regency in Yogyakarta Special Province of Indonesia. he distance from the crater of Merapi to the nearest house in Kalingah Lor is only 4.95 km. 100% of population in Kalitengah Lor, Kalitengah Kidul and Srunen had reoccupied their land ater 2010 eruption.
Figure 1. Location of Study Area
Geoeye composit 321 true color 2011 image interpretation presented the area that had been recovered as presented in Figure 2, which provide information about land cover in research area based on image interpretation and ield observation.
2. he Methods
Steps in collecting data was based on Creswell [1994] are; state the boundary of study, determine the information that will be gained through interview, documenting, observing and establishing the recording procedure. In deciding the research area was based on the government regulation about Merapi prone area ater 2010 eruption (Sleman Regency Regulation No. 20 Year 2011).
he grounded theory method that was used in this research considered the information from ield/participant [Creswell, 2010]. he survey was divided into two sections; the household survey by using unstructured in-depth interview for obtaining information about livelihood strategy and ield survey to get the information about existing condition ater household that make the population in Kalitengah Lor, Kalitengah Kidul and Srunen hamlet is in the same category.
he number of population in Kalitengah Lor, Kalitengah Kidul and Srunen is 1296 people in 416 household that represented by 30 respondents for in-depth interview about livelihood in Merapi prone area ater 2010 eruption. Each respondent represented their household.
he open coding step was undertaken by creating categories based on ield information from indepth interview that had been recorded. he keyword or
important information that were told by respondents need to be underlined and put into certain category, put in sub-category of coding, for example the category of reason for refusing relocation was divided into sub-categories of relatives, livelihood resources, etc. he last step is selective coding which was done by arranging the association from the established categories. As the result of the analysis, beside the livelihood strategy in Merapi prone area, the potency of area for improvement was revealed and proposed to local community and government [Creswell, 2010].
Regarding to the livelihood asset of household, this research used the scoring system in Bishop [2005] that divided the value into low, middle and high category. he scoring system for low value was up to 2 point, 3 for middle value and 4-5 for the highest value. Each of livelihood asset consisted of related factors that contributed to value.
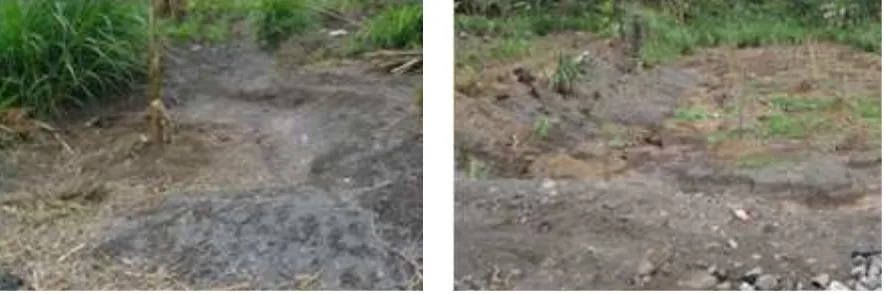
he change in biophysical component was presented by decreasing in farming activity due to land availability; People in Kalitengah Lor, Kalitengah Kidul and Srunen have primary livelihood activity which is farming and sand mining. But based on the information from ieldwork, farming activity was decreasing in productivity due to the impact of eruption (Figure 3). Next picture show the condition of farming land which is abandoned.
Increasing in sand mining activity; Due to farming cannot give optimal yield that make some people turned into sand mining activity which was available everywhere. here were eleven households out of thirty that got advantages from sand mining. Limitation access to beneicial resource; Access, as the important factor of biophysical component, to sand mining resources was limited and cannot be exploited by everyone. here was
an indication about informal rule that roles the sand mining activity. he fact, the household member who works on sand mining is dominated by Srunen people, from eleven household respondents who work on sand mining, seven of them were from Srunen which was 70% of them.
Some conditions described the change in political and legal component: Government opposition; All respondents in Kalitengah Lor, Kalitengah Kidul and Srunen agreed with their commitment to live there. No government facilities; Government buildings and oicers were not active since the Regent Regulation about Merapi danger zone issued. he inexistence of school had forced some people living apart from their family, for farming as the livelihood. his case described how important the livelihood that was provided by this area. Beside the decision to live apart as the consequence, the absence of education facilities had forced some children stopped their education. But the government programs, cheap rice which is provided by Bulog (Logistics Agency) and health insurance, are still continuing; the role of government in providing food, had inluenced the strategy in livelihood which make people do not have to put extra efort in gaining basic needs for foods, therefore they can concentrate on another needs.
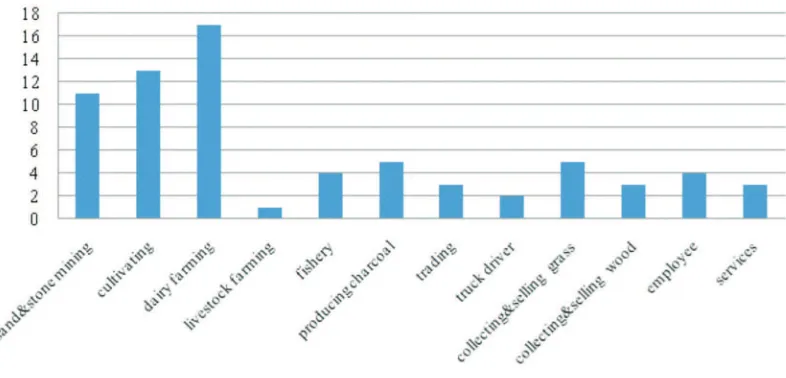
he fact stated that the economic value is higher than the risk and people focused on the most beneicial livelihood resource; In case of the access to resources was unlimited or accessible to anyone, people can decide what strategy is the best for them whether they focused on one which is the highest income activity or diversiied their job. People diversiied their livelihood as optimal as they can; Livelihood diversiication of the respondents was described by the Figure 4.
he amount of livelihood diversiication was more than the number of labors, which is only 68 persons, since one person could have more than one job. he favorable livelihoods were dairy farming, cultivating and sand and stone mining in Kali Gendol respectively, which all of them are primary sector. Sand mining, dairy farming and cultivating is the favorable livelihood; he income of respondents based on livelihood is shown in Figure 5 and Figure 6.
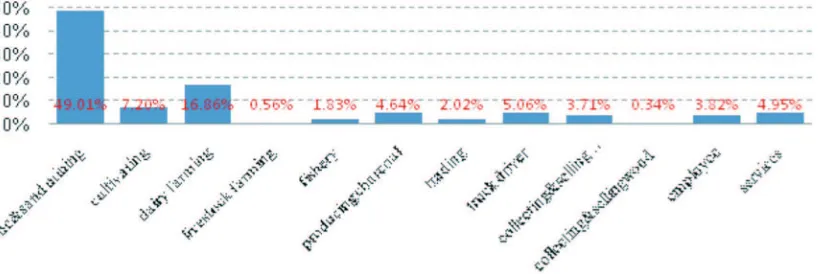
he of-farm dominated the household income. Comparing to others, it is the most beneicial livelihood resource now but not for the condition ater 2010 eruption due to an indication of the role of capitalist in sand mining that afected the local people opportunity since the use of machines in working.
he percentage of income from existence livelihood in Kalitengah Lor, Kalitengah Kidul and Srunen was dominated by stone and sand mining. 49.01% of total respondents income came from this livelihood whereas the respondents who do this only 11 persons. It indicated the high value of it as stated in biophysics component that make certain people coped the area for mining. his condition make people who do not involve in it diversify their livelihood as strategy in optimizing the income.
he second highest income percentage was provided by dairy farming. Since the suitable of the area for dairy and the availability of Koperasi (cooperative institution) which manage this business by managing the trading and providing the fodder concentrate. Cultivating gave only 16.86% of entire income meanwhile there were 13 households had it as livelihood. he strategy of livelihood was based on economic value, but the calculation showed that some households gained more income than the others who diversiied their livelihood.
It emphasized that the diversiication as the livelihood strategy did not guarantee a higher income. People do not do any adjustment related to Merapi condition and keep working on their daily livelihood as usual.
Beside the decreasing in assets and income, there is also the increasing of needs; people had to give an extra efort just for fulilling the basic needs. But all of them believe that their life are going to be better.
People in this prone area have a very good social network; Social value can be divided into community and personal value. Social aspect in community referred to social network that encourages and has an important role for people in living in the prone area. he social network in Kalitengah Lor, Kalitengah Kidul and Srunen was constructed by the hazard experience they had. he value can be in the form of helping each other in building houses ater eruption
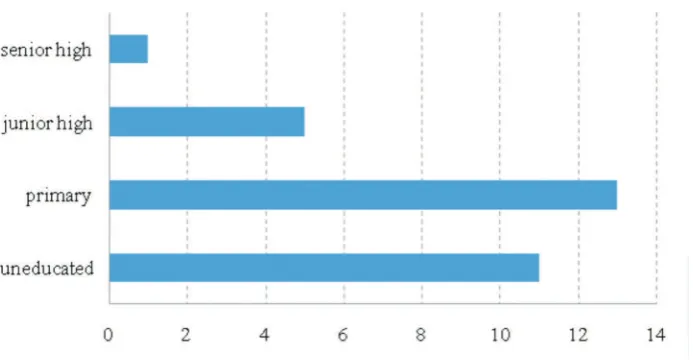
or giving something to each other. Most of the local community had primary education (Figure 7); he social component also considered personal value, their capability and capacity that afected people in choosing their livelihood.
Less of knowledge about repose period; Most people did not exactly know what the repose period is. Even though ater the explanation about it, they still did not think it as important issue that need to be considered at that time.
Dependency on religious values and belief; he choices and values were determined by the beliefs that God rules everything and people just accept what had become their destiny. Having a cow is a must; he culture component inluenced the way of people managed their livelihood resources as part of the strategy. In Kalitengah Lor,Kalitengah Kidul and
Figure 5. Percentage of Livelihood in Household Income
Srunen, cultivating and having livestock, in this case is cows, is a must. Cultivating is a culture; For people who lived surround Merapi, including Kalitengah Lor, Kalitengah Kidul and Srunen, cultivating had become the culture. Even though they had other livelihood resources, they keep cultivating and planting some crops.
he psychological was always could be a reason for ignoring the economic, social or other components. here are some condition in this category; people did not consider Merapi volcano as a threat; local community cannot believe in outsider judgment about their fade since they believed that it would not harm their life. People assumed Merapi as living thing; Some people called Merapi volcano as Mbah (nickname for old people). In real life, people had to respect to old people, that is why people surround Merapi keep living in harmony with harmony. But people become more religious and war.local community realize that sand mining was not considered as a permanent livelihood; the chosen for livelihood activity was not only based on the resource which gave the highest income but but people still considered about the efort in doing it and risks. People prefer to not consider about the loss; even though all people around Merapi were not afraid living with Merapi, but the eruption occurrences still give efects on their way of thinking; people realized that life was not only about prosperous but also the quality and convenience.
here are some values of these hamlets compare to relocation area;
- he availability of livelihood resources - he fresh air and good environment - Suitable area for dairy farming - Arable land
- he existence of sand mining - Family relationship
- he opportunity to live there - Personal property and assets
All the respondents stated the same about their occupied land; it was a legal and valuable asset which is quite large; at least 500 m2 to 4 Ha of land per household.
According to Gottret and White [2002], it was important to classify the household based on its assets in analyzing the livelihood strategy which based on assets scoring by Bishop [2005]. he livelihood assets involved education level, household size, household labor, social network, livelihood diversiication, livestock ownership, income, quality of housing and land ownership.
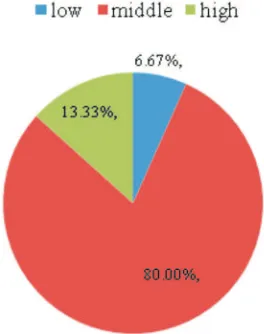
he assets were divided into low, middle and high score. Field survey and interview found that 80% of households sample were in the middle level of welfare, the high and low quality of households livelihood got 13.3% and 6.67% respectively just like in Figure 8.
he livelihood condition also was also indicated by the amount of income (Figure 9). he minimum wage of Yogyakarta province, which is Rp. 892,660.00, is the standard for living in appropriate. Whereas for those who can only fulilled the basic needs for food, equal to Rp. 218,042.00 [Purwantini, 2007], was categorized as very low level. Most of the head of households were male and 57% still in the range of 30 to 50 years old (Figure 10). 33% were more than 59 years old and the rest were 25 years old.
he statistic described the percentage of households head age according to welfare status. he ability and capacity of head of household which was in the same age are more or less the same in earning for living. 100% of low welfare households head were more than 50 year, in this case was more than 59 years old. Based on ield observation and interview, they cannot support their family optimally, even one of them was sick and relied on his children to fulill household needs. heir strategy for living was just for survival, otherwise this household was in a low progress of developing.
he productive age of household head dominated middle welfare status. he strategy found in this case was all the household member can work optimally but
Figure 9. Household Income Level
Figure 8. Welfare Condition Based on Livelihood Asset
they had more needs or limited assets.
he middle and high welfare group was dominated by productive age of household head who also have at least primary education, access to beneicial livelihood resource and high value of natural and physical assets. here was a household which was at high welfare status whose unproductive household head. But the fact that there were two families who live together made it possible for them to live more appropriate.
he gender issue still afected the livelihood strategy. Only 13.33% of the head of household samples were women who are unmarried woman and widows. his condition inluenced the selection for main livelihood which was farming and less diversiication of livelihood. In case of farming, they tend to plant consumable crops only. One of them was in low welfare status, meanwhile the others who live at middle welfare status, got remittance from relatives or live with a family member who can support her life well.
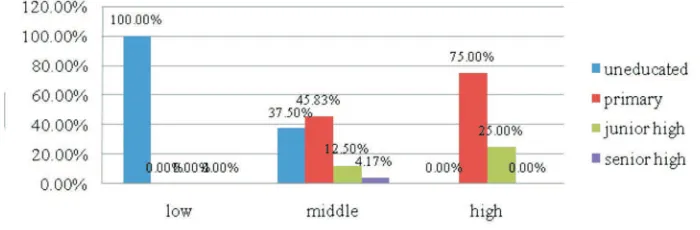
he education degree was divided into uneducated for who was never got formal education, primary that for people who had been literate and gotten the irst education in elementary school (Figure 11). Subsequent to basic education was junior and senior high school for six and nine years of formal education respectively. Education degree and literate condition had important roles in empowering other assets, strategy and decision making. All the households at low assets value were uneducated which less in diversiication of livelihood and time management.
he size of household related to potency and availability of labor, and it determined the welfare. he average of household member related to the livelihood assets level was shown in Figure 12 and Figure 13. he high level had 5.3 members in average meanwhile the middle and low got 3.4 and 2.5 respectively.
he household size determined the strategy for living since the larger the number, the higher the efort for gaining a better life.
he social activities had been proven in easing the
work and reducing cost, for example in building houses, ceremonial, community events and reciprocity. he community prioritize the social event otherwise they will get social sanction.
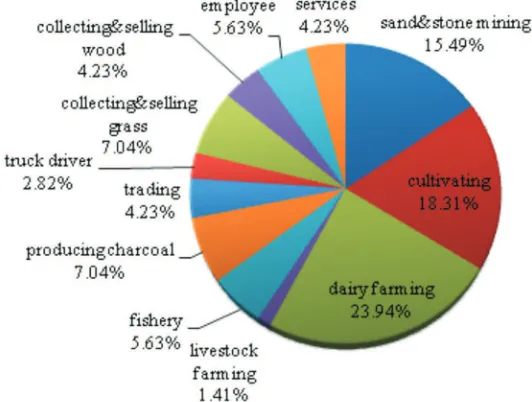
he natural capital was one of the reasons for people to come back to this area. Furthermore the ownership status of their land had been 100% certiied. he main livelihood in this area was dominated by primary sources which are sand mining, dairy farming and farming. It was hard to deine about which the main occupation is since all family members did all they can and diversiied the livelihood as the strategy. he following igure presents the percentage of livelihood availability in research area.
he highest percentage in livelihood diversiication was dairy farming, then cultivating and mining. Services was only got 4.23% which were represented the barbershop, housekeeping and small vendor (Figure 14).
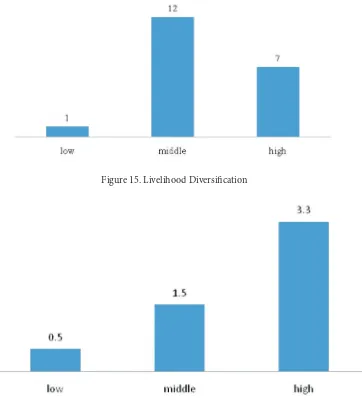
here was no livelihood diversiication in households that had low level of assets. But there were more diversiication in livelihood at middle level than the high one which was 12 and 7 respectively (Figure 15).
Dairy farming as the dominant livelihood related to the number of livestock that respondents had. It had two functions; as the daily income source and savings or investment, as reported by Diwyanto et al. [2001]. herefore there were more livestock in group of high welfare, as described in Figure 16.
Most of people in research area prefer to save in livestock than bank or other institution. It was more beneicial since livestock value is increasing [Diwyanto, et al., 2001].
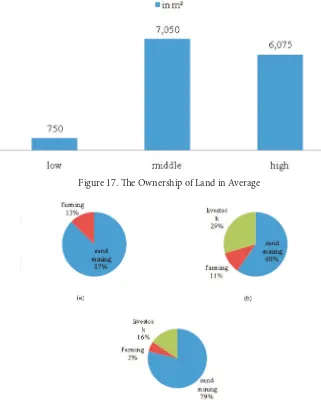
he second position of livelihood activity was farming. he correlation between welfare status and ownership of land was not in linear way as in Figure 17.
he highest average of land ownership was in the middle level. It indicated the utilization of farmland was not optimal yet. Most of them just fallowed the land
Figure 12. he Average of Households Member Related to Assets Level
Figure 13. he Productive Age of Households
and yield the grass for fodder. his was more beneicial choice due to some condition; It needs extra cost and efort in distribution and the farming product price is uncertain, meanwhile the grass has a obvious price for selling or self utilizing. he other reason is high cost in cultivating. he choice for only plant grass was the strategy for avoiding the loss.
Most of houses are permanent that describe the long term planning to live there. furthermore the public facilities, for example water, road and electricity are in good condition.
he ownership of vehicle has advantages related to livelihood strategy that were reported by respondents; (1) easing people to move from one location to another in doing their works, (2) for reaching the public facilities outside the area; school, medical service, etc. (3) as the transportation for distributing the farming product.
he analysis about income related to the three main income sources; livestock, sand mining and farming. he comparison of those in each level of household assets was shown by the next igures. At the low level
welfare, the biggest part of income came from sand mining. here was no respondent who got income from livestock, as described by Figure 18: (a), the biggest portion came from sand mining. In middle level in igure (b), sand mining activity was still dominated, but there were 29% of the income was from livestock. Like the statement before, this gave the regular income. Meanwhile the portion for farming was smaller than the low level, and it was getting smaller at the high welfare group (c). It indicated that farming did not give a good income, but sand mining activity did and it was supported by the ownership of livestock.
Even though people did not consider the risk of volcano hazard or Merapi repose period, but most of them still have plans for evacuation that were divided into ive categories as described in the Figure 18.
here was no diference in future orientation among those three welfare status. here were ive groups of it that was considered as the most important investment.
4. Recommendations
he analysis was based on the real condition that was observed by ield survey and interview which provided information about it at household level and assets.
Cultivating gave the lowest income per capital. he extra efort and extra cost for distributing and selling the farming yield was stated as one of the reasons.
he basic capital for founding a cooperative farming was the existence of farmer group. Kalitengah Lor, Kalitengah Kidul and Srunen already had more than one farmer groups. he system based on farmer empowering, which farmers was not only as members but also as administrator and management.
here were procedural steps that had to be undertaken [Nuryanti, 2005]; (1) Identifying the potency of area, (2) Organizing the farmer and farmer groups, (3) Determining the technology that will be used, (4) Coordination with agricultural input provider, (5) Consolidation about on-farm activity,
(6) Consolidation about post-harvest activity, (7) Established the distribution network.
Beside the government, farmers can have coordination with non Government Organization or university to guide and support in establishing the cooperative farming system.
Some advantages from crop livestock system as said by Devendra [1997] were diverse and eicient resource use, reduced risk, labor eiciency, low external input, decreasing the dependency of biological and chemical energy, can improve soil fertility, sustainable production system, increasing output and improve the farmer household condition. his area produce amount of forage for fodder and manure for fertilizer. Cassava, as a common crop there, have leaves that has good quality as fodder. It was stated by Lebdosukoyo [1983] in Diwyanto & Handiwirawan [2004] that leaves of sweet potatoes, peanuts, soya and cassava contain 11.3%, 11.1%, 10.6% and 20.4% of protein respectively.
Figure 17. he Ownership of Land in Average
5. Conclusion
his research found that all respondents in research area realize the risk of living in prone area but most of people did not know about the repose period of Merapi eruption. he dependency on the livelihood resources that are available in this area have made them ignored the risk of volcano hazard and refused to be relocated. And the study also reveals that all households in research area had a harder and more diicult life since 2010 eruption because of the loss and degraded land. All land in Kalitengah Lor, Kalitengah Kidul and Srunen have been certiied. his is not worth with the relocation area that was provided by government which is only 100m2 in large. But it is not the only reason; the
opportunity and livelihood availability that are ofered by this area is incomparable.
Regarding to other livelihood assets, most people have only primary education without having any skill or training experience but they have a very good social network and relationship. In physical asset, most of people have permanent house now and at least one motorbike. Water, electricity, roads are in good condition, and each hamlet has Early Warning System for Merapi eruption. But people in this area have very limited access to credit institution whereas many of them need it. In general, based on the assets valuing, most of people live in middle level of welfare. heir strategies in facing the volcanic activity and livelihood depend on the capability of household head and amount of household member and labor.
he favorable livelihood resources are sand mining, dairy farming and farming/cultivating. Sand mining attracts people since it gives instant and regular revenue, but it needs extra efort in doing it and has high risk among other livelihood, and people did not consider it as permanent and long term livelihood. he preference to dairy farming because it is not only gives daily revenue but also as a saving. Meanwhile the largest
area is available for farming, but this sector gives the lowest income for farmer since it has certain constraints which are mainly in post-harvest stage.
he opportunity, livelihood resources availability and certiied land/legal assets have made people in Kalitengah Lor, Kalitengah Kidul and Srunen will never agree to be relocated. But they promised to obey the Early Warning System in case of emergency.
Government and related institutions should have a very good planning in relocating people from Kalitengah Lor, Kalitengah Kidul and Srunen for short time and long term living. Otherwise they must reconsider about the program in relocating this area since it does not guarantee the people with a better life. So, even though they have been relocated, people will keep coming back for livelihood and can be reoccupied this area, again. he better way is just let the people live in their own land with certain term and conditions that are regulated by the government.
Base on land availability and fertility, farming has a good potency as main livelihood for people in Merapi area, but it is not used optimally. Problem that was revealed based on grounded information is the yield distribution process that was uncertainty and costly. It can be solved by creating a cooperative farming system which is from farmer, by farmer and for farmer. Furthermore, to get more advantage in farming activity, farmers have to do the Crop Livestock System to optimize the utilization of crops and nutrients of livestock. Both recommendation need support from government, non-government organization and university.
Acknowledgement
hank to Dr. M. Pramono Hadi for valuable comments and his support during the research and thanks to review for the constructive comments.
Barrett, C.B., Reardon, T., and Web. P (2001), Nonfarm income diversiication and household livelihood strategies in rural Africa: concepts, dynamics, and policy implications. Food Policy 26(4): 315-331. Bishop, C. (2005). Contribution of farm power to
smallholder livelihoods in sub-Saharan Africa, Ag-riculturan and Food Engineering Technical Report. Creswell, J.W. (1994), Research design: qualitative &
quantitative approaches, Sage Publications, London Creswell, J.W. (2010), Research Design, qualitative,
quantitative and mixed approach (in bahasa), Pustaka Pelajar, Yogyakarta.
Devendra, C. (1997), Crop Residues for Feeding Animals in Asia: Technology Development and Adoption in Crop/Livestock Systems, International Livestock Re-search Institute, Kenya.
Diwyanto, K., Prawiradiputra, B.R., Lubis, D. (2001),
Integration of plants and livestocks in competi-tive, sustainable, and democratic agribussinness development (in bahasa), Proceeding of Seminar Nasional Teknologi Peternakan dan Veteriner 2001, Pusat Penelitian dan Pengembangan Peternakan, Bogor-Indonesia.
Diwyanto, K., & Handiwirawan, E. (2004), Phe role of agricultural research and development in support agribusiness crop-livestock (in bahasa), Proceeding of Seminar Nasional Sistem Integrasi Tanaman & Ternak. Puslitbang Peternakan, Indonesia.
Esperanza, L.V., & Luisa, M.M., (2008), Volcanic Risk Exposure, Feelings of Insecurity, Stress, and Cop-ing Strategies in Mexico, Journal of Applied Social Psychology 38(12).
Gottret, M.V., & White, D. (2002), Assessing the impact of integrated natural resource management:
lenges and experiences.
Nuryanti, S. (2005), Cooperative farming model for in-creasing farmer income (in bahasa), Tabloid Sinar Tani, 29 Juni – 5 juli 2005.
Purwantini, T.B., Ariani, M. (2008), Food consumption patterns at rice farmer households, Pusat Analisis Sosial Ekonomi dan Kebijakan Pertanian, Banten-Indonesia.
Sagala, S., Okada, N. & Paton, D (2009a), Modeling the social resilience of mountain communities under volcanic risks. Systems, Man and Cybernetics, 2009. SMC 2009. IEEE International Conference. Sagala, S., Okada, N. & Paton, D (2009b), Predictors
of Intention to Prepare for Volcanic Risks in Mt Merapi, Indonesia, Journal of Paciic Rim Psychol-ogy 3(2): 47-54.
houret, J.C., Lavigne, F., Kelfoun, K & Bronto, S (2000), Toward a revised hazard assessment at Merapi vol-cano, Central Java, Journal of Volcanology and Geo-thermal Research 100(1–4): 479-502.
Voight, B., Constantine, E.K., S.Siswowidjoyo & R. Torley (2000). Historical eruptions of Merapi Vol-cano, Central Java, Indonesia, 1768–1998, Journal
of Volcanology and Geothermal Research 100(1–4):
69-138.