Method Development for Detection of E545A Mutation
PIK3CA
Gene
in Breast Cancer Patients Using Tm Shift SYBR Green I qPCR
Fuad Al Ahwani
1,*, Desriani
2, Utut Widyastuti
1, Suharsono
11Department of Biotechnology Bogor Agricultural University, Jl. Raya Darmaga, Bogor, Indonesia 2Research Center for Biotechnology, Indonesian Institute of Science, Jl. Raya Bogor No. 507,
Cibinong, Indonesia
Abstract
E545A is one of the point mutations, and its frequency is high inPIK3CAgene (3.8%), particularly breast cancer patients in Singapore (13.8%) and Mexico (11.5%). In addition to induce breast cancer, the mutation also caused resistance of antiHER2 in HER2 cancer subtype. The tremendous effect of this mutation was not supported by affordable detection method. This study aimed to develop a feasible and sensitive method for E545A detection. The developing method used Tm and Ct to identify samples. Based on optimization, the best condition was obtained with annealing temperature of 65°C. At this condition, Tm and Ct of each sample were (a) exon 9 (78.4°C and 13.005±0.007) and (b) E5454A (80.4°C and 10.07±0.1). This method also demonstrated good precision as observed in coefficient variance of intra and inter assay (0). Thus, method for E5454A detection mutation was successfully developed.
Keywords: E545A, breast cancer, Ct,PIK3CA, precision, Tm
Introduction
Breast cancer is the most common cancer diagnosed in women. International Agency for Research on Cancer, WHO (2012), reported 1.67 million cases of breast cancer (25%) and 522000 of cases led to the death (14.7%). Mutation of protooncogene to oncogene could be one of factors primarily causing breast cancer. This mutation enhanced activity of proliferation, differentiation, and cell survival (Stare and Jozefowicz, 2008). Phosphatidylinositol4,5bisphosphate 3 kinase, catalytic subunit alpha (PIK3CA) was mutated at 16–45% of breast cancer cases (Margoneet al., 2012).
Mutation ofPIK3CAwas observed in all exons. It was reported that 87.5% of mutation was found at exon 9 (helical domain) and exon 20 (kinase domain) (Mihalceaet al., 2015). The E542 and E545 spots in helical domains and H1047 spot in kinase domains
were found to have the highest mutation activity compared with other spots in PIK3CA in these three spots had a strong oncogenic activity, especially in H1047 spot. Baderet al., (2006) found that induction of E542, E545, and H1047 mutants in CAM (Chorioallantoic membrane) cells of chicken embryo could enhance angiogenesis activity of that cells. Oncogenicity of those three mutant spots was also demonstrated by other previous studies.
In addition to have high oncogenic activity, mutation ofPIK3CAgene in HER2 tumor subtype could also cause resistance of antiHER2 in that tumor. Some antiHER2 such as trastuzumab and lapatinib, that initially could be effective to that tumor, was no more ineffective as presence ofPIK3CA gene mutation. Combination of antiHER2 and PIK3CA seems to be a promising option to such condition (Rexeret al., 2014; AlSukhun et al., 2016).
Based on above description, PIK3CA gene mutation not only showed oncogenic activity, but also could affect drug resistance. Therefore, developing early detection method ofPIK3CA gene is important, especially to determine the most appropriate treatment *Corresponding author:
Fuad Al Ahwani
for breast cancer patients. Currently, commercial kit is only available for common detection mutation inPIK3CAgene such as E542K, E45K and H1047R, while detection method for E545A and other mutation spots are still limited. Operational cost of the available techniques is expensive, primarily due to the use of labeled probe, thus could not well be applied for large scale samples. The presence of affordable and sensitive technique is required primarily to attenuate operational cost and to enhance sample use in large scale. Lower operational cost is expected to reduce detection cost of breast cancer.
Therefore, as an initial step, this current work aimed to develop technique of mutant detection forPIK3CAgene E545A. The use of Tm shift SYBR green I qPCR is economically predicted to show better feasibility since its implementation only requires three unlabeled oligonucleotides and uses affordable dye of SYBR green I. The main principle of this method was to differentiate samples of cancer tissues through observation of Tm (melting temperature) and Ct (Cycle threshold) of resulting amplicons. Due to limitation of samples, the method development was carried out using recombinant plasmid of exon 9 and E545A.
Materials and Methods
DNA template
DNA insert was isolated from breast cancer tissue at M. Djamil Hospital, Padang. Recombinant plasmid at concentration of 3 ng was prepared using pGEM–Teasyvector.
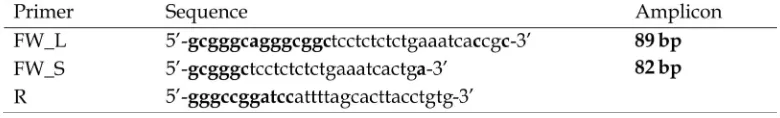
Primer design
Method of Tm shift SYBR green I qPCR used two forward primers and single reverse primer. Each forward primer used similar reverse primer, and designed to distinguish different targets. For this reason, each base
at 3’ terminal forward primer had similar base to the target. Forward primer that could identify exon 9 had A base at 3’ terminal, while forward primer that could identify E545A had C base at 3’ terminal. Addition of mismatch in the third base of 3’ terminal forward primer that could identify E545A was to enhance the specificity of the primer.
To differentiate amplification product, GC bases was added with different lengths in both forward primers. The bases was not complemented with genomic sequence. According to Wanget al., (2005), 14 GC was used in forward primer of E545A, and 6 GC for exon 9 (Table 1). This would resulted in different Tm and Ct for both amplicons. Primer that could identify E545A and exon 9 was called as long primer and short primer, respectively. The presence of the additional GC bases is potentially caused imbalanced GC base in 3’ terminal from resulted amplicon. Thus, high GC bases was added in 5’ terminal of reverse primer (Table 1), which was expected to balance GC distribution in amplicon and to increase the profile of formed peak.
Optimization of Tm shift SYBR green I qPCR technique
This optimization step consisted of two types: optimization 1 (low annealing temperature (54.4–62°C), with extension phase and low concentration of long primer), and optimization 2 (high annealing temperature (63–65°C), without extension phase and high concentration of long primer) as presented in Table 2. Optimization was carried out using CFX 96 thermal cycler, Biorad.
Amplification of optimization 1 involved 1 cycle predenaturation at 95°C for 3 min; 34 cycles consisting of denaturation at 95°C for 10 sec, annealing at 54.4–62°C for 30 sec, and extension at 72°C for 3 min. Amplification of optimization 2 involved 1 cycle pre
denaturation at 95°C for 3 min; 34 cycles consisting of denaturation 95°C for 10 sec, annealing at 54.4–62°C for 30 sec. Melting curves of both optimizations were obtained by gradual enhancement of reaction temperature (65–95°C) with ramping rate of 0.2°C/s. Reaction of qPCR was carried out in a single tube. Composition of qPCR consisted of 3 ng DNA plasmid, 10 pmol primer fw (long and short) and reverse 10 pmol, 5 µL Kapa SYBR fast master mix (2X) Universal, and 3.23 µL nuclease free water.
Statistical Analysis
Statistical analysis was performed using ttest or MannWhitney U to understand GC distribution in exon 9 and E545A amplicon. Prior to ttest, normality test was performed. If data were normally distributed, ttest was performed. MannWhitney U test was performed if the data did not meet normal distribution. Coefficient Variance (CV) of intraassay was determined to obtain precision of the developing technique.
Results and Discussion
Normality test and t-test
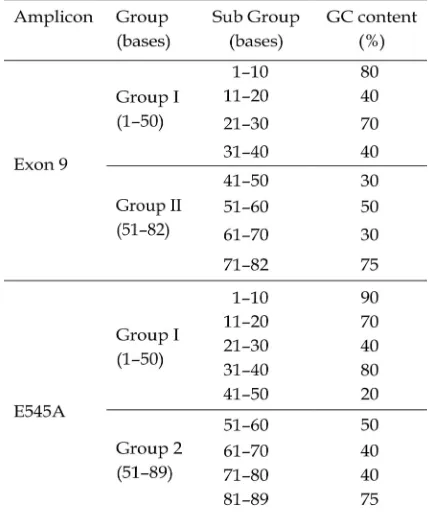
Prior to PCR reaction, it needs to know whether formed amplicon shows bimodal curve or not. Bimodal curve causes distractions of sample identification. Before conducting normality analysis and post hoc test, each sequence was divided into two groups; each consists of 10 bases. Additionally, the sequence was divided into two smaller groups (Table 3).
Normality test Skewness and Kurtosis using SPSS software was carried out by comparing GC content in two sequence groups, exon 9 and E545A. The result demonstrated that data showed normal distribution since the values were in range of 1.96 and 1.96 (Table 4). Ghasemi and Zahediasl (2012) stated that Skewness and Kurtosis data were normally distributed when they were in that range. The data showed normal distribution, then ttest was performed.
Based on data evaluation using SPSS 16 at confidence interval of 95%, T value of exon 9 and E545A was 7.213 and 7.187, respectively and df value of exon 9 and E545A was 7 and 8, respectively. Using T table, T value of exon 9 and E545A at significance level of 0.05 was 1.89 and 1.83 (Table 4). Due to T value > T table, data were not significant (Kim, 2015). This significant result indicated that GC distribution in both amplicons was equal, as well as eliminated potentiality of
Table 2. Technique optimization of Tm shift SYBR green I qPCR.
Table 3.GC content of exon 9 and E545A amplicon sequence.
bimodal curve in further pPCR result (Abtahi et al., 2011).
Optimization of Tm shift SYBR green I qPCR technique
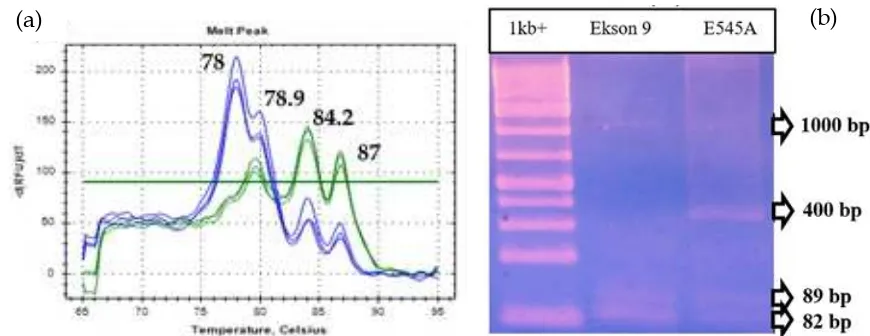
Optimization using condition 1 showed undesirable result as observed by the present of 4 peaks of two target samples. Tm of each peak was 78°C, 78.9°C, 84.2°C, and 87°C (Figure 1a). Unspecific results indicated by presence of 4 bands at 1000 bp, 400 bp, 89 bp and 82 bp were found from optimization 1 (Figure 1b). The occurrence of this nonspecific product suppressed formation of specific product, which could reduce efficiency of amplification reaction. Annealing temperature below optimum condition could be one of factors causing nonspecific amplification (Kennedy and Oswald, 2011). In addition, Saunders and Lee (2013) reported that use of extension phase in PCR reaction with amplicon <100 bp could also lead to amplification of nonspecific product.
In addition to nonspecific amplification, domination of primer fw short to primer fw long was observed as indicated in peak profile of exon 9 sample that was much higher than E545A This is due to activity existence of mismatch primer is lower than that of non mismatch (Dorak, 2006). Increase in concentration of fw long was expected to enhance existence activity of nonmismatch primer.
The use of high annealing temperature and extension phase removal could eliminate
amplification of nonspecific product. Peak at Tm of 84.2°C and 87°C t was not formed in optimization 2. Two other peaks showed higher Tm (78.4°C and 80.4°C).
Presence of two peaks in optimization 2 resulted from activity of both forward. By comparing GC content and Tm, peak 78.4°C was representation of exon 9 while peak 80.4°C represented E545A. Marmur and Dorty (1962) reported that GC content positively correlated with Tm. According to GC content of two amplicon sequences, GC content of exon 9 and E545A was 50% and 56.2%, respectively, meaning that Tm of E545A was higher than that of exon 9.
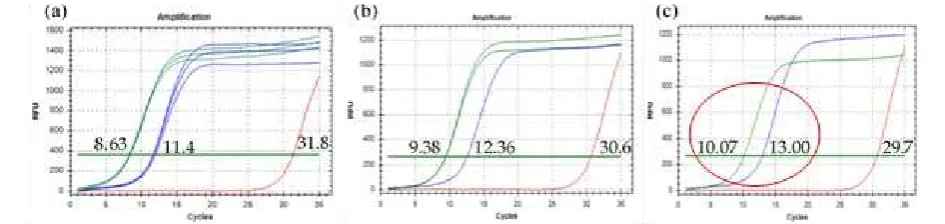
Presence of secondary peak (nontarget) in exon 9 and E545A was negligible, primarily for annealing temperature of 64.3°C and 65°C, because secondary peak was much lower than that of target peak (Figure 2a and c). Inversely, target peak at 63°C for E545A with Tm of 80.4°C was much lower than secondary peak with Tm of 78.4°C (Figure 2a). Annealing temperature of 65°C was selected since target peak of two samples was much higher in comparison with target peak at annealing temperature of 64.3°C (Figure 2c).
Furthermore, Ct (Cycle threshold) value of E545A, Exon 9 and NTC (Non Template Control) also showed differences. Ct reflects the cycle number at which amplification curve crosses the threshold. In the best condition (optimization 2 at annealing temperature of 65°C), Ct was 10.07+0.1 (E545A), 13.005+0.007 (Exon 9) and 29,79±1,28 (NTC) (Figure 3a and
(b)
(a)
b). In other optimization conditions, Ct of exon 9 and E545A was decreased as lower annealing temperature was used. In contrary, Ct of NTC seems increase as lower annealing temperature was used (Figure 3ac). Presence of NTC was common, especially when non specific dye such as SYBR green I was used (Yanget al., 2007). Bustinet al., (2009) reported that NTC was negligible at distance of Ct sample was more than 5 because, in this distance, Ct of NTC and sample was distinguishable.
Using SYBR Green I, Ct could be affected by number of fluorescence unit of amplicon. Higher amplicon fluorescence unit was responsible for lower Ct. Fluorescence unit was determined using model as previously prescribed by Colbornet al., (2008). The model assumed that each AT base pair generated 2 fluorescence units, meanwhile each GC base pair just generated 1 fluorescence unit. Using the model, fluorescence unit of both amplicons could be determined, that is, 123 for exon 9 ((2x41AT) + (1x41GC)) and 128 for E545A ((2X39AT) + (1 X 50GC)) . These results were
in accordance with qPCR result; the highest fluorescence unit (E545A) demonstrated lower Ct. Higher fluorescence of amplicon led to faster movement of signal that crossed threshold (Thornton and Basu, 2011). Different Ct in both amplicons was useful to differentiate both target samples.
Reproducibility and repeatability of developing technique were determined by calculation of coefficient variance of intra assay for both samples. Tm was compared in each replication. Tm showed similar value in each replication: (a) 78.4°C (exon 9) and (b) 80.4°C (E545A) as presented in Table 5. This similarity resulted in the intra assay value of both samples was zero (0), indicating high reproducibility and repeatability of the developing method.
Conclusions
Method for detection of E545A PIK3CA gene was developed in a single tube. The best condition was obtained at optimization 2 with annealing temperature of 65°C. At this condition, sample amplicon of exon 9 and
Figure 2.Optimization 2. qPCR result for exon 9 (blue) and E545A (green). (a) annealing temperature of 63°C; (b) annealing temperature of 64.3°C; and (c) annealing temperature of 65°C.
E545A demonstrated various Tm and Ct. Tm and Ct of exon 9 was 78.4°C and 13.005+0.007, respectively, while Tm and Ct of E545A was 80.4°C and Ct 10.07+0.1, respectively. Using these parameters, exon 9 and E545A samples could be distinguished.
Acknowledgments
This work was supported by these following grant from Laboratory of Medical Molecular Biology and Diagnostic, Research Center for Biotechnology – Indonesian Institute of Sciences Grant No. SP DIPA 079.01.2.450083/2015.3403.002, PI. Dr. Eng. Desriani.
References
AlSukhun, S., Lataifeh, S. and AlSukhun, R. 2016. Defining the prognostic and predictive role of PIK3CA mutations: sifting through the conflicting data. Curr. Breast Cancer Rep., 8(2), 7379 Bustin, S.A., Benes, V., Garson, J.A.,
Hellemans, J., Huggett, J., Kubista, M., Mueller, R., Nolan, T., Pfaffl, M.W. and Shipley, G.L., Vandesompele, J. And Wittwer, C.T. 2009. The MIQE guidelines: minimum information for publication of quantitative realtime PCR experiments. Clin. Chem., 55(4), 611622.
Colborn, J.M., Byrd, B.D., Koita, O.A. and Krogstad, D.J. 2008. Estimation of copy number using SYBR Green: confounding by AT–rich DNA and by variation in amplicon length. Am. J. Trop. Med. Hyg., 79(6), 887892. Dorak, M.T.( 2006) Realtime PCR. New York:
Taylor & Francis Group.
Gashemi, A., Zahediasl, S. 2012. Normality test for statistical analysis: a guide for nonstasticians. Int. J. Endocrinol. Metab., 10(2), 486489.
International Agency for Research on Cancer World Health Organization. 2012. GLOBOCAN 2012: Estimated cancer incidence, mortality and prevalance worldwide in 2012. [Internet]. [diunduh 1 Mei 2016]. Available on: globocan.iarc.fr/Pages/fact_sheets_ca ncer.aspx.
Kennedy, S. and Oswald, N. (2011) PCR troubleshooting and optimization: the essential guide. Norfolk: Caister Academic Press.
Kim, T.K. 2015. T test as a paramteric statistic. Korean J. Anesthesiol., 68(6), 540546. Margone, F.R., Bobrovnitchaia, I.G., Salaorni, S., Manuli, E. and Nagai, M.A. 2012. PIK3CA exon 20 mutatios are associated with poor progosis breast cancer patients. Clinics, 67(11), 1285 1290.
Marmur, J. and Dorty, P. 1962. Determination of the base composition of deoxyribonucleic acid from its thermal denaturation temprature. J. Mol. Biol., 5, 109118.
Mihalcea, C.E., Morosanu, A.M., Murarasu, D., Puiu, L., Cinca, S., Voinea, S.C. and Mirancea, N. 2015. Particular molecular and ultrastructural aspacts in invasive mammary carcinoma. Romanian J. Morphol. Embryol., 56(4), 13711381. Rexer, B.N., Chanthaphaychith, S., Dahlman,
K.B. and Artega, C.L. 2014. Direct inhibition of PI3K in combination with dual HER2 inhibitors is required for optimal antitumor activity in HER2+ breast cancer cells. Breast Cancer Res., 16(1), R9.
Saunders, N.A. and Lee, M.A. (2013) Real time PCR: advanced technologies and applications. Salisbury: Caister Academic Press.
Schultheiss, O.C. and Stanton, S.J. (2009). Assessment of salivary hormones. HarmonJones E, Beer JS, Eds. New York: Guilford Press.
Stare, S.M. and Jozefowicz, J.J. 2008. The effects of environmental factors on cancer prevalance rates and specific cancer mortality rates in a sample of OECD developed countries. Int. J. Appl. Econ., 5(2), 92115.
Thornton, B. and Basu, C. 2010. Realtime PCR (qPCR) primer design using free online software. Biochemi. Mol. Biol. Educ., 39(2), 1451154.
and Germer, S. 2005. Hightroughput SNP geotyping by singletube PCR with Tmshit primers. BioTechniques, 39, 885893.
Widyastuti, P., Ariyanto, A., Triningsih, Susilo, V.Y. and Lestari, W. 2014. Validasi kit radioimmunoassay aflatoksin B1. Prosiding Seminar Nasional Sains dan Pendidikan Sains IX, 5(1), 518522.