Electronic copy available at: https://ssrn.com/abstract=2972668
Managerial Ability and Bank-Loan Pricing
Gus De Franco
Rotman School of Management University of Toronto [email protected]
Ole-Kristian Hope Rotman School of Management
University of Toronto [email protected]
Ross Haihao Lu
Rotman School of Management University of Toronto [email protected]
May 23, 2017
Acknowledgements
Electronic copy available at: https://ssrn.com/abstract=2972668
Managerial Ability and Bank-Loan Pricing
Abstract
This paper examines the impact of borrowers’ managerial ability on lenders’ bank-loan pricing and the channels through which managerial ability affects bank-loan pricing. Using a large sample of U.S. bank loans, we provide evidence that higher managerial ability is associated with lower bank-loan prices. This effect is stronger in firms with high information risk, suggesting that an important channel for managerial ability to affect bank-loan pricing is through improved financial disclosure to mitigate information asymmetry. The relation is also stronger for firms with weak business fundamentals, implying that another channel is through improved business performance. Of these two mechanisms, path analysis suggests that the business-fundamentals mechanism is the more important channel through which managerial ability affects bank-loan pricing.
1 Managerial Ability and Bank-Loan Pricing
1. Introduction
Managerial ability is a critical factor in banks’ lending decisions as lenders consistently cite lack of management skill as the principal reason for loan default (Equinox 2001). Rating agencies, for example, exert significant effort in evaluating firms’ management when assigning credit ratings, as “management strategy, decisions, and policies affect all aspects of a company’s activity” (Standard and Poor’s 2008). Despite the importance of managerial ability in the eyes of lenders and credit agencies, empirical research investigating whether manager ability affects bank-loan pricing is scant.
Conceptually, managerial ability could affect bank-loan pricing through several mechanisms. For example, high-ability managers can achieve better firm performance by selecting better projects and implementing them more efficiently. High-ability managers can also provide more reliable financial reports or use other signals to establish credibility and reduce information risk faced by lenders. This paper empirically investigates whether managerial ability affects bank-loan pricing by examining 15,346 bank loans to non-financial firms. We find that firms with superior managers tend to have a lower cost of debt, controlling for numerous loan and firm characteristics as well as economic conditions.
2 literature in debt contracting, our main measurement for cost of debt is the all-in-drawn spread. Alternatively we use credit ratings and total-cost-of-borrowing (Berg et al. 2015) to measure cost of debt. Furthermore, we employ a change analysis focusing on firms with CEO turnover. We also use simultaneous equations models (Bharath et al. 2011), as lenders often determine loan terms simultaneously. Our inferences are robust to these additional tests.
After examining whether managerial ability helps reduce the cost of debt, the next question we examine is how managerial ability affects the cost of debt, that is, through what channels is the effect achieved. This issue is important because understanding the detailed mechanisms helps us learn more about the validity of our observed association. Economic theory suggests that high-ability managers can use costly mechanisms, such as solid business fundamentals or high-quality disclosures, to achieve better pricing from lenders. Based on information economics, we expect that when information asymmetry is greater, high-ability borrowers have more incentives to signal their true types and lenders have more incentives to assess managers’ ability. As a result, we partition samples by the probability of informed trading (PIN) and abnormal accruals. Consistent with our expectation, we find that the relation between managerial ability and cost of debt is more pronounced when borrowers have a high probability of informed trading or have high abnormal accruals. These findings suggest a disclosure mechanism through which managerial ability can affect bank-loan pricing.
high-3 risk borrowers, suggesting a fundamental mechanism through which managerial ability affects bank-loan pricing.
To further identify these two mechanisms, we employ path analysis using the same set of proxies for the disclosure channel and the fundamental channel. We conclude that both channels are supported and that the fundamental channel is the major mechanism. More than one third of the managerial ability effect is achieved through the fundamental channel; a smaller portion is through the disclosure channel, and the remaining part is through other un-modeled channels.
This study contributes to the literature by adding to the emerging research on the determinants of bank-loan contracting.1 To our knowledge, Rahaman and Zaman (2013) is the only other paper that relates managerial ability to the cost of external debt financing. They use the managerial-ability data set from Bloom and Van Reenen (2007), who examine 169 mid-size U.S. manufacturing firms on 18 different managerial practices in four categories: operations, monitoring, targets, and incentives, and use an aggregate score to represent managerial ability.
Our paper differs with Rahaman and Zaman (2013) in several ways. First, our sample includes a much broader scope of companies. Specifically, our sample consists of 3,093 firms across industries. Second, our research explicitly tests the transfer mechanisms through which managerial ability affects bank-loan pricing. We show that managers can signal their strength by achieving high future cash flows and by making better disclosures, with the former being the more significant channel.
4 2. Literature Review and Hypotheses Development
A firm’s management matters to companies and investors. Prior research shows that
managers influence firms’ strategy, disclosure policy, as well as operating and financing decisions. For example, Bertrand and Schoar (2003) show that managers develop unique individual-specific styles in operational and financing decisions, and exert idiosyncratic influence on firms’ corporate decisions.
We expect managerial ability to be negatively associated with bank-loan pricing for two reasons. First, high-ability managers are likely to select better projects and implement them more efficiently, leading to better future operating performance and lower default risk. This association between management and firm performance is intuitive and is also empirically supported. For example, prior research suggests that executive leadership can explain as much as 45% of an organization’s performance (Day and Robert 1988). Orser (1997) finds that owners’ breadth of
experience is positively associated with both strategic-planning practices and high performance. Barr, Seiford, and Siems (1993) and Leverty and Grace (2012) demonstrate that more competent managers are associated with lower likelihoods of bankruptcy in the banking and insurance industry. Chemmanur and Paeglis (2005) document that firms with better managers have stronger post-IPO operating performance because better managers are likely to better select and implement projects. Demerjian, Lev, Lewis, and McVay (2013) compare firms’ performance before and after a new CEO is appointed and show that firms hiring better managers experience improvements in operating performance. As better firm performance should reduce the cost of debt (Strahan 1999), an indirect connection exists between managerial ability and cost of debt.
5 borrowers’ financial reports more efficiently with lower information acquisition and processing costs, and thereby offer loans at a lower rate. Several studies provide evidence that managers significantly influence financial reporting. For example, Bamber, Jiang, and Wang (2010) find that managers affect voluntary financial disclosure. Baik, Farber, and Lee (2011) conclude that firms with high-ability managers issue more accurate forecasts compared with firms with low-ability managers and that the likelihood and frequency of management earnings-forecast issuance increases with managerial ability.
In contrast to the above studies, Francis, Huang, Rajgopal, and Zang (2008) use media citations as a proxy for CEO reputation and find that more reputable CEOs are associated with poorer earnings quality. Francis et al. (2008) propose a matching hypothesis, arguing that firms with poor earnings quality have more demand for reputable CEOs. By contrast, Demerjian et al. (2013) reexamine the relation between managerial ability and earnings quality and suggest that Francis et al.’s (2008) finding is partly due to the impact of fundamental firm characteristics on the accruals-quality measure. Using a modified accrual model, Demerjian et al. (2013) argue that high-ability managers are associated with higher persistence of earnings and accruals as well as higher-quality accrual estimations. Moreover, they find that firms with high-ability managers have fewer subsequent restatements and lower errors in bad-debt provisions.
6 Rajan and Winton (1995) suggest that asymmetric information and agency costs affect the price and terms of debt.
Despite the positive effects of high-ability manager on firm performance and on disclosure quality, some researchers find that high-ability managers are associated with higher cost of equity (Eisfeldt and Papanikolaou 2013; Mishra 2014). They argue that higher general managerial ability may lead to higher agency problems because a manager’s incentives may not be aligned with those of the firm and its shareholders. Also, high-ability managers are more likely to take risky projects and they can leave the firms when their outside employment options exceed their inside value if they stay in their current company.2
Private loan lenders, however, are different from shareholders in several ways. First, the agency problems between management and creditors are different from those between management and shareholders. In particular, the priority of creditors is superior to that of shareholders in case of financial distress or bankruptcy. As a result, an action that decreases shareholders value may not necessarily increase creditors’ risk. Second, creditors are sophisticated institutional investors and care more about downside risk than shareholders. Prior literature has well documented the monitoring role of creditors to reduce firms’ agency problems. Creditors have greater incentives and abilities to monitor management behaviors through debt contracting and should be able to better assess management ability than shareholders via their access to private information in their due diligence process. Third, many loan contracts include
7 negative covenants that constrain companies from conducting projects risky to creditors. For example, borrowers usually are not allowed to conduct large merger and acquisition projects without creditors’ permission. All factors mentioned above could lead to different effects of managerial ability on cost of debt than their effects on cost of equity. Based on the above discussion, our first and primary hypothesis (stated in the alternative) is:
H1: Higher managerial ability is associated with lower bank-loan pricing.
Information asymmetry between lenders and borrowers is crucial in debt contracting. If information asymmetry is high, lenders will invest heavily in information production and exert costly effort in due diligence to better assess borrowers. After a loan is initiated, lenders still need to closely monitor the borrower to avoid suboptimal use of capital by borrowers. The information frictions, however, may be mitigated by high managerial ability if more capable managers are more likely to provide more transparent disclosure in the future. We expect the extent to which managerial ability affects bank-loan pricing increases with information asymmetry.
From a borrower’s perspective, firms tend to adopt better management practices to reduce information asymmetry when having greater needs for external capital. From a lender’s perspective, banks have more incentives to screen the firm’s quality and monitor the contract terms when the information asymmetry between borrowers and lenders is greater. When managerial ability of borrowers is high, lenders have more confidence that borrowers will provide better information in the future. Such enhanced disclosure quality will enable lenders to better monitor borrowers’ default risks. Therefore, our second hypothesis is as follows (stated in the
8 H2: The negative association between managerial ability and bank-loan pricing is more pronounced when information asymmetry is high.
Bank-loan pricing is highly correlated with firms’ bankruptcy risk. When bankruptcy risk is high, lenders ask for higher loan spreads to compensate for the risks of losing money in case of default. We expect that, in the case of lending to a high-risk borrower, lenders have high degree of uncertainty regarding the borrower’s ability to repay the debt. As a result, creditors rely more on the borrower’s management team to generate adequate future cash flow and have stronger incentives to assess management quality. Higher ability managers can be considered as to be leading indicators of strong cash flow in the future. Therefore, our third hypothesis is as follows (stated in the alternative):
H3: The negative association between managerial ability and bank-loan pricing is more pronounced when business fundamentals are weak.
3. Sample Selection and Research Design
3.1. Sample Selection and Data
9 example, in July 2005, Burger King Corp. refinanced its credit facilities in one loan package, which includes a revolving facility, term loan A, and term loan B. We treat each facility as one observation given that each facility has its own specific loan characteristics.3
We exclude financial-service firms given the uniqueness of their asset structure and revenue-generation process. We then merge the DealScan data with the Compustat database to obtain financial-accounting information, and with the interest-rate database on the Federal Reserve’s website to estimate the overall lending environment and market conditions.4
Observations with missing values are excluded. This process results in a final sample of 15,346 bank loan facilities.
3.2. Research Design
To test our hypothesis about the impact of managerial ability on the cost of debt, we estimate the following model:
Cost of Debt = β0 + β1 Managerial Ability + βi Loan Characteristics + βj Borrower Characteristics + βk Market Conditions
+ Industry FE + Year FE+ (1)
Cost of Debt refers to the logarithm form of drawn spread over LIBOR. The all-in-drawn spread is defined as the annual spread paid over LIBOR for each dollar all-in-drawn from the loan. To increase the robustness of our results, we also use Total-Cost-of-Borrowing (Berg,
3 This treatment may put more weight on borrowers who have one borrowing package containing multiple types of facilities. In a robustness test, we also partition samples by facility type and inferences remain intact.
10 Saunders and Steffen 2015) and credit rating as alternative proxies for cost of debt. Our main proxy for managerial ability is MA_DEA, a measure using Data Development Analysis (DEA) consistent with Demerjian, Lev, and McVay (2012).
To construct MA_DEA, we first employ DEA to estimate firm efficiency within industries by comparing the sales generated by each firm conditional on the inputs used by the firm. Following Demerjian et al. (2012), we use sales as our output and seven other accounting inputs, consisting of cost of goods sold, SG&A, PP&E, operating leases, R&D, goodwill, and other intangibles. Specifically, we solve the following optimization problem by industry year:
max � = � + �& + & + � +� & + � ���+ ℎ � ��� (2)
We then separate managerial ability from firm efficiency estimated above by excluding the effects of key firm specific characteristics that may affect management’s efforts. Following Demerjian et al. (2012), we estimate the following regression model by industry:
Firm Efficiency = β0 + β1 ln(Total assets) + β2 Market Share + β3 Free Cash-Flow Indicator + β4 ln(Age) + β5 Business-Segment Concentration
+ β6 Foreign-Operation Indicator + Year Fixed Effects + (3)
Foreign-11 Operation Indicator equals one if the firm-year observation has foreign currency adjustments in its financial reports, zero otherwise.
The residual from the estimation of equation 3 is then attributed to the management team. We then rank the original measure by deciles. A value of 0 represents the lowest decile of managerial ability and a value of 9 represents the highest decile of managerial ability.
Following prior research (e.g., Strahan 1999; Bharath, Sunder, and Sunder 2008; Francis, Hasan, Koetter, and Wu 2012), we control for a multitude of factors across three categories, namely loan characteristics, firm characteristics, and market conditions. In addition, we control for year and industry fixed effects. The Appendix provides detailed definitions for all our variables. Finally, standard errors are clustered by firm.
4. Empirical Results
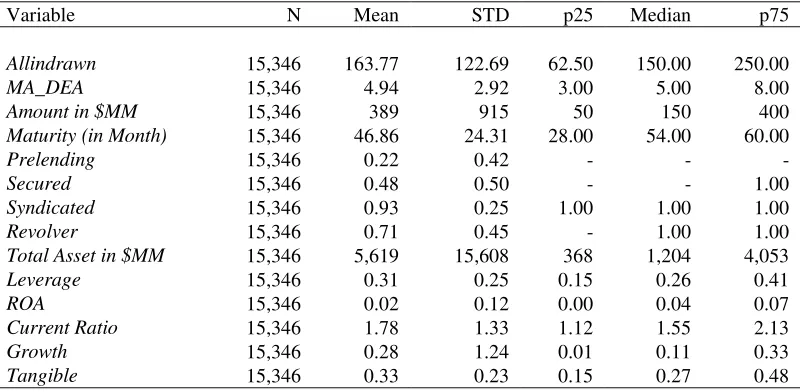
4.1. Descriptive Statistics
We provide descriptive statistics of our main variables and control variables in Table 1. The mean facility amount is $389 million and the mean maturity is 47 months. The mean firm size measured by total assets is $5.6 billion. Among all loans examined, 48% are secured and 93% are syndicated. The mean (median) all-in-drawn loan spread is 164 bps (150 bps), with the 25th percentile at 63 bps and the 75th percentile at 250 bps. The loan-spread distribution is lightly skewed higher compared with other papers such as Francis et al. (2012) (mean at 120 bps), mainly because prior research primarily focuses on S&P 1500 firms, which on average have lower loan spreads relative to other non-S&P 1500 firms.
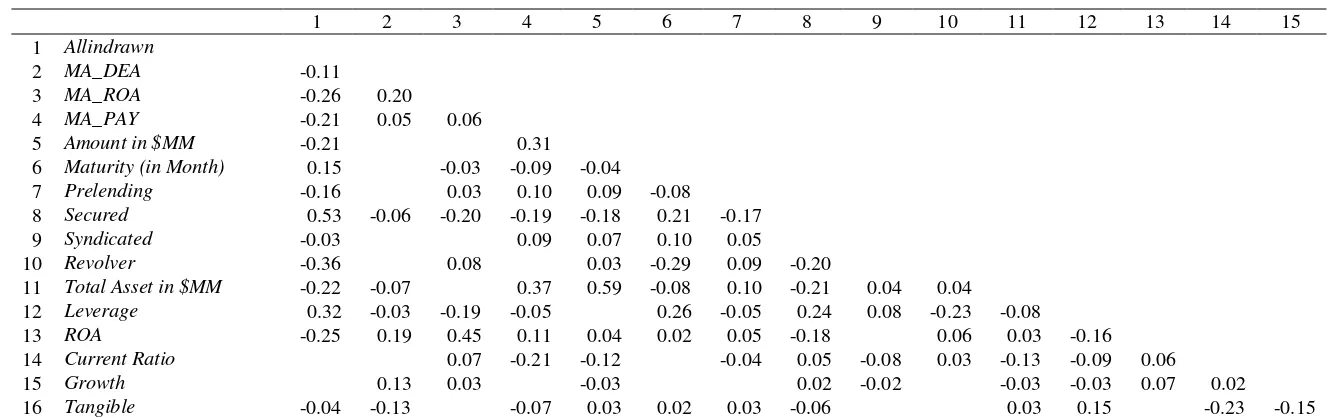
12 Managerial Ability (MA_DEA) are negatively correlated (correlation coefficient -0.11, significant at the 0.01 level), supporting our first hypothesis. Spread is negatively correlated with amount mainly because lenders are willing to lend more to high-quality borrowers, who have low borrowing costs. Spread is negatively associated with Prelending, showing that repeated borrowing from the same lenders could translate into lower loan spreads. Finally, Spread is positively correlated with Secured, primarily because secured loan usually are riskier.
4.2. Multivariate Analyses
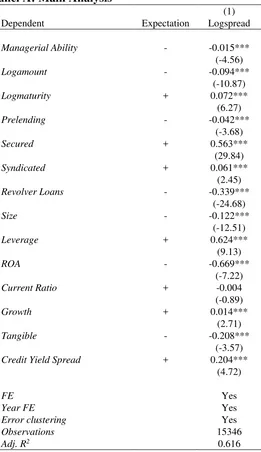
4.2.1. Managerial Ability Effect on Bank-Loan Pricing
In Table 3, we present our empirical analysis of the net effects of managerial ability on bank-loan pricing. Panel A reports coefficient estimates from OLS regression models together with t-statistics for the whole sample. The explanatory power of our model is relatively high with an adjusted R2 of 62%, suggesting that the variables included are important drivers of bank-loan pricing. More importantly, we find a significant and negative association between our proxy for managerial ability and bank-loan pricing, with a coefficient of -0.015 (t-statistic = 4.56), which means for one unit change in managerial ability, bank-loan pricing decreases approximately 2.4 base points.5 If the managerial ability changes from the lowest unit (decile 0) to the highest unit (decile 9), the associated effect on bank-loan pricing would be 22 bps. These results are consistent with the hypothesis that high managerial ability decreases bank-loan spreads.
The estimated coefficients our control variables are mostly consistent with our expectations. Loan characteristics are significantly related to loan spreads. Consistent with prior
13 literature (Costello and Wittenberg-Moerman 2011, Francis et al. 2012), we observe that loans for a larger amount and with unsecured status have lower cost of debt. We find that the coefficient on maturity is positive, indicating that shorter maturities have lower spreads. This relation is consistent with the tradeoff hypothesis under which lenders are compensated for longer maturity loans by requiring a higher rate (Coleman, Esho, and Sharpe 2002).
4.2.2. Change Analysis
The above multivariate analyses show a significant negative association between managerial ability and bank-loan pricing. It is possible that this association is mainly a firm’s fixed effect. That is, some non-time variant firm characteristics could drive the association. To mitigate this concern regarding correlated omitted variables, we conduct a change analysis with stringent controls for firm effects. Specifically, we identify 905 firms that have changed CEOs and also borrowed from a bank before and after the appointment of the new CEO. For each firm, we measure the change in bank-loan pricing, the difference in managerial ability of the two CEOs, and changes in all controls variables before and after the appointment of the new CEO. For this sample of firms, we conduct the following analysis:
Δ Cost of Debt = β0 + β1 Δεanagerial Ability + βiΔControls + (4)
14 result consistent with our expectations.6 In terms of economic significance, if the new appointed manager is one unit better than the prior manager, then the new loan spread is 5.6 bps lower than the spread for the previous loan.7
Overall, the results in Table 3 support our hypothesis that high managerial ability relates to favorable firm borrowing costs. We next investigate the specific mechanisms through which the association works.
4.3. Cross-Sectional Analyses 4.3.1. Disclosure Channel
A borrower can affect bank-loan pricing using several mechanisms. One is to use financial disclosure to credibly signal his true type. When information asymmetry between borrowers and lenders is high, the borrower has greater incentives to signal his true type and lenders have more incentives to assess the borrower’s ability to pay and service the debt. If disclosure is a valid channel, we expect the association between managerial ability and bank-loan pricing to be a function of information asymmetry.
To measure information asymmetry, we use two proxies. The first is discretionary accruals using the residuals from the Kothari, Leone, and Wasley (2005) model. The second is probability of informed trading (PIN) developed by Easley, Hvidkjaer and O’Hara (2002). The underlying theory of PIN is that order flows convey private information to the market. When risk neutral market makers receive the orders, they use Bayesian inference to discover private
6 It is conceivable that the change analysis could capture a bad CEO effect as the firms who change CEOs are often firms with weak performance. To partially address this possibility, we examine the effect for firms with high business risk in Table 5.
15 information and revise quotes accordingly. Assuming that uninformed traders buy and sell randomly, informed trades causes abnormal order imbalance. This PIN is given by
��� =�� + � + ��� (5)
where α is the probability that there is new information at the beginning of the trading day, μ is the arrival rate of orders from informed traders, S is the arrival rate of orders from
uninformed sellers and B is the arrival rate of orders from uninformed buyers. The numerator
represents the arrival rate of information based orders and the denominator is the arrival rate for all orders. A high PIN suggests a greater information asymmetry.8
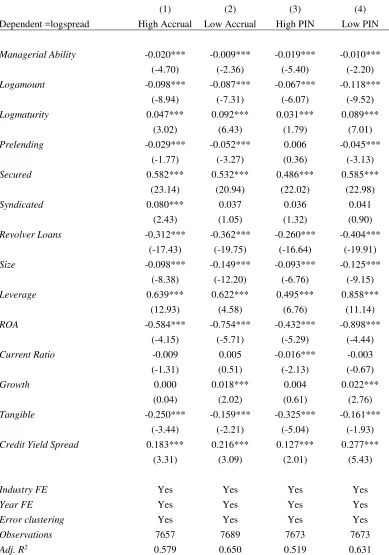
Columns 1 and 2 in Table 4 show that for one unit increase in managerial ability, bank-loan pricing decreases 2.0% for high accrual firms and 0.9% for low accrual firms. Columns 3 and 4 show that for one unit increase in managerial ability, bank-loan pricing decreases 1.9% for high PIN firms and 1.0% for low PIN firms. Untabulated Chi-Squared tests show that both pairs of coefficients are statistically different from each other at the 0.01 level.
To conclude, in line with the information-asymmetry hypothesis, we find that the effect of managerial ability is more pronounced for firms with high information asymmetry. Overall, Table 4 suggests that the effect of managerial ability is consistent with the notion that bank-loan pricing is affected by managerial ability by reducing information asymmetry.
8 We rely on the PIN dataset by Professor Stephen Brown (
16 4.3.2. Fundamental Channel
In addition to mitigating information asymmetry, high-quality management can also directly signal a firm’s positive fundamentals to solicit favorable loan terms. If this mechanism is valid, we should expect managerial ability effects to vary with business fundamentals.
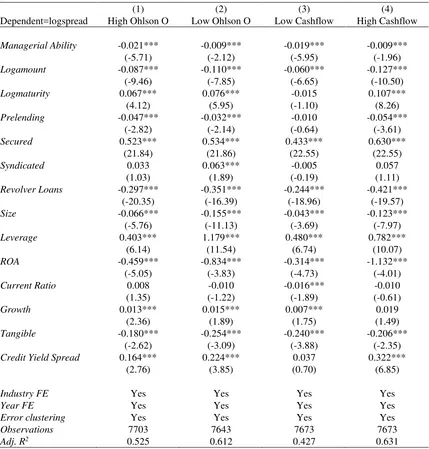
We use two measures to reflect business fundamentals and partition our sample accordingly. The first is the Ohlson O score, which is a multi-factor financial formula to predict bankruptcy (Ohlson 1980). A high Ohlson O score represents high bankruptcy risk. The second is operating cash flow scaled by total assets.
We consider firms as low risk firms when their Ohlson O scores and cash flow are less than the respective industry medians of all sample firms. Table 5 presents our analyses conditional on business fundamentals. In columns 1 and 2, we observe that the impact of managerial ability is more pronounced for firms with high Ohlson O scores. Similarly, columns 3 and 4 show that the managerial-ability effect is also stronger for those firms with low level of cash flows. Chi-Squared tests show that both pairs of coefficients are statistically different from each other at 0.01 level. Based on this evidence, we argue that the managerial-ability effect is subject to the fundamental conditions of the borrowers.
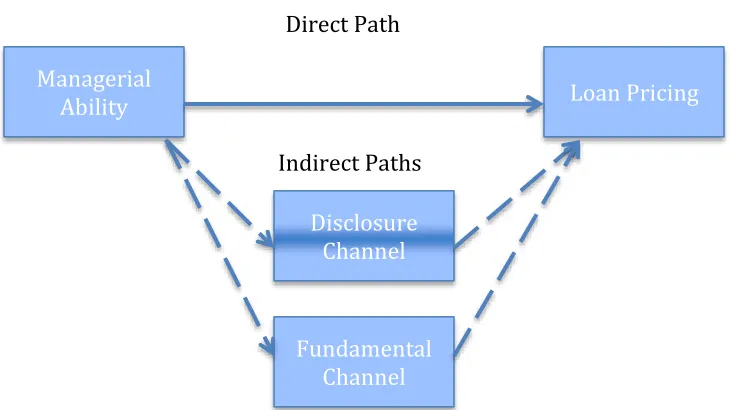
17 4.4. Path Analysis
We study the relative importance of two channels using path analysis. This approach can be viewed as an extension of multiple regressions to decompose various factors affecting an outcome into direct effects and indirect components. In this section, we decompose the relation between managerial ability and bank-loan spreads into a direct path between these two variables as well as indirect paths through disclosure and fundamental channels, as shown in Figure 1. For parsimony, we employ a recursive (all paths flow in only one direction) path model with observable variables. A direct path includes only one path coefficient while an indirect path includes a path coefficient between the source variable and the mediating variable, as well as a path between the mediating variable and the outcome variable. The total magnitude of the indirect path is the product of these two path coefficients. In our study, the source variable is managerial ability; the mediating variables are the disclosure and fundamental channels; the outcome variable is the bank-loan pricing. Accordingly we estimate the following model:
Cost of Debt = a0 + a1 Managerial Ability + a2 Future Fundamental
+ a3 Disclosure + an Controls + (6)
Future Fundamental = β0 + β1 Managerial Ability + (7)
Disclosure = 0 + 1 εanagerial Ability + (8)
In this model, the path coefficient a1 is the magnitude of the direct path from managerial ability to bank-loan spreads. The path coefficient a2 × β1 is the magnitude of the indirect path from managerial ability to bank-loan spreads through the fundamental channel. Similarly, a3 ×
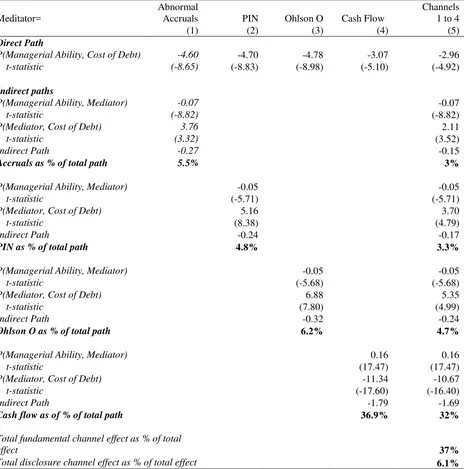
18 We use same four measurements used in cross-sectional analyses to represent the disclosure channel (Abnormal Accruals and PIN) and fundamental channel (Ohlson O and cash flow) and model the four factors simultaneously as mediating variables. Table 6 summarizes the results.9
Columns 1 to 4 present the individual paths for each proxy for the two channels-one direct and one indirect. In Column 1, we use abnormal accruals as the only mediator between managerial ability and cost of debt. The results indicate that the direct path between managerial ability and cost of debt is negative and significant, consistent with previous findings. The path coefficient between managerial ability and the abnormal accruals is negative and significant, suggesting that higher managerial ability is associated with lower abnormal accruals. Moreover the path coefficient between abnormal accruals and the offering yield is positive and significant, suggesting that high accruals relate to high cost of debt. This indirect path accounts for about 5.5% of the total impact of managerial ability on the cost of debt if the abnormal accrual is the only mediator.
Column 2 shows the role of PIN as a mediating factor. We find that that managerial ability is negatively associated with PIN, which is in turn positively associated with cost of debt. The PIN account for 4.8% of total impact in this path. In column 3 and 4, we test the fundamental channel using Ohlson O and future cash flow as mediators, respectively. We find that more capable managers are associated with high future cash flow and low bankrupt risks and that cash flow is the strongest path for managerial ability to affect bank-loan pricing. Ohlson O account for 6.2 % of total path and cash flow account for 37% of total path if we test them individually.
19 In Column 5, we model all four factors simultaneously as mediating variables. Cash flow remains the strongest mediating factor. What is perhaps more informative is the proportion of the total managerial ability effect each mechanism achieves. Column 5 suggests that the fundamental channel account for about 37% and disclosure channel account for about 6% of total managerial ability effects.
In sum, the path analysis indicates that both the fundamental and disclosure channels are effective channels through which managerial ability can affect cost of debt indirectly. Compared with the disclosure channel, the fundamental channel is more significant.
4.6 Robustness Analyses
4.6.1 Alternative Measurements for Cost of Debt
In the main analysis, we use all-in-drawn spread as the dependent variable. Berg, Saunders, and Steffen (2015), however, point out that many syndicated loans contain more than one fee type and contracts typically specify a menu of spreads and fee types. Considering this comprehensive fee structure, they develop the Total Cost of Borrowing (TCB) to measure cost of debts as follows.10
TCB = Upfront Fee/ Maturity + (1-PDD)×(Facility Fee + Commitment Fee)+PDD×(Facility Fee +
Spread)+PDD×Prob(Utilization>Utilization Threshold |Usage >0) Utilization Fee + Prob (Cancellation) ×
Cancellation Fee (9)
20 where the expected loan maturity in years is measured as the difference between the facility start and end dates, PDD is the likelihood that the credit line is drawn down, Prob (Utilization > UtilizationThreshhold |Usage>0) is the probability that the utilization of the credit line is higher than the thresholds specified in the loan contract conditional on observing utilization, Prob (Cancellation) is the probability that the loan is going to be canceled.11
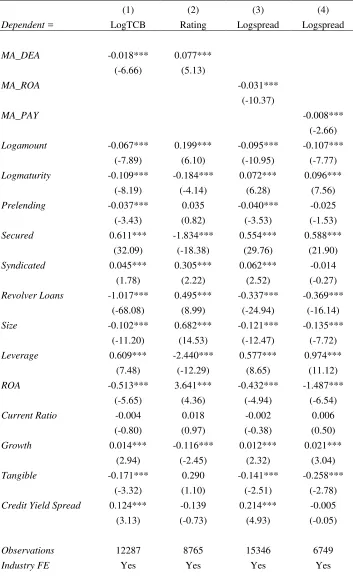
Column 1 of Table 7 presents the result. The MA_DEA coefficient is -0.018, significant at the 0.01 level. We also use the credit rating as an alternative measurement of cost of debts in Column 2 as borrowers with higher credit ratings usually have lower cost of borrowing. We numerically transform ratings provided by S&P or Moody’s from 1 to 13. The value 13 is the highest rating representing AA and above; the value 1 is the lowest rating representing a rating of D. The analysis shows that higher managerial ability is associated with better credit ratings. A positive and statistically significant coefficient of 0.077 on MA_DEA suggest that if the managerial ability moves from the lowest decile unit to highest decile unit, then the credit rating would be approximately 0.7 higher.(0.077 × 9).
4.6.2 Alternative Measurement for Managerial Ability
The main measurement of managerial ability, MA_DEA, may include measurement error leading to biased estimation. As a robustness test, we test two alternative proxies for managerial ability. Motivated by Rajgopal, Shevlin, and Zamora. (2006) and Baik et al. (2011), the first alternative measure is industry-adjusted return on assets (MA_ROA), which is measured as the
21 difference between a firm’s ROA and the industry-average ROA and then scaled by the standard deviation of ROA across the industry. The second is the CEO’s total compensation (MA_PAY), including salary, bonus, and all stock-based compensation. Intuitively, we expect that firms provide competitive compensation to attract talented managers. To make them comparable with our primary DEA-based managerial-ability proxy, both alternative measurements are ranked from 0 to 9, where 0 represents the lowest industry-adjusted ROA or lowest CEO compensation, respectively, and 9 represents the highest industry-adjusted ROA or highest CEO compensation, respectively. Consistent with our main findings, columns 3 and 4 of Table 7 show that both managerial-ability proxies are negatively and significantly related to bank-loan pricing, providing additional credibility to our primary findings.
We next assess the relation between two managerial ability alternative proxies— performance-based and compensation-based—and our DEA-based managerial-ability proxy. The purpose of this assessment is to determine whether all three proxies are independent signals of CEO ability or merely noise. Table 2 shows that the Pearson correlation between MA_DEA score and MA_ROA is 20%, between MA_DEA and MA_PAY is 5%, and between MA_ROA and MA_PAY is 6%. To mitigate the concern that our measures could be capturing noise, in untabulated analyses we alternatively employ the first principal component of the three measurements. No inferences are affected when we use this composite measure. Thus, it is reasonable to believe that each measure captures some aspect of CEO ability.
4.6.3 Alternative Measurement for Information Asymmetry
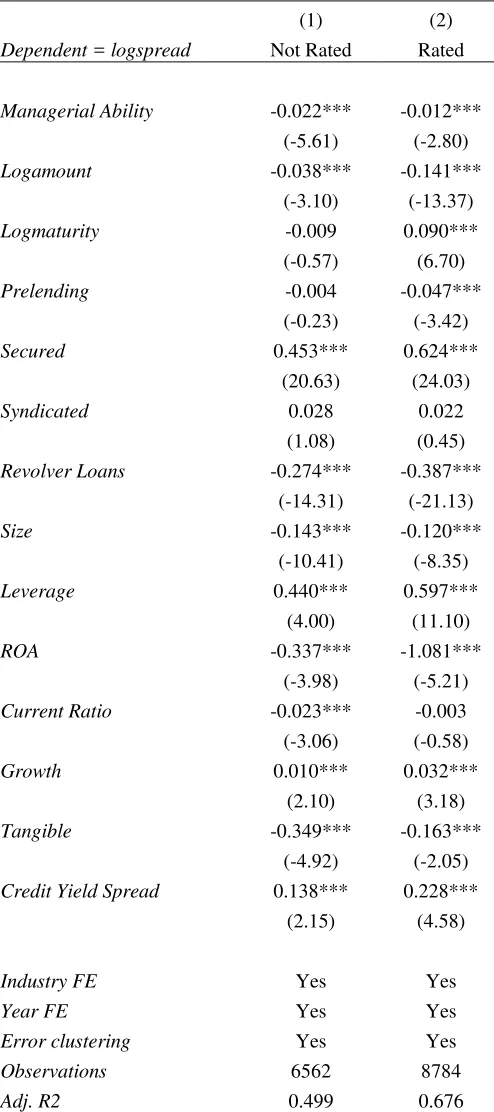
22 significantly associated with loan spreads (Tang 2009; Sufi 2009). Ciftci and Darrough (2016) also find that the absence of credit rating can alter the relation between loan spread and firms characteristics. In Table 8, we test how the relation between loan spread and managerial ability varies with the absence of credit ratings. We find that while both coefficients on Managerial Ability are negative for non-rated and rated firms, the effect is stronger for non-rated firms (for which the estimated coefficient is significant at the 0.01 level).
4.6.4 Simultaneous Structure Models
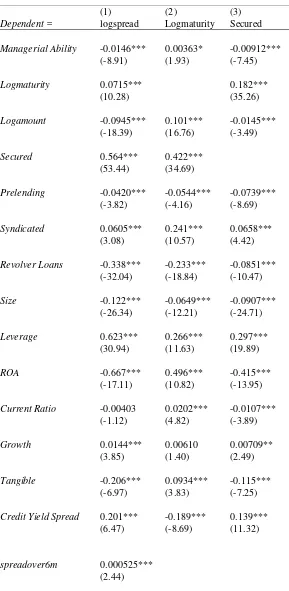
Loan contracts include various contract terms, which interact with each other. This interaction suggests that one cannot examine one loan term in isolation with other terms as many loan terms are negotiated simultaneously. Following Bharath et al (2011), we use following simultaneous structure model to test the relation between loan spread and managerial ability.
Cost of Debt = a0 + a1 Managerial Ability + a2 Secured
+ a3 log(maturity) + a4 IVspread+ an Controls + (10)
Secured = β0 + β1 εanagerial Ability + β2 log(maturity)+ β3IVsecured+
β n Controls + (11)
Log(maturity) = 0 + 1 εanagerial Ability + 2 secured+ 3 IV maturity+ n
Controls + (12)
23 as instruments that affect debt maturity as research finds that the term structures of interests rate alter the present value of the tax benefit, thus affect the optimal maturity of the loan (Brick and Ravid 1991). Based on the evidence in Berger and Udell (1990), we use loan concentration as an instrument for existence of collateral because the greater the current loan borrowing relative to the size of the total debt, the greater the likelihood of a lender asking for collateral. Following Berger and Udell (1990) and Bharath et al (2011), we estimate loan concentration as the new loan amount divided by the total debt amount. In conclusion, the results of the simultaneous model analysis in Table 9 are consistent with our main finding that managerial ability are associated with loan spread.
5. Conclusion
Managerial ability is important to stakeholders, as management strategy, decisions, and policies affect all aspects of a company’s activities. Our study examines the impact of borrowers’ managerial ability on bank-loan pricing and provides evidence on the channels through which it affects the bank-loan pricing. Using loan information from 1990 to 2008, we present empirical evidence that in general, lenders provide more favorable loan prices to firms with higher managerial ability. Equally important, we find that managerial ability affects bank-loan pricing through both disclosure quality and future operating performance.
25 References
Ahmed, Anwer S., Bruce K. Billings, Richard M. Morton, and Mary Stanford Harris. 2002. “The Role of Accounting Conservatism in Mitigating Bondholder, Shareholder Conflicts over Dividend Policy and in Reducing Debt Costs.” The Accounting Review 77 (4) (October): 867–890.
Anderson, Ronald C., Sattar A. Mansi, and David M. Reeb. 2004. “Board Characteristics, Accounting Report Integrity, and the Cost of Debt.” Journal of Accounting and Economics 37 (3) (September): 315–342.
Ashbaugh-Skaife, Hollis, Daniel W. Collins, and Ryan LaFond. 2006. “The Effects of Corporate Governance on Firms’ Credit Ratings.” Journal of Accounting and Economics 42 (1–2) (October): 203–243.
Asquith, Paul, Anne Beatty, and Joseph Weber. 2005. “Performance Pricing in Bank Debt Contracts.” Journal of Accounting and Economics 40 (1–3): 101–28
Baik, Bok, David B. Farber, and Sam Lee. 2011. “CEO Ability and Management Earnings Forecasts.” Contemporary Accounting Research 28 (5): 1645–1668.
Bamber, Linda Smith, John (Xuefeng) Jiang, and Isabel Yanyan Wang. 2010. “What’s Our Style? The Influence of Top Managers on Voluntary Corporate Financial Disclosure.” The Accounting Review 85 (4) (July): 1131–1162.
Barr, Richard S., Lawrence M. Seiford, and Thomas F. Siems. 1993. “An Envelopment-analysis Approach to Measuring the Managerial Efficiency of Banks.” Annals of Operations Research 45 (1) (December 1): 1–19.
Beatty, Anne, K. Ramesh, and Joseph Weber. 2002. “The Importance of Accounting Changes in Debt Contracts: The Cost of Flexibility in Covenant Calculations.” Journal of Accounting and Economics 33 (2) (June): 205–227.
Berg, Tobias, Anthony Saunders, and Sascha Steffen. 2015. “The Total Cost of Corporate Borrowing in the Loan Market: Don’t Ignore the Fees.” The Journal of Finance.
Berger, Allen N., and Gregory F. Udell. 1990. “Collateral, Loan Quality and Bank Risk.” Journal of Monetary Economics 25 (1): 21–42.
Bertrand, Marianne, and Antoinette Schoar. 2003. “Managing with Style: The Effect of Managers on Firm Policies.” The Quarterly Journal of Economics 118 (4) (November 1): 1169–1208.
Bharath, Sreedhar T., Sandeep Dahiya, Anthony Saunders, and Anand Srinivasan. 2011. “Lending Relationships and Loan Contract Terms.” Review of Financial Studies 24 (4): 1141–1203.
Bharath, Sreedhar T., Jayanthi Sunder, and Shyam V. Sunder. 2008. “Accounting Quality and Debt Contracting.” The Accounting Review 83 (1) (January): 1–28.
26 Bloom, Nicholas, and John Van Reenen. 2007. “Measuring and Explaining Management Practices Across Firms and Countries.” The Quarterly Journal of Economics 122 (4) (November 1): 1351–1408.
Bozanic, Z. 2016. “The Ex-Ante Monitoring Role of Accounting Covenants in Public Debt.” Journal of Business Finance & Accounting 43: 803–829.
Brick, Ivan E., and S. Abraham Ravid. 1991. “Interest Rate Uncertainty and the Optimal Debt Maturity Structure.” Journal of Financial and Quantitative Analysis 26 (1): 63–81.
Chemmanur, Thomas J., and Imants Paeglis. 2005. “Management Quality, Certification, and Initial Public Offerings.” Journal of Financial Economics 76 (2) (May): 331–368.
Ciftci, Mustafa, and Masako Darrough. 2016. “Does the Riskiness of R&D Outweigh Its Benefits? The Perspective of US Private Lenders.” Journal of Business Finance & Accounting 43 (5-6): 654– 92.
Coleman, Anthony D. F., Neil Esho, and Ian G. Sharpe. 2002. “Do bank characteristics influence loan contract terms?” Working paper. University of New South Wales.
Costello, Anna M., and Regina Wittenberg-Moerman*. 2011. “The Impact of Financial Reporting Quality on Debt Contracting: Evidence from Internal Control Weakness Reports.” Journal of Accounting Research 49 (1): 97–136.
Day, David V., and Robert G. Lord. 1988. “Executive Leadership and Organizational Performance: Suggestions for a New Theory and Methodology.” Journal of Management 14 (3) (September 1): 453–464.
Dichev, Ilia D., and Douglas J. Skinner. 2002. “Large–sample Evidence on the Debt Covenant Hypothesis.” Journal of Accounting Research 40 (4): 1091–1123.
Demerjian, Peter R., Baruch Lev, Melissa F. Lewis, and Sarah E. McVay. 2013. “Managerial Ability and Earnings Quality.” The Accounting Review 88 (2) (March): 463–498
Demerjian, Peter, Baruch Lev, and Sarah McVay. 2012. “Quantifying Managerial Ability: A New Measure and Validity Tests.” Management Science 58 (7) (July 1): 1229–1248.
Easley, David, Soeren Hvidkjaer, and Maureen O’hara. 2002. “Is Information Risk a Determinant of Asset Returns?” The Journal of Finance 57 (5): 2185–2221.
Eisfeldt, Andrea L., and Dimitris Papanikolaou. 2013. “Organization Capital and the Cross-Section of Expected Returns.” The Journal of Finance 68 (4): 1365–1406. doi:10.1111/jofi.12034.
Equinox Management Consultants Ltd., 2001, Practices and Patterns of Informal Investment, A report prepared for the Small Business Policy Branch, Industry Canada, Ottawa.
Francis, Bill, Iftekhar Hasan, Michael Koetter, and Qiang Wu. 2012. “Corporate Boards and Bank-loan contracting.” Journal of Financial Research 35 (4): 521–552.
27 Kothari, S. P., Andrew J. Leone, and Charles E. Wasley. 2005. “Performance Matched Discretionary
Accrual Measures.” Journal of Accounting and Economics 39 (1): 163–97.
Leverty, J. Tyler, and Martin F. Grace. 2012. “Dupes or Incompetents? An Examination of Management’s Impact on Firm Distress.” Journal of Risk and Insurance 79 (3): 751–783.
Li, Siqi. 2010. “Does Mandatory Adoption of International Financial Reporting Standards in the European Union Reduce the Cost of Equity Capital?” The Accounting Review 85 (2): 607–36.
Mishra, Dev R. 2014. “The Dark Side of CEO Ability: CEO General Managerial Skills and Cost of Equity Capital.” Journal of Corporate Finance 29 (December): 390–409
Ohlson, James A. 1980. “Financial Ratios and the Probabilistic Prediction of Bankruptcy.” Journal of Accounting Research 18 (1): 109–31
Orser, Barbara 1997, “Understanding the influence of intention, Managerial Capacity, and Gender on Firm Growth.” Unpublished PhD Thesis, University of Bradford, UK.
Rahaman, Mohammad M., and Ashraf Al Zaman. 2013. “Management Quality and the Cost of Debt: Does Management Matter to Lenders?” Journal of Banking & Finance 37 (3): 854–874.
Rajan, Raghuram, and Andrew Winton. 1995. “Covenants and Collateral as Incentives to Monitor.” The Journal of Finance 50 (4): 1113–1146.
Rajgopal, Shivaram, Terry Shevlin, and Valentina Zamora. 2006. “CEOs’ Outside Employment Opportunities and the Lack of Relative Performance Evaluation in Compensation Contracts.” The Journal of Finance 61 (4): 1813–44.
Standard & Poor’s, 2008, “Corporate Ratings Criteria 2008”. www.corporatecriteria. standardandpoors.com
Strahan, Philip E. 1999. “Borrower Risk and the Price and Nonprice Terms of Bank Loans.” SSRN Scholarly Paper. Rochester, NY: Social Science Research Network. http://papers.ssrn.com/abstract=192769.
Sufi, Amir. 2009. “The Real Effects of Debt Certification: Evidence from the Introduction of Bank Loan Ratings.” Review of Financial Studies 22 (4) (April 1): 1659–1691.
Tang, Tony T. 2009. “Information Asymmetry and Firms’ Credit Market Access: Evidence from Moody’s Credit Rating Format Refinement.” Journal of Financial Economics 93 (2) (August): 325–351.
28
= A measure of firms’top manager’s competitiveness, which can be proxied by efficiency, performance, or compensation.
MA_DEA = An efficiency-based managerial ability measurement using the Demerjian et al. (2012) model, which is then translated into deciles.
MA_ROA = A performance-based managerial ability measurement, calculated as the difference between a firm’s ROA adjusted y the industry average and then scaled by the standard deviation of ROA across the industry, which is then translated into decile.
MA_PAY = A compensation-based managerial ability measurement, calculated as the CEO’s total compensation adjusted by size, which is then translated into decile.
Loan Characteristics
Logspread = The cost of bank loan, measured as the natural logarithm of the All in Drawn loan spread over LIBOR.
Logamount = The size of the loan, measured as the natural logarithm of the total loan amount.
Logmaturity = The natural logarithm of maturity of loan facility in months.
Prelending = An indicator that equals one if the firm borrowed from the same lender before, zero otherwise.
Secured = An indicator that equals one if the facility is secured, zero otherwise. Syndicated = An indicator that equals one if the facility is arranged as syndicated loan,
zero otherwise.
Revolver = An indicator that equals one if the facility type is revolver, zero otherwise. Logtcb = The cost of bank loan, measured as the natural logarithm of the total cost
of borrowing using Berg et al. (2015) model
Firm Characteristics
Rated = An indicator that equals one if the borrower has external credit rating, zero otherwise.
Size = The natural logarithm of total asset of the borrower. Leverage = The total liability to total assets.
Coverage = The EBITDA to interest expense.
29 Tangible = Tangible assets to total assets.
Growth = Current year revenue divided by prior year revenue. Loan
Concentration
= The current loan amount divided by total debt of the company
Market Conditions Credit Yield
Spread
= A default spread measured as the difference between the yield on Moody’s seasoned corporate bond with a Baa rating and ten-year U.S. government bonds.
Long- Term Yield Spread
= A long-term spread proxy, measured as the spread difference between 10-year treasury bonds and two-10-year treasury bonds.
Mid-Term Yield Spread
= A mid-term spread measured as the spread difference between two-year treasury bonds and six-month treasury notes.
Spreadover6m = The average loan spread over the past 6 month
Fundamental Channel
Ohlson O = The Ohlson O score, a proxy for bankruptcy risk.
Cash Flow = Average operating cash-flow level scaled by total assets over next five years.
Disclosure Channel Discretionary
Accruals
= A signed discretionary accrual using the residuals from Kothari et al. 2005 model
30 FIGURE 1
Path Analysis
Managerial
Ability Loan Pricing
Disclosure Channel
Fundamental Channel Direct Path
31 TABLE 1
Descriptive Statistics
Variable N Mean STD p25 Median p75
Allindrawn 15,346 163.77 122.69 62.50 150.00 250.00
MA_DEA 15,346 4.94 2.92 3.00 5.00 8.00
Amount in $MM 15,346 389 915 50 150 400
Maturity (in Month) 15,346 46.86 24.31 28.00 54.00 60.00
Prelending 15,346 0.22 0.42 - - -
Secured 15,346 0.48 0.50 - - 1.00
Syndicated 15,346 0.93 0.25 1.00 1.00 1.00
Revolver 15,346 0.71 0.45 - 1.00 1.00
Total Asset in $MM 15,346 5,619 15,608 368 1,204 4,053
Leverage 15,346 0.31 0.25 0.15 0.26 0.41
ROA 15,346 0.02 0.12 0.00 0.04 0.07
Current Ratio 15,346 1.78 1.33 1.12 1.55 2.13
Growth 15,346 0.28 1.24 0.01 0.11 0.33
Tangible 15,346 0.33 0.23 0.15 0.27 0.48
32 TABLE 2
Correlation Matrix
1 2 3 4 5 6 7 8 9 10 11 12 13 14 15
1 Allindrawn
2 MA_DEA -0.11
3 MA_ROA -0.26 0.20
4 MA_PAY -0.21 0.05 0.06
5 Amount in $MM -0.21 0.31
6 Maturity (in Month) 0.15 -0.03 -0.09 -0.04
7 Prelending -0.16 0.03 0.10 0.09 -0.08
8 Secured 0.53 -0.06 -0.20 -0.19 -0.18 0.21 -0.17
9 Syndicated -0.03 0.09 0.07 0.10 0.05
10 Revolver -0.36 0.08 0.03 -0.29 0.09 -0.20
11 Total Asset in $MM -0.22 -0.07 0.37 0.59 -0.08 0.10 -0.21 0.04 0.04
12 Leverage 0.32 -0.03 -0.19 -0.05 0.26 -0.05 0.24 0.08 -0.23 -0.08
13 ROA -0.25 0.19 0.45 0.11 0.04 0.02 0.05 -0.18 0.06 0.03 -0.16
14 Current Ratio 0.07 -0.21 -0.12 -0.04 0.05 -0.08 0.03 -0.13 -0.09 0.06
15 Growth 0.13 0.03 -0.03 0.02 -0.02 -0.03 -0.03 0.07 0.02
16 Tangible -0.04 -0.13 -0.07 0.03 0.02 0.03 -0.06 0.03 0.15 -0.23 -0.15
34
Managerial Ability Change -0.034***
(-3.52)
Credit Yield Spread Change 0.577***
(8.76)
35 TABLE 4
Managerial-Ability Effect Conditional on Information Asymmetry Setting
(1) (2) (3) (4)
Dependent =logspread High Accrual Low Accrual High PIN Low PIN
Managerial Ability -0.020*** -0.009*** -0.019*** -0.010***
36
Notes: This table presents an analysis of the managerial-ability effect on bank-loan pricing within subsamples based on information-asymmetry settings. High Accrual refers to companies with abnormal accruals above sample median.
Low Accrual refers to companies with abnormal accruals below sample median. High PIN refers to companies with
37 TABLE 5
Managerial-Ability Effect Conditional on Fundamentals
(1) (2) (3) (4)
Dependent=logspread High Ohlson O Low Ohlson O Low Cashflow High Cashflow
Managerial Ability -0.021*** -0.009*** -0.019*** -0.009***
(-5.71) (-2.12) (-5.95) (-1.96)
Notes: This table presents an analysis of managerial ability effect on bank-loan pricing within subsamples based on various fundamental settings. High Ohlson O refers to companies with Ohlson O score above sample median. Low Ohlson O refers to the companies with Ohlson O score below sample median; Low Cashflow refers to firms with operating cash flow below sample median. High Cashflow refers to firms with operating cash flow above sample median *,**, and *** indicate significance at the 0.10, 0.05, and 0.01 levels, respectively, using two-tailed tests.
38
P(Managerial Ability, Mediator) -0.07 -0.07
t-statistic (-8.82) (-8.82)
P(Mediator, Cost of Debt) 3.76 2.11
t-statistic (3.32) (3.52)
Indirect Path -0.27 -0.15
Accruals as % of total path 5.5% 3%
P(Managerial Ability, Mediator) -0.05 -0.05
t-statistic (-5.71) (-5.71)
P(Mediator, Cost of Debt) 5.16 3.70
t-statistic (8.38) (4.79)
Indirect Path -0.24 -0.17
PIN as % of total path 4.8% 3.3%
P(Managerial Ability, Mediator) -0.05 -0.05
t-statistic (-5.68) (-5.68)
P(Mediator, Cost of Debt) -11.34 -10.67
t-statistic (-17.60) (-16.40)
Indirect Path -1.79 -1.69
Cash flow as of % of total path 36.9% 32%
Total fundamental channel effect as % of total
effect 37%
Total disclosure channel effect as % of total effect 6.1%
39 TABLE 7
Alternative Measurements in loan spread and managerial ability
(1) (2) (3) (4)
Dependent = LogTCB Rating Logspread Logspread
Observations 12287 8765 15346 6749
40
Year FE Yes Yes Yes Yes
Error clustering Yes Yes Yes Yes
Adj. R2 0.747 0.685 0.621 0.644
41 TABLE 8
Alternative Measurements for Information Asymmetry and Fundamentals
(1) (2)
Dependent = logspread Not Rated Rated
Credit Yield Spread 0.138*** 0.228***
(2.15) (4.58)
42
43 TABLE 8
Simultaneous Structure Models
(1) (2) (3)
Dependent = logspread Logmaturity Secured
Managerial Ability -0.0146*** 0.00363* -0.00912***
(-8.91) (1.93) (-7.45)
Prelending -0.0420*** -0.0544*** -0.0739***
(-3.82) (-4.16) (-8.69)
Syndicated 0.0605*** 0.241*** 0.0658***
(3.08) (10.57) (4.42)
Current Ratio -0.00403 0.0202*** -0.0107***
44
(-3.62)
Mid Term Yield Spread -0.0463***
(-3.02)
Loan Concentration 0.0112**
(2.35)
Industry FE Yes Yes Yes
Year FE Yes Yes Yes
Error clustering Yes Yes Yes
Observations 15346 15346 15346
Adj. R2 0.62 0.13 0.26