Relationship between Teacher Interpersonal Behaviour and Students Attitude toward
This paper reports students’ view on teachers’ interpersonal behaviours and the relationship between these perceptions with students’ attitude toward Mathematics in Indonesia lower secondary schools. This study involved 424 students from 17 schools in Central Java, Indonesia. The data were gathered using two questionnaires, specifically the Indonesian version of Questionnaire Teacher Interpersonal (QTI) and Test of Mathematics Related Attitude (TOMRA). The data were statistically analysed using SPSS programme. The results show that the questionnaires are valid and reliable. Cronbach alpha coefficients ranged from 0.65 to 0.86 (for actual) and from 0.69 to 0.93 (for preferred). The students perceive the teacher as having relatively good in leadership and understanding towards students, less uncertainty, dissatisfaction and admonition in the classroom. However, the students show the deficient in their perception on student’s freedom and teacher strictness. Furthermore, there are considerably differences between actual and preferred on all scales of QTI except on Dissatisfaction. There are no significant differences between male and female perceptions on scales of QTI, Leadership, Freedom, Helping, Understanding, Uncertainty, Admonishing and Strict. The results also show that Students Enjoyment have significant correlation with almost all of the scales of QTI, except Students’ Freedom. Finally, the multiple correlation analysis shows that there is a significant correlation between a scale of QTI and enjoyment towards mathematics in which only Admonishing significantly affect Students’ Enjoyment.
Keyword: Teacher Interpersonal Behaviour, Students’ Attitude, Mathematics Classroom
Rationale
In Indonesia, mathematics is an important lesson that has to be taken by students. This lesson learned by students from the primary until the university level. Based on that reason, teachers required to be more active and creative to improve their students’ ability, so that the students would be more interesting in learning mathematics. Most mathematics teachers believe that having better relationships with their students are important. Therefore, it is necessary for the teachers to determine a teaching strategy and learning materials which lead toward a conducive learning environment.
In the last decade, many countries have applied learning environment instruments in conducting research studies and was widely validated in diverse setting such as, USA, Australia, Canada, England, Israel, Nigeria, Brunei, Singapore, South Korea and the countries in South pacific Island (Fraser, Giddings & McRobbie, 1995; Giddings & Waldrip, 1996; Wong & Fraser, 1996, Lee & Fraser, 2001).
Research Questions
This study is framed with the following research questions: 1. Are the questionnaires valid and reliable?
2. What are students’ perceptions toward their teacher interpersonal behaviour? 3. What are students attitude toward Mathematics subject?
4. Is there any relationship between students’ views on teacher interpersonal behaviour and their attitude toward Mathematics?
Overview of Questionnaire on Teacher Instruction (QTI)
This instrument was originally from the Netherland and using Dutch language. Researchers in the Netherland have expanded this sector two times and made the area become instruments to assess the relationship between teacher’s behaviour and their students. First, in 1992 it has been done by Wubbles, Creton, and Hooymayers and the second by Wubbles and Levy in 1993. Those researchers investigated the teacher interpersonal behaviour by adopting a theory communications processed developed by Watzlawick, Bavin and Jackson (1967). In the system perspective communications, it is said that the behaviour of participants commonly influence each other. Behaviour of students influences the teacher’s behaviour which ultimately affects the students’ behaviour itself.
Based on the Lary’s work in 1957, a model map of teacher interpersonal behaviour could be described with two dimensions that named Proximity and Influence. The proximity indicated has cooperative behaviour at one end and oppositional at the other. The influenced indicated has dominant behaviour at one end and submissive at the other. The person’s interpersonal behaviour plotted on the diagram, where submissive/dominant continuum (DS) as the vertical axis and cooperative/oppositional continuum (CS) as the horizontal axis (Leary, 1957). Teacher interpersonal behaviour will be more similar if the two sectors, DS and CS, are closer each other. In QTI, those two main sectors labelled into 8 scales as mapped by Wubbles (1993).
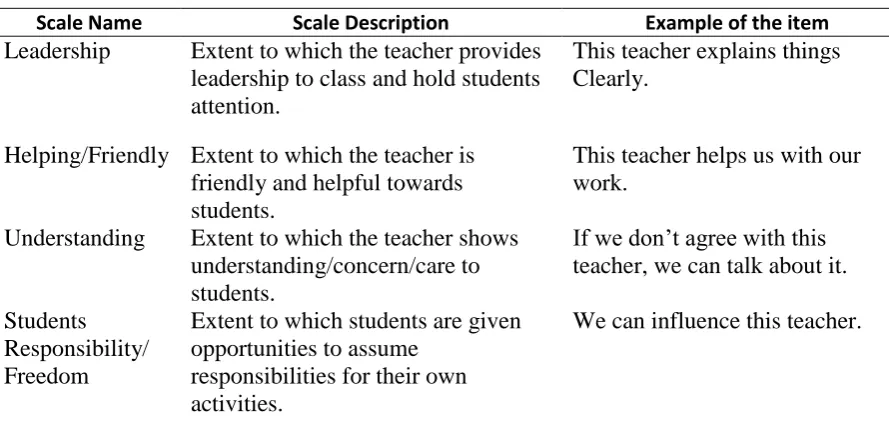
Descriptions of Scales in the QTI and sample of each item scale are provided in Table 1 below.
Table 1. The Description and Examples Items for each Scale in the QTI
Scale Name Scale Description Example of the item
Leadership Extent to which the teacher provides leadership to class and hold students attention.
This teacher explains things Clearly.
Helping/Friendly Extent to which the teacher is friendly and helpful towards students.
This teacher helps us with our work.
Uncertain Extent to which the teacher exhibits his/her uncertainty.
It is easy to make a fool out of this teacher.
Dissatisfaction Extent to which the teacher shows unhappiness/dissatisfaction with students.
This teacher thinks that we do not know anything.
Admonishing Extent to which the teacher shows anger/temper/impatient in class.
The teacher is impatient.
Strict Extent to which the teacher strict with and demanding of students.
We are afraid of this teacher.
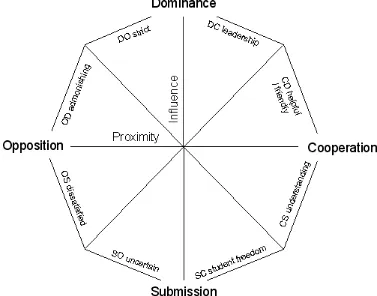
Each of scale grouped into 4 sectors, Dominance (Leadership and Strict), Cooperation (Understanding and Helping), Opposition (Dissatisfied and Admonishing) and Submission (Uncertain and Freedom). Each of the two scales in each sector interrelated to explain the interpersonal behaviour of teachers. Figure 1 display a model of teacher interpersonal behaviour proposed by Wubble (1993).
Figure 1. Model of teacher interpersonal behaviour (Wubble, 1993 p.4)
Teacher behaviour is mapped on a Proximity dimension [Cooperation or Opposition] and on an Influence dimension [Dominance or Submission] to form four groups of scales of QTI. These are then divided into a total of eight sectors, each describing different behaviour characteristics of the teacher that may exhibit. (See Figure 1)
Method
Data about the students’ perception on their teacher was collected using the instrument that named Indonesian Questionnaire on Teacher Interaction (QTI). The instrument was adopted from Australian’s QTI, which consists of 8 scales and 48 items. These items were grouped into 8 scales where each scale consists of 6 items. This research study involved students in grade 7, 8, 9 in mathematics classes in Indonesia. The samples consist of 424 students in 17 schools in the central Java.
There are five tables in the result that consist five result also, Reliability, Students perception on the actual teacher interpersonal behaviour, students perception on actual and preferred teacher interpersonal behaviour, male’s and female’s perception on the actual teacher interpersonal behaviour and correlation.
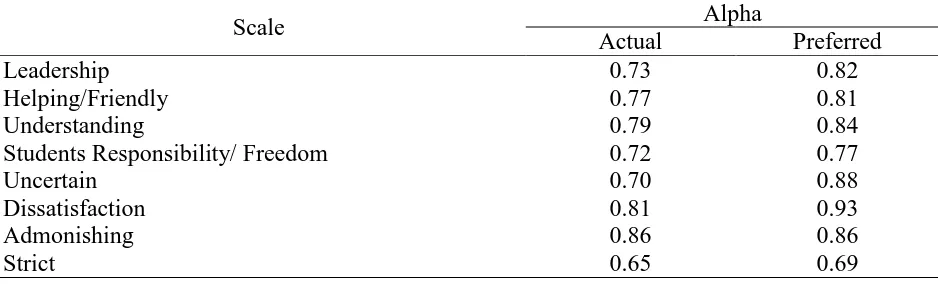
To indicate the validity and reliability of the questionnaires, we use Cronbach Alpha variable. If the Cronbach Alpha of each scale ranged more than 0.5, the questionnaires are valid and reliable. Meanwhile, actual mean used to measure the students’ perception on their teacher actual interpersonal behaviour. If the teacher got the higher score, the teacher is assumed better in leadership, helping, understanding and freedom. However, for the uncertain, dissatisfaction, admonishing and strict scale, is vice versa. However, to measure the actual and preferred teacher interpersonal behaviour, we used the comparison between mean actual and preferred. To find the difference perceptions between male and female students, we observe the t-value from average item mean and average item standard deviations between male and female students. Finally, for the correlation of QTI toward mathematics, we observe the correlation between Enjoyment and scales of QTI by using Standardized Regression Coefficient (Beta).
Result and Discussion
Table 2 Cronbach alpha reliability of QTI scales
Scale Alpha
Actual Preferred
Leadership 0.73 0.82
Helping/Friendly 0.77 0.81
Understanding 0.79 0.84
Students Responsibility/ Freedom 0.72 0.77
Uncertain 0.70 0.88
Dissatisfaction 0.81 0.93
Admonishing 0.86 0.86
Strict 0.65 0.69
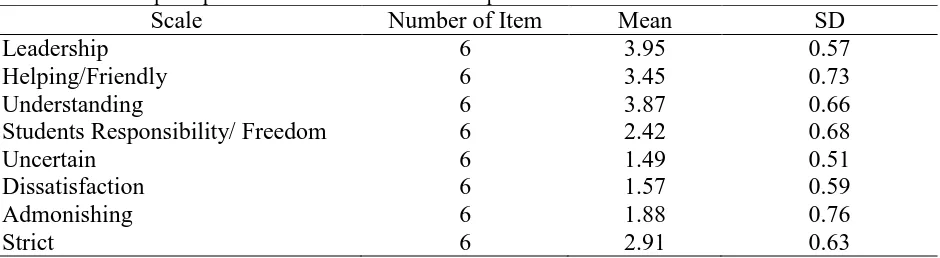
Table 3 Students perception on the actual teacher interpersonal behavior
Scale Number of Item Mean SD
Leadership 6 3.95 0.57
Helping/Friendly 6 3.45 0.73
Understanding 6 3.87 0.66
Students Responsibility/ Freedom 6 2.42 0.68
Uncertain 6 1.49 0.51
Dissatisfaction 6 1.57 0.59
Admonishing 6 1.88 0.76
Strict 6 2.91 0.63
Table 4 Students’ perceptions on the actual and preferred teacher interpersonal behavior
Scale
Average Item Mean Average Item Standard Deviation
t value
Actual Preferred Actual Preferred
Leadership 3.95 4.44 0.57 0.52 -15.67**
Helping/Friendly 3.45 4.20 0.73 0.60 -19.09**
Understanding 3.87 4.41 0.66 0.66 -15.08**
Students Responsibility/ Freedom 2.42 3.08 0.68 0.85 -17.72**
Uncertain 1.49 1.80 0.51 0.96 -7.22**
Dissatisfaction 1.57 1.49 0.59 0.83 1.95
Admonishing 1.88 1.64 0.76 0.77 6.03**
Strict 2.91 2.73 0.63 0.71 5.18**
** < 0.01; * < 0.05
Table 3 displays about students’ perceptions on the actual teacher interpersonal behaviour. According to the data above, students view about the teacher as having a good leadership when she teaches in the class. The number of mean 3.95 and standard deviation 0.57 support the explanation. In addition, students also consistently perceive as being less uncertain. The students also consider, the teacher is relatively friendly with them, this is indicated by mean is 3.45 and standard deviation is 0.73. Therefore, the students were satisfied with the teacher during the teaching and learning process. Less admonition, making students more understand in learning process. In this case, students will be understand the learning process if the teacher lacking admonish them during the learning process. This is indicated by mean= 3.87 and standard deviation= 0.86.
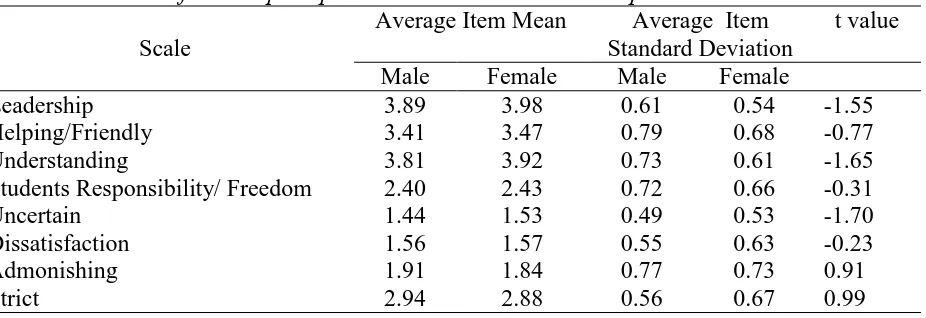
Table 5 Males’ and females’ perception on the actual teacher interpersonal behavior
Scale
Average Item Mean Average Item Standard Deviation
Students Responsibility/ Freedom 2.40 2.43 0.72 0.66 -0.31
Uncertain 1.44 1.53 0.49 0.53 -1.70
Dissatisfaction 1.56 1.57 0.55 0.63 -0.23
Admonishing 1.91 1.84 0.77 0.73 0.91
Strict 2.94 2.88 0.56 0.67 0.99
** < 0.01; * < 0.05
Table 5 gives information about male and female students’ view on the actual teacher interpersonal behaviour. As can be seen, in five scales included Leadership, Helping, Understanding, Freedom and Uncertainty, female students perceive higher average of item than male. In comparison, male students indicates higher average mean item in other three scales.
Furthermore, between male and female students do not show the significant differences (>0.05) toward their teacher. Male and female students give similar perceptions to the teacher interpersonal behaviour. This means, both male and female students indicates same perceptions about the teacher have relatively good performance on mathematics classroom.
Table 6 Correlation of QTI scales to student attitude toward mathematics
Scale
Students Responsibility/ Freedom 0.72 0.02
Uncertain -0.12** -0.07
Dissatisfaction -0.18** 0.07
Admonishing -0.32** -0.28**
Strict -0.14** -0.00**
** < 0.01; * < 0.05
All eight simple correlation between QTI scales and students’ attitude toward mathematics classroom were significant (<0.01) except Students Freedom. There was only one scales of QTI showing significant regression coefficient (<0.05).
Conclusion
This study has proven the reliability and validity of the question, when used in mathematics classroom. In general, the QTI scales were found as an instrument that related strongly with students attitude scores. Specifically, students’ attitude on their teacher behaviour tended to be higher in the classroom where students perceive the great first four scales on their teacher behaviour. It converse to be lower where students perceive the great last four scales behaviour. The result also indicated, the students from Indonesia are likely to be more authorized in the class and expect their teacher not to be strict and frequently admonish them. The teachers will encourage favourable students’ attitude in their class, if they observe their interpersonal behaviour carefully.
References
Cronbach. D. J. (1951). Coefficient Alpha and Internal Structure of Test. Pyscometrika, 16 (3), 297-334
Fisher, D. and Rickards, T. (1998). Associations between teacher-student interpersonal behaviour and student attitude to mathematics. Mathematics Education Research Journal, 10 (1), 3-15.
Fraser, B. J., Giddings, G. J., & McRobbie, C. J. (1995). Evolution and validation of a personal form of an instrument for assessing science laboratory classroom environments. Journal of Research in Science Teaching, 32(4), 399-422.
Giddings, G. and Waldrip, B. G. (1996). A comparison of science laboratory classrooms in Asia, Australia, South Pacific and USA: An International Study. Technical Report.
Leary, T (1957). An interpersonal diagnosis of personality. New York: Ronald-Press Company
Lee, S.S.U. & Fraser, B.J. (2001, March). High school science classroom learning environments in Korea. Paper presented at the Annual Meeting of the National Association for Research in Science Teaching, St. Louis, MO.
Santiboon, T. and Fisher, D. (2005). Associations between teacher-student interpersonal behaviour and student attitudes in physics classes in Thailand. Paper presented at the 31st Congress on Science and Technology of Thailand at Suranaree University of Technology, 18 – 20 October 2005.
Watzlawick, P., Beavin, J. H., & Jackson, D. D. (1967). Some tentative axioms of communication. In Pragmatics of human communication: A study of interactional patterns, pathologies, and paradoxes (pp. 48-71). New York, NY: W. W. Norton & Company.
Wong, A. F. L., & Fraser, B. J. (1996). Environment-attitude associations in the chemistry laboratory classroom. Research in Science & Technological Education, 14, 91-102.
Wubbels, T., Creton, H., Levy, J., & Hooymayers, H. (1993). The model for interpersonal behaviour. In T. Wubbels., & J. Levy. (Eds.), Do you know what you look like? Interpersonal relations in education. London: The Falmer Press.
Wubbels, Th., Creton, H. A., & Hooymayers, H. P. (1985, April). Discipline problems of beginning teachers, interaction teacher behaviour mapped out. Paper presented at the Annual Meeting of the American Educational Research Association, Chicago, USA