Full Terms & Conditions of access and use can be found at
http://www.tandfonline.com/action/journalInformation?journalCode=vjeb20
Download by: [Universitas Maritim Raja Ali Haji] Date: 12 January 2016, At: 23:23
Journal of Education for Business
ISSN: 0883-2323 (Print) 1940-3356 (Online) Journal homepage: http://www.tandfonline.com/loi/vjeb20
An Examination of Two Learning Style Measures
and Their Association With Business Learning
Donald R. Bacon
To cite this article: Donald R. Bacon (2004) An Examination of Two Learning Style Measures and Their Association With Business Learning, Journal of Education for Business, 79:4, 205-208, DOI: 10.3200/JOEB.79.4.205-208
To link to this article: http://dx.doi.org/10.3200/JOEB.79.4.205-208
Published online: 07 Aug 2010.
Submit your article to this journal
Article views: 42
View related articles
ne of the major educational move-ments of the past 25 years has been the increased attention to student learning styles (Lemire, 2000). Learn-ing style refers to the consistent way in which a learner responds to or interacts with stimuli in the learning context (Loo, 2002). The learning style para-digm holds that when course delivery is tailored to the different learning styles of students, student learning is enhanced. Some researchers have coun-tered, however, that this fundamental assumption has not yet been strongly supported (Curry, 1990; Freedman & Stumpf, 1980). The plethora of learning style measures available confounds our ability to understand the effects of learning style differences.
My purpose in this research is to compare two fairly new learning style measures that have become widely available: Felder’s Index of Learning Styles (Soloman & Felder, 2000) and Jester’s Learning Style Survey (Miller, 2000). I sought to investigate the relia-bility of these scales and the strength of the relationships that each measure exhibits with learning.
I selected two learning style frame-works for study because they are avail-able for use with no charge on the Inter-net. The instruments are designed to be completed online and automatically scored, with the results reported
imme-diately to the user. Because of their low cost and ease of use, these tools have gained a great deal of attention. Their popularity is reflected in the fact that, when I began this study, the two instru-ments scored the highest rankings in Google (the most widely used Web search engine) in a search using the key-words “learning styles.” Yet, these rela-tively new scales have not been thor-oughly researched.
I first studied Felder’s Index of Learning Styles (or ILS, Felder, 1996). Working with Soloman (Soloman & Felder, 2000) and drawing on a concep-tual model developed earlier with Sil-verman (Felder & SilSil-verman, 1988), Felder developed a learning style mea-sure comprising four dimensions. The first dimension,sensing versus intuitive learners, distinguishes between learners who prefer concrete, practical facts and procedures (sensors) and learners who prefer conceptual or theoretical infor-mation (intuitors). The second dimen-sion,visual versus verballearners,
dis-tinguishes between learners who prefer pictures, diagrams, or charts (visuals) and learners who prefer written or spo-ken explanations (verbals). The third dimension, active versus reflective learners, distinguishes between learners who prefer to learn by trying things out or working with others (actives) and learners who prefer thinking things through and working alone (reflectives). Finally, the fourth dimension, sequen-tial versus globallearners, distinguishes between learners who prefer linear, orderly learning in steps (sequentials) and learners who are more comfortable with holistic approaches and learn in large leaps (globals).
I then studied Jester’s Learning Style Survey (LSS, Jester, 2000; Miller, 2000). Jester conceptualizes four dis-tinct learning styles, but learners may use some combination of them. The first is the visual verbal learning style. Although Felder saw visual and verbal learning as opposite ends of a continu-um, Jester accepted that these styles may co-occur. Visual verbal learners like pictures and diagrams but learn even more effectively when they write out explanations for the material that they are studying. Jester’s second style, the visual nonverbal style, is more simi-lar to Felder’s visual style, in which learners benefit from pictures and dia-grams but not as much from verbal
An Examination of Two Learning
Style Measures and
Their Association With
Business Learning
DONALD R. BACON
University of Denver Denver, Colorado
O
ABSTRACT. In this study, the author examined two learning style measures that are available online, Felder’s Index of Learning Styles and Jester’s Learning Styles Survey. Most of the subscales contained in these measures were found to have poor reliability. Further, the author found that these measures exhibited little or no meaningful association with busi-ness learning.
material. The tactile kinesthetic learning style is Jester’s third style. These learn-ers prefer physically active, hands-on activity, much like Felder’s active learn-ers. Finally, Jester’s auditory verbal learning style describes learners who benefit from verbal material but learn more when they can listen to spoken words than when they just read material for themselves.
Although there is an enormous amount of published research on learn-ing styles, relatively few studies have critically evaluated the assumption that learning style affects learning out-comes. Of those that have, many have found null results, particularly in busi-ness (Freeman, Hanson, & Rison, 1998; Huxham & Land, 2000; Karakaya, Ain-scough, & Chopoorian, 2001; Tom & Calvert, 1984). Many studies have attempted to identify which categories of learning styles are most common among business students (Loo, 2002; Wynd & Bozman, 1996), but this research seems premature given the questionable size of the effect of learn-ing styles on learnlearn-ing outcomes.
One reason why few significant learning style effects have been found may be the lack of statistical power due to small sample sizes and low measure-ment reliability (Curry, 1990). In their analysis of Kolb’s classic measure of learning style, Freedman and Stumpf (1980) found that Kolb’s measure was unreliable. Freedman and Stumpf sug-gested that the somewhat artificial, forced bipolar nature of Kolb’s instru-ment may be another reason why the measure is not associated strongly with other variables. It should be noted that the ILS uses scaling similar to Kolb’s, but the LSS generally does not.
The learning style paradigm assumes that when the learning environment matches a student’s learning style, the student’s learning is enhanced. We would expect this effect to be particular-ly pronounced in a modified, traditional-ly taught course that relies heavitraditional-ly on lecture. Such lecture-based courses have been criticized for not meeting the needs of students with different learning styles (Karakaya, Ainscough, & Chopoorian, 2001); without improvement, such courses would result in at least some stu-dents not learning as effectively as
oth-ers. In the present research, I observed differences in learning across learning styles in a traditionally taught course. Approximately 90% of the class time in this course was spent in lecture, with the balance spent in discussion. The course also included two projects that were completed outside of class.
I formulated the two following research questions:
RQ1: How reliable are the ILS and LSS subscales?
RQ2: Are differences in learning styles in a traditionally taught marketing course associated with differences in learning?
Method
Data
I collected the data for this study in class in six sections of a traditionally taught, junior-level marketing course (Consumer Behavior). The same instructor taught all sections. The total number of students in these sections was 211. I used within-construct mean substitution to accommodate missing responses within scales and used list-wise deletion to eliminate respondents with other missing data (e.g., the pretest). This resulted in a usable sam-ple of 161 respondents. Of these, 53% were women, 50% were 3rd-year stu-dents, and 37% were 4th-year students. The student body at the test site was predominantly of traditional ages.
Instruments
The students completed Felder’s 44-item ILS and Jester’s 32-44-item LSS (both objectively-scored instruments) in paper-and-pencil format during the 7th week of class.
Research has found that learning is strongly affected by prior learning and general academic ability (Bloom, 1976) and that academic ability and learning style often are correlated (Wynd & Boz-man, 1996). Therefore, in a test of the effect of learning style on learning out-comes, it is important to control for prior learning and academic ability. I accomplished this control through the use of a pretest-posttest design. Stu-dents took the pretest on the first day of class, and I used the scores on the final exam, which was taken during finals week, as the posttest. The course pretest covered knowledge of marketing and consumer behavior that a student might have acquired in an earlier marketing course. Of the 4 short-answer and 31 multiple-choice questions used in the pretest, I dropped 10 multiple-choice items to increase the reliability of the test. The resulting 25-item test achieved a reliability of .59. The final exam con-sisted of 107 multiple-choice questions and had a reliability of .91. Among the students who completed all the instru-ments in this study, the correlation between the pretest and final exam scores was .46 (n= 161,p< .001).
Results
To address the first research ques-tion, I computed the reliabilities for the subscales of the ILS and the LSS (see Table 1). The reliabilities of the learn-ing style instruments were modest, gen-erally falling below the .70 level, which many consider to be a meaningful min-imum (Nunnally, 1978). The ILS sub-scales are generally more reliable than the LSS subscales, partly because the ILS subscales are each 11 items long, whereas the LSS subscales are each only 8 items long.
TABLE 1. Reliabilities of the ILS and LSS Subscales
ILS Subscales LSS Subscales
Subscale Reliability Subscale Reliability
Active/reflective 0.60 Visual nonverbal 0.49 Sensing/intuitive 0.70 Visual verbal 0.32 Visual/verbal 0.66 Auditory 0.61 Sequential/global 0.47 Kinesthetic 0.58
To test whether or not learning style was associated with differences in learning, I analyzed two regression models in sequence. In the first analysis, final knowledge was regressed on previ-ous knowledge. This model resulted in an R2of .21 and was statistically signif-icant (F [1,159] = 42.65, p < .001). I retained the residuals from this regres-sion, representing that part of final knowledge that was not explained by prior knowledge, for use as the depen-dent variable in the next regression. In this next regression, all of the learning style subscales were made available as potential explanatory variables in a stepwise regression. In the final model, only one variable, Jester’s auditory sub-scale, was statistically significant (F [1,159] = 8.04,p= .005), but this vari-able explained only 5% of the variance in learning. Surprisingly, the standard-ized coefficient for the auditory sub-scale, at -.21, indicates that those who preferred to learn by listening actually learned less effectively in this lecture-based course. A closer examination of the items in the LSS auditory subscale suggests that students scoring high in auditory preference may be less com-fortable with reading than other stu-dents are. The observed correlation between the LSS visual verbal scale and the auditory subscale was -.21 (n= 161, p< .01). Thus, the only significant asso-ciation found in this study between learning styles and learning was consis-tent with the conclusion that students who prefer to listen more than read do not do as well in school as those who are comfortable reading.
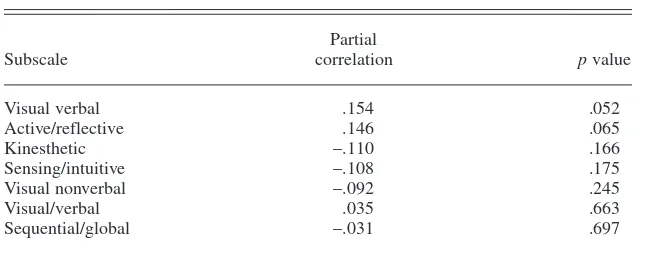
It should be noted that some of the other subscales studied here were near-ly significant. In Table 2, I show the
par-tial correlations and significance levels associated with the subscales excluded from the regression model; I sort these data by level of significance. At the top of this list is the visual verbal scale mentioned previously. The positive coefficient of .154 indicates that stu-dents who are comfortable reading and have confidence in their verbal skills may learn more in a traditionally taught course than those who have less comfort and confidence with verbal skills. The positive coefficient associated with active/reflective, at .146, indicates that students who are more reflective than active, or who prefer thinking and lis-tening to doing and talking, may learn more in a course like this one. It should be reiterated that these coefficients did not achieve statistical significance and must be interpreted with caution. If the sample were larger, these effects may have achieved statistical significance, but even if they did, the expected effect sizes would still be fairly small by wide-ly accepted standards (Cohen [1977] described a correlation of .10 as small and one of .30 as medium).
Discussion and Conclusions
The results of this study indicate that only one of the eight learning style scales studied, the sensing/intuitive sub-scale of the ILS, achieved what is com-monly regarded as acceptable reliability. These findings represent a warning flag to researchers who might be tempted to use a convenient scale without first inspecting its reliability. We should note that reliabilities may vary from school to school, so the present research should not be regarded as a condemnation of the scales presented but merely as a
reminder to researchers to validate the scales of interest on the populations that they wish to study before making a wholesale adoption of the measures.
In this study, I also found very little effect of learning styles on learning out-comes. Only one subscale was signifi-cantly associated with learning, and with an explained variance of 5%, the size of this effect would be considered midway between small and medium (Cohen [1977] described an R2of .01 as small and an R2of .09 as medium). Further, the nature of the effect found in the present study indicates that verbal aptitude or verbal fluency may have more influence on learning than does learning style. (Also, the weak reliability of the pretest may not have controlled adequately for the effect of verbal aptitude.) Thus, rather than adjusting a course to meet the needs of underperforming students by, for example, increasing the frequency of auditory learning opportunities, the underperforming students might be bet-ter served by remedial inbet-terventions tar-geted at raising their verbal comfort and confidence. As previously noted, the present course, in which auditory learn-ers underperformed other students, was approximately 90% lecture.
In summary, the present research found that two learning style measures freely available on the Internet exhibit-ed poor reliabilities in this student pop-ulation and had little meaningful impact on student learning. Thus, although cur-rently there is great interest in learning styles among business education researchers, these results indicate that those researchers should first check the reliabilities of the measures that they plan to use as a foundation for their research. The present study also serves as a call for more careful examination of the size of the effect, if any, that learn-ing styles have on learnlearn-ing outcomes.
ACKNOWLEDGMENT
I gratefully acknowledge the insightful com-ments received from Kim A. Stewart on an earlier draft and the financial assistance from the Daniels College of Business, which was instrumental in the completion of this research.
REFERENCES
Bloom, B. S. (1976). Human characteristics and school learning. New York: McGraw-Hill. TABLE 2. Variables Excluded in Stepwise Regression
Partial
Subscale correlation pvalue
Visual verbal .154 .052
Active/reflective .146 .065
Kinesthetic –.110 .166
Sensing/intuitive –.108 .175
Visual nonverbal –.092 .245
Visual/verbal .035 .663
Sequential/global –.031 .697
Cohen, J. (1977). Statistical power analysis for the behavioral sciences (revised ed.). New York: Academic Press.
Curry, L. (1990, October). A critique of the research on learning styles. Educational Lead-ership, 50–56.
Felder, R. M. (1996). Matters of style. ASEE Prism, 6(4), 18–23.
Felder, R. M., & Silverman, L. K. (1988). Learn-ing styles and teachLearn-ing styles in engineerLearn-ing education. Engineering Education, 78(7), 674–681.
Felder, R. M., & Soloman, B. A. (1999). Learning styles and strategies. North Carolina State Uni-versity. Retrieved October 20, 2001, from http://www.uncw.edu/cte/soloman_felder.htm Freedman, R. D., & Stumpf, S. A. (1980).
Learn-ing style theory: Less than meets the eye. Acad-emy of Management Review, 5(3), 445–447. Freeman, J. L., Hanson, R. C., & Rison, F. (1998).
Student learning styles, satisfaction and
perfor-mance.Proceedings of the 1998 Western Deci-sion Sciences Conference, Reno, Nevada. Huxham, M., & Land, R. (2000). Assigning
stu-dents in group work projects: Can we do better than random? Innovations in Education and Training International, 37(1), 17–22. Jester, C. (2000). Introduction to the DVC
learn-ing style survey for college. Retrieved October 19, 2001, from http://www.metamath.com/ lsweb/dvclearn.htm
Karakaya, F., Ainscough, T. L., & Chopoorian, J. (2001). The effects of class size and learning style on student performance in a multimedia-based marketing course. Journal of Marketing Education, 23(2), 84–90.
Lemire, D. (2000). Research report—A compari-son of learning styles scores: A question of con-current validity. Journal of College Reading and Learning, 31(1), 109–116.
Loo, R. (2002). A meta-analytic examination of Kolb’s learning style preferences among
busi-ness majors. Journal of Education for Business, 77(5), 252–256.
Miller, S. (2000). A learning style survey for col-lege. Retrieved October 24, 2001, from http://www.metamath.com//multiple/multiple_ choice_questions.cgi
Nunnally, J. C. (1978). Psychometric theory(2nd edition). New York: McGraw-Hill.
Soloman, B. A., & Felder, R. M. (2000). Index of learning styles questionnaire. Retrieved Octo-ber 20, 2001, from http://www.ncsu.edu/felder-public/ILSdir/ilsweb.html
Tom, G., & Calvert, S. (1984). Learning style as a predictor of student performance and instructor evaluations. Journal of Marketing Education, 6(2), 14–17.
Wynd, W. R., & Bozman, C. S. (1996). Student learning style: A segmentation strategy for higher education. Journal of Education for Business, 71(4), 232–235.