Full Terms & Conditions of access and use can be found at
http://www.tandfonline.com/action/journalInformation?journalCode=vjeb20
Download by: [Universitas Maritim Raja Ali Haji] Date: 11 January 2016, At: 22:34
Journal of Education for Business
ISSN: 0883-2323 (Print) 1940-3356 (Online) Journal homepage: http://www.tandfonline.com/loi/vjeb20
Introducing the Circular Flow Diagram to Business
Students
Bogdan Daraban
To cite this article: Bogdan Daraban (2010) Introducing the Circular Flow Diagram to Business Students, Journal of Education for Business, 85:5, 274-279, DOI: 10.1080/08832320903449527 To link to this article: http://dx.doi.org/10.1080/08832320903449527
Published online: 08 Jul 2010.
Submit your article to this journal
Article views: 84
View related articles
ISSN: 0883-2323
DOI: 10.1080/08832320903449527
Introducing the Circular Flow Diagram to Business
Students
Bogdan Daraban
Shenandoah University, Winchester, Virginia, USA
The circular flow of income diagram is a simplified representation of the functioning of a free-market economic system. It illustrates how businesses interact with the other economic participants within the key macroeconomic markets that coordinate the flow of income through the national economy. Therefore, it can provide students of business with a valuable tool for understanding the economic environment in which businesses operate. The author argues that the circular flow diagram may be used as an element of support for embedding a wide range of fundamental economic concepts into the structure of business education. He also describes an interactive classroom activity that engages students in constructing the diagram.
Keywords: circular flow diagram, curriculum integration
The relevance of the study of economics for the business curriculum has long been recognized. Philbrook (1957) ac-knowledged the strong interdependence between the disci-plines of economics and business but also pointed out that “the logical relationship” between them may lead to a “sense of ambiguity” (p. 434). Therefore, he called for a clearer delineation of the two disciplines in order to ensure the ef-fectiveness of the educational process. In contrast, Owen (1958) focused on the close relationship between economics and business and argued that increased “cross-fertilization” would benefit “academicians in economics and business ad-ministration as well as professional economists in business and government” (p. 359). Moreover, he demonstrated the importance of incorporating sound economics training into the fabric of business education. More recently, Miller (2000) reported on the implementation of an integrated business cur-riculum in response to ongoing concerns regarding the lack of cross-functional integration in management education. He showed how economics was seamlessly integrated in each of the six modules of the curriculum together with topics that would normally be taught in separate courses as part of a reg-ular business curriculum. In a 2005 survey, Athavale, Davids, and Myring (2008) identified a perceived need for a higher degree of integration in the business curriculum among deans of 143 Association to Advance Collegiate Schools of
Busi-Correspondence should be addressed to Bogdan Daraban, Shenandoah University, Harry F. Byrd, Jr. School of Business, 1460 University Drive, Winchester, VA 22601, USA. E-mail: bdaraban@su.edu
ness (AACSB) International-accredited institutions. Respon-dents to the survey also pointed to the Introduction to Busi-ness course as one of the areas in which more integration was needed.
The integration of economics into the business curricu-lum is presently reflected not only in the number and scope of required economics courses in undergraduate and graduate business programs, but also in the topical outlines of some of the core business courses. For example, it is not uncommon for an introductory-level textbook in marketing to include an appendix containing economics fundamentals such as de-mand and supply elasticity and market structure. Also, even before taking any economics courses, many business majors are exposed to a considerable number of economic concepts in the Introduction to Business course. The standard text-books used in this course devote an entire chapter to the study of the economic environment in which businesses operate. Usually, a wide variety of topics are covered, such as the free-market system (supply, demand, equilibrium price de-termination, market failures), alternative economic systems, international economics, business cycles, inflation, monetary policy, and fiscal policy. Despite the breadth of topics that find their way into these textbooks, I believe there is one missing element that could tie all these concepts together while providing some very powerful insights into the role of businesses in a free-market economy. This missing element is the circular flow of income diagram.
The purpose of this article is twofold: First, I demonstrate the utility of including the circular flow diagram in the topical outline of business courses, such as Introduction to Business,
INTRODUCING THE CIRCULAR FLOW DIAGRAM 275
that require an understanding of fundamental economic con-cepts. Second, I show how the concept of the circular flow diagram can be introduced through a simple classroom activ-ity that engages students in actively learning the intricacies of a free-market economic system.
Why Should Students of Business Understand the Circular Flow Diagram?
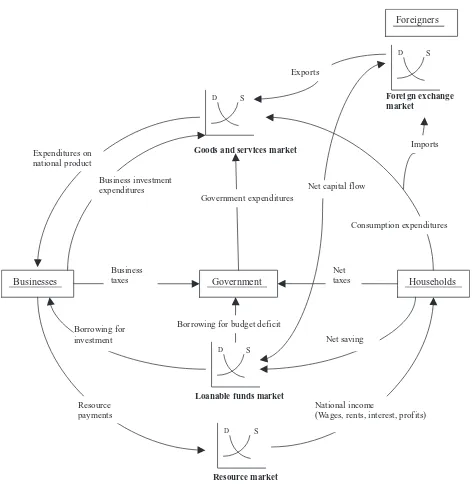
As shown in Patinkin (1973), it was Frank Knight, the Uni-versity of Chicago economist, who first published the circular flow diagram in a volume of course readings in 1932 and then later in 1933 inThe Economic Organization. Frank Knight’s “wheel of wealth” (as cited in Patinkin, 1973, p. 1037) can now be found in virtually all introductory-level economics textbooks in one form or another. Figure 1 shows one such version of “the circular flow of income diagram”, adapted from Gwartney, Stroup, Sobel, and Macpherson (2009, p. 191).
This diagram is a simple yet powerful representation of the functioning of an open free-market economy. It illus-trates how businesses, households, the government, and for-eigners interact within the four key markets (the goods and services, resource, loanable funds, and foreign exchange mar-kets) that coordinate the flow of income through the national economy.
The interactions among the participants are represented using arrows that show the direction of the flow of income generated as a result of the transactions that take place in each of the four markets. For example, the flow that connects the household sector to the goods and services market and then to the business sector indicates that when a household makes a purchase in the goods and services market, in which businesses are suppliers, a flow of income is generated from the household sector to the business sector. The resource market also connects households and businesses but this time the flow of income is reversed. In this market it is households that are on the supply side, as they derive income in the form of wages, rents, and profits. On the other hand, businesses represent demand in the market for resources as they hire workers, land, or capital, which they use in the production of goods and services. It is also important to note that there are instances when businesses are both suppliers and demanders in the goods and services market. For example a business investment (e.g., an airline purchasing an airplane) is also be reflected as a transaction in the goods and services market, which leads to an income flow from the business sector to the goods and services market.
The third market in which households and businesses in-teract is the loanable funds market in which interest rates are determined. When households do not spend all of their income on goods and services, they lend their savings in re-turn for interest, contributing to the supply of loanable funds. Businesses normally generate the demand for loanable funds,
as they need to finance their investment expenditures. The government is the other domestic actor that interacts with businesses and households. The taxes that the government collects from households and businesses are spent in the goods and services markets. When government revenue falls short of expenses, the government needs to borrow, therefore adding to the demand for loanable funds.
Domestic economic participants are also connected to for-eign households, businesses, and governments within the domestic and foreign goods and services markets as well as within the loanable funds markets. All these international transactions are reflected in the foreign exchange market in which the exchange rates are determined.
Basically, all interactions among the economic partici-pants can be described in terms of the market in which they take place, the role that the participants play (i.e., buyer or seller), and the direction of the generated income flows.
It should be clear why the circular flow diagram is a use-ful concept in the study of business. Case (2002) consid-ered the circular flow of economic activity to be one of the “crucial concepts” (p. 454) that students of economics (and of business I should add) need to grasp at the bare mini-mum because “If nothing else, students begin to see order in chaos” (p. 454). The circular flow diagram integrates most, if not all, economic concepts that would normally be taught as more or less disparate topics in an Introduction to Business course.
Supply and demand can be covered when mentioning each of the four key markets. In fact, students can now better understand that the market mechanism applies not only to everyday purchases of goods and services, but also to labor, bank loans, and foreign exchange.
The four components of the gross domestic product (GDP) are also illustrated in the circular flow diagram as the four flows going from households, businesses, the government, and foreigners, respectively, into the goods and services mar-ket. Concepts such as business cycles, inflation, and unem-ployment can also be introduced when describing the goods and services market.
The role of government in the economy, including notions related to fiscal policy, such as budget deficit or surplus, taxes, and government spending, can also be defined in the context of the circular flow model. Moreover, the global context in which businesses operate is also made clear in the circular flow diagram, and a basic discussion of exchange rates being determined by cross-border flows of goods, services, and financial capital can be introduced.
To summarize, by making use of the circular flow of in-come diagram, an integrative approach can be taken in teach-ing economics fundamentals to students of business. Conse-quently, students are equipped with a powerful and intuitive tool that helps them understand and analyze the multitude of roles that businesses play in keeping the great “wheel of wealth” (Patinkin, 1973, p. 1037) turning.
Resource market Loanable funds market
Forei gn exchange market
Businesses Households
S
D
S
D
S
D
Government
S
D
Goods and services market
National income
(Wages, rents, interest, profits) Resource
payments Expenditures on national product
Government expenditures Exports
Consumption expenditures
Business taxes
Net taxes
Borrowing for investment
Imports
Net saving Borrowing for budget deficit
Net capital flow
Foreigners
Business investment expenditures
FIGURE 1 The circular flow of income diagram (adapted by permission from Gwartney, Stroup, Sobel, & Macpherson, 2009).
An Interactive Classroom Activity for Introducing the Circular Flow Diagram
Having established the relevance of the circular flow diagram for students of business, I want to describe how the concept can be introduced through an interactive classroom activity that offers the invaluable benefit of promoting active learn-ing. In this exercise, students are assigned roles as market participants and then asked to identify the other participants in the economy with whom they might interact, the markets in which these interactions take place, and the income flows that result. More specifically, there are 10 suggested steps to
be taken when involving students in constructing the circular flow diagram:
1. Introduction. Start the discussion by asking students what they believe the categories of participants in a national economy are. It helps to provide hints, but students usually end up mentioning all four cate-gories: households, businesses, government, and for-eigners. Write these categories on the board and po-sition them as in Figure 1.
INTRODUCING THE CIRCULAR FLOW DIAGRAM 277
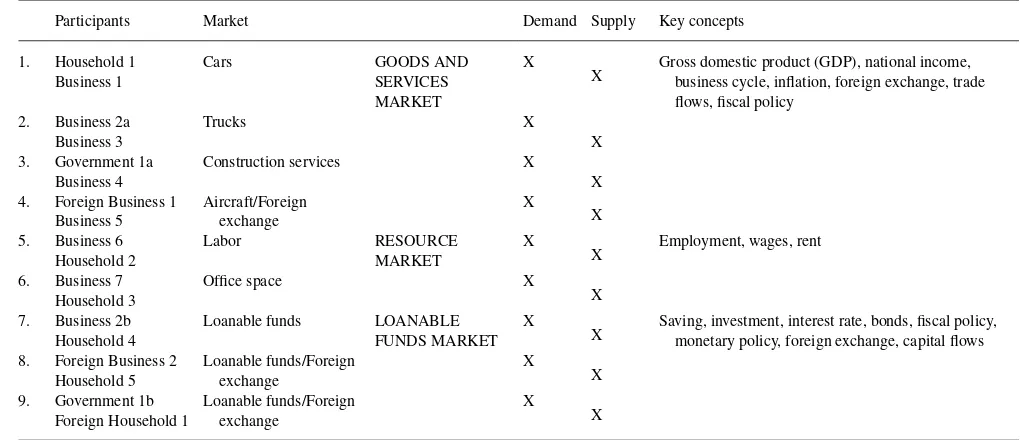
TABLE 1
Transactions in the National Economy
Participants Market Demand Supply Key concepts
1. Household 1
X Gross domestic product (GDP), national income,business cycle, inflation, foreign exchange, trade
flows, fiscal policy
2. Business 2a Trucks X
Business 3 X
3. Government 1a Construction services X
Business 4 X
4. Foreign Business 1 Business 5
X Employment, wages, rent
6. Business 7
X Saving, investment, interest rate, bonds, fiscal policy,monetary policy, foreign exchange, capital flows
8. Foreign Business 2 Household 5
2. Distribute worksheet and assign roles. Each student receives a worksheet containing the header of Ta-ble 1, which they fill out as the lecture progresses, and an index card that describes the role they have been assigned (i.e., a short narrative and whether they are a household, business, government, or foreigner). Possible examples of such roles are shown in the Appendix. Depending on class size, instructors may wish to assign some students multiple roles, such as a buyer household in the goods and services market or an employee household in the resource market. This serves to illustrate that in a real economy in-dividuals wear multiple hats. One useful addition to the exercise would be to provide students with play money to hand to each other as they simulate mar-ket transactions. This would provide a visual com-ponent to the activity and would further cement the idea.
3. Match economic participants in the goods and services market. For instance, in the aggregate goods and services market, businesses are on the supply side while households, businesses, the government, and foreigners are on the demand side. As a result, there will be four types of transactions that can be illustrated in this market. Start calling participants’ names (e.g., Household 1) and ask them to read out loud the narrative on their card (e.g., “I need to buy a car”). Then ask the other students to raise their hands if, based on what they heard, they think they are a good match and to read the narrative on their card (e.g., Business 1 should reply “We are the best car dealership in town”). Alternatively, students could
be allowed to walk around the classroom to find their match.
Step 4 represents a good point to bring into discussion the role of government in the economy and how fiscal policy is conducted. It should be pointed out that the taxes that Business 8 and Household 6 pay are in fact the source of funding for the government spending that takes place in the goods and services market. 4. Identify the market in which a transaction may take
place and the generated income flows. Based on the two matching narratives, ask students to identify in which market a transaction may take place. For ex-ample, using the narratives in the Appendix, it can be pointed out that the transaction between Household 1 and Business 1 would occur in the market for cars, which is part of the much broader goods and services market. Also, ask students to identify which partic-ipant is on the supply side of the market, which is on the demand side, and what is the direction of the generated income flow. The foreign exchange market can also be introduced in the context of transactions involving foreigners, as exports are reflected in the demand for foreign currency and the prevailing ex-change rate.
5. Illustrate the income flows and fill out the worksheet. Based on the transactions that may take place, the instructor can now draw the corresponding income flows. Ask students to do the same and to also fill out the table on the worksheet with the available infor-mation.
6. Discuss the goods and services markets. Having il-lustrated the types of transactions that take place in
the goods and services market, the instructor can now start discussing related concepts such as GDP, unem-ployment, and inflation, which are all determined in this market.
7. Match participants in the resource market and then follow Steps 4 and 5.
8. Discuss the resource market.
9. Match participants in the loanable funds market and then follow Steps 4 and 5.
10. Discuss the loanable funds market. This step also pro-vides a good opportunity to reinforce notions pertain-ing to the foreign exchange market in the context of cross-border financial capital flows. Monetary policy can be also discussed.
The amount of time needed to complete the exercise de-pends on the level of detail deemed appropriate by the in-structor, but I recommend allocating at least 50 min. Also, some versions of the circular flow diagram do not include the international sector. Although this decreases the level of complexity, I believe it also greatly diminishes the learning value by making it impossible to convey the international dimension of the economic environment.
Summary and Conclusions
The circular flow of income diagram is a simplified represen-tation of a free-market economic system. It provides valuable insights regarding the role of businesses in a national econ-omy and their interactions with the other economic partici-pants. Although its relevance has been long recognized in the study of economics, I have offered arguments for the inclu-sion of this essential topic in the business curriculum as well. For instance, a typical Introduction to Business course covers a broad selection of fundamental economic concepts rang-ing from how supply and demand interact within markets to business cycles and fiscal policy. The way the textbook ma-terial is usually organized makes it easy for students to lose sight of how these concepts fit together. Consequently, one of the obvious benefits of studying the circular flow diagram is that it provides an integrative alternative approach, which allows students to investigate the workings of the economic environment in which businesses operate.
Moreover, the circular flow diagram lends itself very well to a hands-on demonstration that engages students in active learning. At the end of the classroom activity that I propose in this article, students will have constructed a circular flow diagram based on a wide array of interactions among all participants in a national economy. Thus, they are provided with a unified representation of a complex economic system, which “helps them see order in chaos” (Case, 2002, p. 454). Curricular integration can be achieved at various levels and in different forms, and business school administrators perceive its potential benefits to outweigh the costs. This ar-ticle shows that indeed, due to their close interdependence,
the fields of business and economics offer plenty of opportu-nities for integration that can ultimately improve the quality of the educational process.
REFERENCES
Athavale, J., Davis, R., & Myring, M. (2008). The integrated business cur-riculum: An examination of perceptions and practices.Journal of Educa-tion for Business,83, 295–301.
Case, K. E. (2002). Reconsidering crucial concepts in micro principles.
American Economic Review,92, 454–458.
Gwartney, J. D., Stroup R. L., Sobel R. S., & Macpherson D. A. (2009).
Economics: Private and public choice. (12th ed.). Mason, OH: South-Western Cengage Learning.
Miller, J. R. (2000). Economics in the integrated business curriculum. Jour-nal of Education for Business,76, 113–118.
Owen, J. P. (1958). The role of economics in education for business admin-istration.Southern Economic Journal,24, 353–361.
Patinkin, D. (1973). In search of the “Wheel of wealth”: On the origins of Frank Knight’s circular-flow diagram.American Economic Review,63, 1037–1046.
Philbrook, C. E. (1957). The disciplines of economics and business. South-ern Economic Journal,23, 434–444.
APPENDIX
Narratives for Student Roles
The Business Sector
Business 1:We are the best car dealership in town.
Business 2a:We are a recycling company and we need to expand our fleet of trucks.
Business 2b:We need to take out a loan from Bank of Amer-ica to fund the investment in the truck fleet.
Business 3:We are a US based truck manufacturer.
Businesses 4:We are a construction company specialized in airport terminal modernizations.
Business 5:We are the world leading aircraft manufacturer.
Business 6:We are a consulting company hiring business majors.
Business 7:We are a fast growing insurance provider. We need to expand our offices to accommodate our growing business so we need more office space.
Business 8:We hope that the taxes that we pay every year will be wisely spent by the government.
The Household Sector
Household 1:I need to buy a car.
Household 2:I have just graduated with a degree in business. I am looking for a job in consulting.
Household 3: I am a real estate investor. I own an office building that I am trying to lease.
Household 4: I have just won the lottery. I will create a savings account at Bank of America for rainy days.
INTRODUCING THE CIRCULAR FLOW DIAGRAM 279
Household 5:I hear the IT market in Ireland is growing fast so I will invest some of my savings there.
Household 6:I filled out my tax returns and I owe money to the government.
Foreign Sector
Foreign Business 1:We are a fast growing low cost airline based in Germany. We need to expand our fleet so we intend to buy 8 new aircraft.
Foreign Business 2: I own a small software company in Ireland. I need funding to grow and become more com-petitive.
Foreign Household 1:I have 10,000 Euros that I want to invest in US government bonds (debt).
Government
Government 1a:We need to build a new terminal at Dulles airport.
Government 1b:The terminal at Dulles got us into a budget deficit. We are going to have to borrow by issuing bonds.