Full Terms & Conditions of access and use can be found at
http://www.tandfonline.com/action/journalInformation?journalCode=cbie20
Download by: [Universitas Maritim Raja Ali Haji] Date: 18 January 2016, At: 19:25
Bulletin of Indonesian Economic Studies
ISSN: 0007-4918 (Print) 1472-7234 (Online) Journal homepage: http://www.tandfonline.com/loi/cbie20
Survey of recent developments
Arianto A. Patunru & Christian von Luebke
To cite this article: Arianto A. Patunru & Christian von Luebke (2010) Survey of recent developments, Bulletin of Indonesian Economic Studies, 46:1, 7-31, DOI: 10.1080/00074911003642229
To link to this article: http://dx.doi.org/10.1080/00074911003642229
Published online: 17 Mar 2010.
Submit your article to this journal
Article views: 217
View related articles
ISSN 0007-4918 print/ISSN 1472-7234 online/10/010007-25 © 2010 Indonesia Project ANU DOI: 10.1080/00074911003642229
SURVEY OF RECENT DEVELOPMENTS
Arianto A. Patunru* Christian von Luebke*
University of Indonesia, Jakarta Stanford University
SUMMARY
Recent political developments are slowing reforms. The Corruption Eradication Com-mission (KPK) and the fi nance ministry fi nd themselves entrapped in legal inquiries
and political wrangling that seem intended to weaken their reforming zeal. KPK’s effectiveness has been undermined by legislative changes and the arrests of three of its commissioners. Meanwhile, the costly bail-out of a small bank has provided an oppor-tunity for attacks on leading reformers – Vice President Boediono and the Minister of Finance, Sri Mulyani Indrawati. The president’s diffi dent stance in both instances
has played into the hands of the opposition and, although key reformers are likely to remain in offi ce, the political imbroglio has nonetheless eroded confi dence in the
government.
Year-on-year GDP growth recovered strongly to 5.4% in the fourth quarter of 2009. Government spending has been the key driver, while household spending slowed and investment remained low. Both exports and imports have returned to modest growth. Although 2009 ended with low infl ation, Bank Indonesia (BI) has set its target
infl ation rate for 2010 at double the rate it achieved in November. BI is likely to bow to
populist demands to lower nominal interest rates rather than raising them somewhat to prevent infl ation accelerating, even though its real policy rate has been consistent
with signifi cant acceleration of GDP growth. The 2009 budget outcomes confi rm that
the fi scal stimulus in response to the global fi nancial crisis has been less than hoped
for. As for 2010, high world oil prices will imply huge subsidies, given that the gov-ernment is unwilling to increase domestic fuel and electricity prices commensurately.
The president announced that virtually all the government’s ‘fi rst 100 days’
pro-gram targets have been met. However, half of the ‘action plans’ amounted to nothing more than issuing or announcing new regulations, plans, blueprints, guidelines, rec-ommendations or policies, or simply preparing drafts of these. No real progress has been made in relation to the most urgent reforms, particularly on energy subsidies and labour market regulation. Realising that the whole population would benefi t in
net terms, the previous government signed the ASEAN–China Free Trade Agreement (ACFTA) in November 2004. But just when the agreement was to take effect, strong resistance from business and parliamentarians emerged, leading to the government’s decision to re-negotiate many tariffs with China. This is disappointing: failing to uphold its commitments under this long-standing agreement makes Indonesia appear unreliable as an economic partner.
* The authors thank Erna Zetha and Susi Haryani for data and logistics assistance. Chris-tian von Luebke gratefully acknowledges the fi nancial support of the German Research
Foundation (DFG).
RECENT POLITICAL DEVELOPMENTS
Nation-wide demonstrations on 9 December 2009 – World Anti-Corruption Day – served as a reminder that Indonesia’s reform challenges have reached new lev-els of complexity. Thousands of citizens voiced demands for better governance and, especially, less corruption. Public dismay had been fuelled by the arrests of three commissioners of the Anti-Corruption Commission (Komisi Pemberan-tasan Korupsi, KPK), which many saw as part of a campaign to stifl e this new
and hitherto highly successful institution. Discontent was further fanned by media reports of a Rp 6.7 trillion bail-out of the troubled Bank Century, including unsubstantiated allegations that the bail-out involved some kind of subterfuge to channel government funds to the 2009 election campaign of President Susilo Bambang Yudhoyono (SBY). The diffi dent response of the president, especially in
the Bank Century case, has emboldened political opponents to attack two of the country’s most steadfast reformers: the vice president, Boediono, and the Minister of Finance, Sri Mulyani Indrawati. The resulting political quagmire has been a severe distraction from the government’s ‘fi rst 100 days’ program, and casts
con-siderable doubt on whether much-needed public sector reforms can be realised.
KPK in the cross-hairs
McLeod (2005a: 383) argued that when corruption and malpractice are endemic, as they are in Indonesia,
mechanisms that seek to monitor and penalise offi cials’ misbehaviour may be of
lit-tle use ... [since] other individuals within the same system need to take fi rm action
against those found to be corrupt, but ... are themselves likely to be (or, at least, to have been) involved in malfeasance.
Thus it comes as no surprise that key state institutions whose members the KPK has exposed as corrupt – the police, the attorney general’s offi ce and the parliament
(DPR) – have been involved in attacks of some kind against the commission. There were three controversial arrests of KPK commissioners in 2009. In May, Antasari Azhar, then chief commissioner, was charged with master-minding the murder of a businessman under investigation by the KPK. Then in October, deputy commis-sioners Chandra Hamzah and Bibit Rianto were arrested on corruption charges. The arrests sparked nation-wide protests and prompted national leaders such as former President Abdurrahman Wahid (who died on 30 December 2009; box 1) to support the KPK publicly. Bibit and Chandra were released from police custody in early November, in response to public outrage following the release of taped conversations that appeared to reveal police involvement in a conspiracy against them. Antasari was sentenced to 18 years in prison, however. Many observers (for example, Sukma 2009: 332), believe that the arrests, particularly those of Chandra and Bibit, refl ected elite resistance to the anti-corruption drive.1
In general, KPK seems to have fallen victim to its own success. During its six-year existence the agency has achieved an impressive track record. Equipped with
1 One witness in the Antasari trial asserted that top-level police offi cials gave orders ‘to
spin the [statement] of … Antasari … from the original “bribes paid to certain KPK em-ployees” into “bribes paid to KPK leaders”‘ (Jakarta Post [hereafter ‘JP’], 13/11/2009).
far-reaching powers – including the authority to wire-tap conversations, freeze bank accounts, enforce travel bans and prosecute corruption suspects – the com-mission has a conviction rate of 100%. It has revealed transgressions by senior parliamentarians, bureaucrats, police offi cials and business people, but its efforts
to target the higher echelons of power are being met by increasing resistance. Even the president seemed to support the emerging criticism, noting that ‘KPK has developed into a super-body … that is accountable only to Allah’ (Kompas, 25/6/2009).
Apart from its confl icts with the police force, KPK has also faced considerable
opposition in parliament. In September 2009, DPR legislators drafted a new
BOX 1 ABDURRAHMAN WAHID: FATHEROF PLURALISM
Indonesia has lost one of its foremost champions of integration and multi-culturalism. On 30 December 2009, Abdurrahman Wahid – widely known as ‘Gus Dur’ – passed away in a hospital in Jakarta. The ‘father of pluralism’, as President Yudhoyono describes him, will be remembered for his vision of an Indonesian nation in which tolerance and solidarity transcend religious and ethnic divides.
As Indonesia’s fourth president, Gus Dur attained little acclaim. His short presidency during Indonesia’s early democratic transition (1999–2001) was beset by political friction. Facing a fragmented parliament with 21 political parties, Gus Dur never succeeded in aligning political interests and coalition partners. His alleged involvement in the 2000 Bulog (national logistics agency)
fi nancial scandal and his accommodating stance on Papuan and Acehnese
separatism only served to fuel tensions further. In July 2001, after a failed attempt by Gus Dur to dissolve parliament, the DPR voted to impeach the president and replace him with Megawati Soekarnoputri.
But shortcomings during his presidency do not diminish Gus Dur’s vast contributions to the Indonesian nation. As head of Indonesia’s largest Islamic organisation, Nahdlatul Ulama, he was an unwavering advocate of peace and reconciliation, a visionary Muslim cleric who promoted a greater openness in mainstream Islam towards other religious traditions. His natural, unpre-tentious demeanour attracted people from all walks of life. While Wahid’s frailty may have been a disadvantage in politics, it highlighted his humility and compassion in social dialogue. Reconciliatory gestures during his term in offi ce – including his apology for anti-communist violence in 1965, his
over-turning of repression of Chinese language and traditions, and his attempts to normalise relations with Israel – helped to reduce inter-faith friction and paved the way for a peaceful democratic transition.
The reputation of Gus Dur will live on far beyond his death. On 2 January, hundreds of Indonesians – Muslims, Christians, Buddhists and Hindus alike – gathered around Jakarta’s Proclamation Monument to pay their last respects. One thousand candles were lit to commemorate the accomplishments of the late religious leader. Gus Dur’s legacy will remain in the minds and hearts of many, raising hope that future leaders will follow in his footsteps and uphold the traditions of pluralism and tolerance he held so dear.
anti-corruption bill that overtly sought to diminish the commission’s investiga-tive powers. The initial draft of the bill aimed to abolish KPK’s authority to wire-tap conversations and prosecute corruption suspects. In addition, it called for the replacement of the national anti-corruption court by 33 provincial corruption courts, whose judicial panels would be appointed by existing district courts. The bill provoked considerable criticism because it subordinated KPK operations to traditional law enforcement structures, turning the institution into a ‘toothless tiger’. Although public protests and last-minute intervention by the president safeguarded KPK’s core investigative functions, the bill will nonetheless reduce the effi ciency and independence of corruption prosecutions, by dispersing
corrup-tion courts across provinces and reducing transparency in the appointment of judi-cial panels. In light of the simultaneous attacks on its commissioners by other law enforcement agencies, the overt resistance in parliament to KPK’s continued effec-tiveness suggests that its leaders should brace themselves for an uphill battle.
The Bank Century bail-out
Another episode that has captured public attention is the bail-out of Bank Cen-tury. Ever since its establishment, Bank Century – the result of a merger of three ailing banks in December 2004 – has provided much cause for concern. Accord-ing to the Supreme Audit Agency (Badan Pemeriksa Keuangan, BPK), the bank’s track record included several banking law violations between 2004 and 2008 that were not adequately dealt with by the central bank, Bank Indonesia (BI) (BPK 2009). During the global fi nancial crisis (GFC), its problems reached new levels
of urgency, such that between September and October 2008 its capital adequacy ratio (CAR) fell from 2.4 to –3.5%, far below the prescribed minimum of 8%. BI responded by providing three ‘short-term funding facilities’, on 14, 17 and 18 November, totalling Rp 689 billion (about $73 million).
Despite these liquidity injections the bank continued to falter. By 20 November 2008, its CAR was estimated to have plummeted to –35.9%, and BI brought the Bank Century case to the Financial System Stability Committee (Komite Stabilitas Sistem Keuangan, KSSK). The committee, chaired by fi nance minister Sri
Mul-yani, was seriously concerned that the failure of even a small bank could have a deep psychological impact throughout the banking system, given existing tur-bulence in fi nancial markets as a consequence of the GFC. It therefore approved
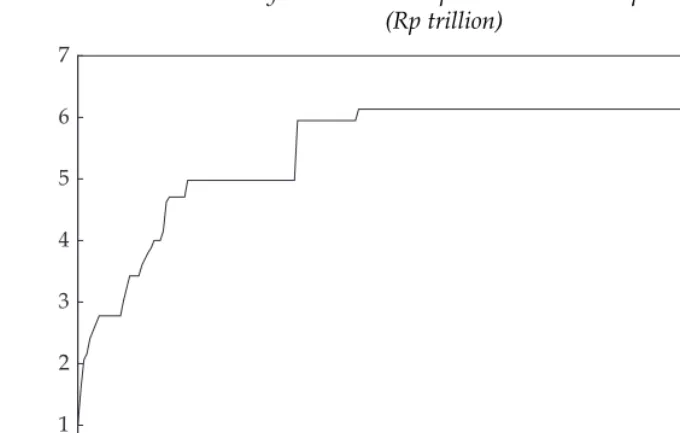
the bail-out on 21 November. While BI’s initial estimate of its likely cost was just Rp 0.63 trillion, the actual disbursements required by the Deposit Insurance Cor-poration (Lembaga Penjamin Simpanan, LPS) had ballooned to Rp 5 trillion by the end of 2008, and eventually to Rp 6.76 trillion by July 2009 (fi gure 1).
Interestingly, although LPS disbursements to the bank had by February 2009 increased nine-fold from the initial estimate, the bail-out was virtually ignored before the parliamentary and presidential elections in April and July 2009. It was not until August that newly elected DPR members began to criticise the deci-sion. Media reports, coloured by speculation that the bail-out funds had benefi ted
SBY’s election campaign, were accompanied by calls for the resignations of Boedi-ono (who was BI governor at the time of the bail-out) and Sri Mulyani. These political attacks were further invigorated by a report on the bail-out by BPK in mid-November. The newly appointed BPK chairman, Hadi Purnomo – a former tax chief dismissed by Sri Mulyani in 2006 in a bold move to root out graft in the
fi nance ministry (McLeod 2008) – declared that Rp 2.9 trillion of the LPS
disburse-ments were illegal and required further investigation (JP, 23/11/2009). On the basis of the BPK report, politicians eager to attack the government – including those from parties supposedly in coalition with SBY’s Democratic Party (Partai Demokrat, PD) – voted to set up a special parliamentary committee of inquiry (Panitia Khusus, or Pansus) to probe more deeply into the Bank Century affair.
According to the fi nance minister and the former BI governor, the bail-out
was necessary to sustain fi nancial sector confi dence and stability. By
prevent-ing contagious bank runs, the government contributed to Indonesia’s success in weathering the GFC better than most Asian countries (JP, 16/1/2010). Technical arguments about systemic risk and the relative cost of bailing out or liquidating the bank failed to resonate with the parliamentary inquiry committee, however. Televised cross-examinations of Sri Mulyani, Boediono and other KSSK members left the strong impression that scoring political points and discrediting senior offi
-cials was more important than adding substance and clarity to the case. Some of the most outspoken critics were guilty of inconsistency, having themselves pressed for rapid and far-reaching government intervention as the GFC peaked. Pansus member Bambang Soesatyo (of the Golkar party), who levelled a series of media attacks against Sri Mulyani,2 had argued in April 2008 that the govern-ment needed to act ‘not in a matter of days, but in a matter of hours, even min-utes [to sustain] fi nancial markets’ (Kompas, 28/4/2008). His colleague Maruarar
Sirait (of the Indonesian Democratic Party of Struggle, PDI-P), who was one of the
2 Soesatyo accused Mulyani through the press of having met secretly with Bank Century president director Robert Tantular before the KSSK approved the bail-out. Although this al-legation was quickly disproved, Soesatyo refused to apologise (Kompas, 13/12/2009).
0 1 2 3 4 5 6 7
24-Nov-2008 24-Jan-2009 24-Mar-2009 24-May-2009 24-Jul-2009 FIGURE 1 Bank Century: Cumulative Deposit Insurance Corporation Disbursements
(Rp trillion)
Source: BPK (2009).
most vocal critics of the bail-out, had urged the fi nance ministry in October 2008
to ‘take immediate action to prevent the crisis from hitting capital markets and spreading to the banking sector’ (Suara Pembaharuan, 13/10/2008).
In short, it appears that political parties – from within and without the cur-rent coalition – have exploited the investigative powers of the Pansus primarily to advance their political agendas. For the Islamic parties (PKS, PAN, PPP and PKB),3 who were unhappy with SBY’s choice of the technocrat Boediono as his vice-presidential running mate, the case provided a useful platform from which to press for his replacement. For the opposition parties (PDI-P, Hanura and Ger-indra), the parliamentary inquiry offered an opportunity to undermine the gov-ernment’s anti-corruption image. And for Golkar, which remained a somewhat reluctant coalition partner at best, it provided a possible means to unseat Mul-yani, who had become persona non grata for the party’s chair, Aburizal Bakrie.
Confl ict between Mulyani and Bakrie – one of the country’s wealthiest citizens
– appears to be at the heart of the current political turmoil. It has grown out of a series of issues. In October 2008, Mulyani publicly refused Bakrie’s request to close the stock exchange after Bakrie-controlled companies rapidly lost 30% in value (Wall Street Journal, 10/12/2009; Gunawan and Siregar 2009: 22–3). Tensions increased further when the minister issued travel bans on executives from certain Bakrie companies accused of tax evasion. She has also reportedly urged Bakrie to take responsibility for the Lapindo mudfl ow disaster (McMichael 2009), and
opposed his plans to buy into one of the country’s largest gold mines. A recon-ciliation meeting initiated by the president in early November 2009 seemed only to worsen the confl ict, and shortly afterwards the Golkar chair gave his blessing
to the parliamentary committee inquiry (JP, 16/12/2009), which has tied Mul-yani up in long-winded hearings and the need to defend herself against media attacks.
Presidential leadership
Despite his sweeping electoral victory in 2009, President Yudhoyono has remained a somewhat disengaged observer of these important political developments. In the KPK drama it was the force of public opinion – not the intervention of the president – that secured the release of KPK deputy directors Bibit and Chandra, while SBY’s reluctance to defend Boediono and Mulyani with any vigour merely encouraged political opponents to step up their attacks on the government and its reform agenda (JP, 17/1/2010). Although the president’s behaviour may refl ect
a desire to maintain a clean, reformist image, his public approval rating declined signifi cantly, from 85% in July 2009 to 70% in January 2010 (JP, 28/1/2010).
Because he persevered with the strategy of forming a ‘rainbow coalition’ cabinet, the president is likely to face a continuing tug-of-war among diverse party interests, making it very diffi cult to advance any reform agenda (Diamond
2009: 338). His relationship with Golkar is particularly challenging – not only
3 PKS (Partai Keadilan Sejahtera, the Prosperous Justice Party); PAN (Partai Amanat Na-sional, the National Mandate Party); PPP (Partai Persatuan Pembangunan, the United De-velopment Party); and PKB (Partai Kebangkitan Bangsa, the National Awakening Party).
because Golkar controls important media networks4 and a well-institutionalised machinery, but also because its chair, Bakrie, is widely believed to have provided substantial fi nancial support to Yudhoyono’s presidential campaign (see,
for example, Suharmoko and Witular 2008). At the same time, the president will fi nd it diffi cult to rebuild trust with his technocrat ministers, who have
become increasingly risk-averse and disconsolate owing to the political attacks surrounding Bank Century and the lack of strong support from above. Uncertainty about the future role of this group of ministers will reduce private sector willingness to commit to new investments, making it virtually impossible to achieve the targeted growth rate of 7% by 2014. Indeed, political disruption has already exacted a toll, rendering the government unwilling to take the risk of reducing hugely wasteful and regressive fuel and electricity subsidies in the face of world oil prices far above the original budget estimate. And although the president claims to have achieved most of the ‘fi rst 100 days’ objectives, progress
in key policy areas has in fact been slow. In his quest to re-invigorate investment, trade and growth, the president cannot afford to lose private sector trust: any short-term political gain from ousting technocratic reformers would be far out-weighed by longer-term economic costs.
Executive proliferation
A related cause for concern is that the executive has grown very large in terms of key high-level offi cial posts, and the effect of this can be expected to cascade
down to lower levels of government. The cabinet now consists of 34 ministers (including three coordinating ministers) and four offi cials with rank equivalent to
ministers (attorney general; police chief; military chief; and head of the Presiden-tial Unit for Development Supervision and Control [Unit Kerja Presiden untuk Pengawasan dan Pengendalian Pembangunan, UKP4]).5 Not since the Soekarno era has Indonesia had such a large cabinet. Its size creates diffi culties for effective
coordination and effi ciency in policy making. For example, UKP4 is tasked to
serve as a delivery or ‘de-bottlenecking’ unit, but it is not clear how its head will undertake coordination alongside the three coordinating ministers (for political, legal and security affairs; the economy; and people’s welfare) without creating tensions, since the need for ‘de-bottlenecking’ would seem to imply a failure of the coordinating ministers to do their job properly. Another danger is that each side may rely on the other to manage coordination, given the overlap in responsi-bilities, with the perverse result that nothing at all gets done.
A curious aspect of the expansion of the executive under SBY is the unexpected appointment by the president in December 2009 of deputy ministers in 10 of the ministries. It is to be hoped that the ministers will be helped rather than hindered by these appointments, given that some were reportedly not consulted in advance
4 Golkar chair Bakrie controls ‘TV One’, which broadcast all the Bank Century inquiry sessions. The head of Golkar’s advisory council, Surya Paloh, owns the newspaper Media Indonesia and the news channel ‘Metro TV’. However, rivalry between Paloh and Bakrie ap-pears to have led more recently to coverage by Media Indonesia and Metro TV that is more sympathetic to the fi nance minister.
5 In addition, the president has 10 special staff, one secretary and an advisory board with nine members, while the vice president has four special staff and one secretary.
about them. There is the possibility of disruptive confl ict between deputy
minis-ters and secretaries-general in the respective ministries. Only the latter have an offi cial hierarchical line of authority, so it is hard to envisage how the deputy
ministers could be effective. Many of the new deputies are among the most capa-ble people in the bureaucracy, but if they have no clear authority to exercise their vision, their appointment to these positions may be a misallocation of human resources.
MACROECONOMIC DEVELOPMENTS
Indonesia’s economy has remained surprisingly resilient to the GFC. In the fourth quarter of 2009 the GDP growth rate rebounded from 4.2% to 5.4% year on year (table 1a), such that GDP for the whole year increased by 4.5% over that in 2008. By contrast, neighbouring Malaysia and Thailand are estimated to have contracted
in 2009 byaround 3% and 4%, respectively (Hill 2010). This is in sharp contrast with the three countries’ relative performance during the 1997–98 fi nancial crisis,
when Indonesia’s GDP fell by 13%, Thailand’s by 11% and Malaysia’s by 7%. Expansionary fi scal policy and sound monetary policy have contributed to this
resilience by helping to stabilise domestic conditions (Resosudarmo and Yusuf 2009). Nevertheless, we share the view of most observers (for example, Hill 2010) that Indonesia’s resilience is in large part due to its relatively low exposure to international trade and fi nancial fl ows. Indonesia’s ratio of exports to GDP before
the GFC was only around 30%, while the respective measures for Malaysia, Thai-land and Singapore were around 80%, 60% and 160%. Moreover, there are only weak links between Indonesia’s fi nancial sector and those that have been
crum-bling in the US and Europe. The impact of the GFC has therefore been limited mainly to foreign trade, and a severe decline in Indonesia’s exports (table 1a). But since many exports have a high import content, there have been similar declines in imports, tending to offset the impact on the level of output.
We note in passing that there is no basis for the argument that Indonesia would be better off if it reduced the extent of its trade with the rest of the world in the future, so as to protect itself from external shocks like the GFC. A country such as Singapore, which is extremely open to trade, has certainly suffered from the crisis but, on the other hand, it is precisely its openness to trade that has allowed its economy to grow rapidly over several decades, resulting by now in very high per capita incomes. By contrast, a country such as Burma may not have been greatly affected by the GFC, but its reluctance to engage with the world economy has helped to condemn its people to very low standards of living.
Growth
After falling steadily from 6.2% in the third quarter (Q3) of 2008 to a little over 4% in Q2 and Q3 2009, year-on-year growth of quarterly GDP jumped to a rather surprising 5.4% in Q4 2009 (table 1a). Growth has been well supported by gov-ernment consumption expenditure, which has continued to record double-digit growth. On the other hand, private consumption switched from leading growth to holding it back in Q4 2009; its decline to 4.0% was perhaps due partly to dissi-pation of the boost that had been provided by election campaign spending (Reso-sudarmo and Yusuf 2009: 291).
The year-on-year growth of investment accelerated somewhat during the last two quarters of 2009, but remained disappointingly low at 4.2% in Q4, far below the corresponding fi gures a year earlier. Even though construction spending has
remained healthy, investment in machinery and equipment and in transport has declined signifi cantly. A more optimistic picture emerges from exports and
imports, however, both of which have returned to modest positive growth rates after several quarters of severe decline.
The non-tradables sector continued to record signifi cantly higher growth
rates than tradables throughout the period under consideration. Nevertheless, the growth of tradables increased noticeably in Q4 2009. Of particular inter-est is the large and unexpected acceleration of manufacturing output growth
TABLE 1a Components of GDP Growtha (2000 prices; % year on year)
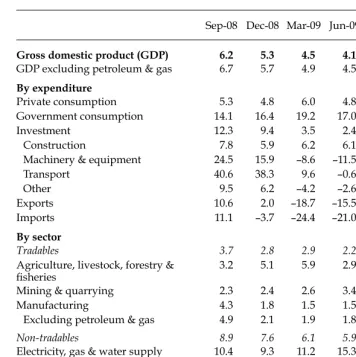
Sep-08 Dec-08 Mar-09 Jun-09 Sep-09 Dec-09
Gross domestic product (GDP) 6.2 5.3 4.5 4.1 4.2 5.4
GDP excluding petroleum & gas 6.7 5.7 4.9 4.5 4.5 5.8
By expenditure
Private consumption 5.3 4.8 6.0 4.8 4.7 4.0
Government consumption 14.1 16.4 19.2 17.0 10.3 17.0
Investment 12.3 9.4 3.5 2.4 3.2 4.2
Construction 7.8 5.9 6.2 6.1 7.7 8.0
Machinery & equipment 24.5 15.9 –8.6 –11.5 –12.7 –3.9
Transport 40.6 38.3 9.6 –0.6 –2.1 –14.6
Other 9.5 6.2 –4.2 –2.6 1.8 3.0
Exports 10.6 2.0 –18.7 –15.5 –7.8 3.7
Imports 11.1 –3.7 –24.4 –21.0 –14.7 1.6
By sector
Tradables 3.7 2.8 2.9 2.2 2.7 4.5
Agriculture, livestock, forestry &
fi sheries
3.2 5.1 5.9 2.9 3.3 4.6
Mining & quarrying 2.3 2.4 2.6 3.4 6.2 5.2
Manufacturing 4.3 1.8 1.5 1.5 1.3 4.2
Excluding petroleum & gas 4.9 2.1 1.9 1.8 1.5 4.9
Non-tradables 8.9 7.6 6.1 5.9 5.6 6.3
Electricity, gas & water supply 10.4 9.3 11.2 15.3 14.5 14.0
Construction 7.8 5.9 6.2 6.1 7.7 8.0
Trade, hotels & restaurants 7.6 5.5 0.6 0.0 –0.2 4.2
Transport –1.0 –1.0 2.0 5.7 7.4 6.7
Communications 33.5 33.5 30.3 26.6 23.7 16.3
Financial, rental & business services 8.6 7.4 6.3 5.3 4.9 3.8
Services 7.0 5.9 6.7 7.2 6.0 5.7
a Some data from earlier periods have been revised in the latest estimates.
Source: CEIC Asia Database.
in that quarter. Mining and quarrying also grew impressively in the second half of 2009, returning to growth rates not seen since early 2007. Utilities and communications continued as important contributors to non-tradables growth throughout the period in question. The performance of the trade, hotels and res-taurants sector improved considerably in Q4 2009, after three quarters of negli-gible growth.
In conditions of signifi cant economic disruption it is important to shorten
the time horizon of analysis. Table 1b therefore presents the seasonally adjusted quarter-on-quarter growth rates of key demand categories and sectors. The sud-den jump in GDP growth in Q4 2009 is confi rmed, as is the noticeable decline in
TABLE 1b Components of GDP Growtha (2000 prices; seasonally adjusted; % quarter on quarter)
Sep-08 Dec-08 Mar-09 Jun-09 Sep-09 Dec-09
Gross domestic product (GDP) 1.3 1.0 1.2 1.1 1.1 1.4
GDP excluding petroleum & gas 1.4 0.9 1.2 1.2 1.3 1.6
By expenditure
Private consumption 1.2 1.2 1.9 0.4 1.1 0.6
Government consumption 4.4 3.8 4.1 3.7 3.3 3.8
Not seasonally adjusted 5.6 25.6 –28.7 23.7 –0.4 33.2
Investment 1.8 1.0 –1.0 0.5 2.7 1.9
Construction 1.3 1.7 1.6 1.8 2.2 1.9
Machinery & equipment 9.6 –7.8 –11.1 –1.4 8.1 1.4
Transport 7.5 7.8 –13.3 2.2 4.2 –4.3
Other –1.3 –0.9 –2.9 2.6 3.2 0.2
Exports –1.5 –4.4 –15.2 5.9 7.5 7.4
Imports –2.9 –8.7 –14.4 4.4 4.6 8.2
By sector
Tradables 0.7 0.5 0.8 0.7 0.9 1.0
Agriculture, livestock, forestry &
fi sheries
1.1 1.0 1.3 0.6 1.0 1.0
Mining & quarrying 0.6 0.8 1.1 1.2 1.9 –0.4
Manufacturing 1.1 –1.3 0.8 0.9 0.9 1.4
Excluding petroleum & gas 1.3 –1.8 1.2 1.2 1.2 1.2
Non-tradables 1.9 1.3 0.8 1.8 1.6 1.9
Electricity, gas & water supply 2.6 3.1 3.3 3.8 3.5 3.5
Construction 1.3 1.7 1.6 1.8 2.2 1.9
Trade, hotels & restaurants 2.5 –1.1 –3.4 2.1 2.2 3.3
Transport –0.1 1.4 2.0 2.3 1.5 0.8
Communications 8.0 7.4 4.0 5.0 5.5 1.0
Financial, rental & business services 1.8 2.0 0.8 0.6 1.4 0.9
Services 1.5 1.6 1.4 2.3 0.6 1.3
a Some data from earlier periods have been revised in the latest estimates.
Source: CEIC Asia Database.
growth of private consumption. Growth of investment spending has been rather volatile, but in the second half of 2009 it was more rapid than growth of the economy as a whole. Healthy growth of exports in the last three quarters contrasts strongly with that of the previous three, and this is mirrored in the performance of imports. Government consumption appears remarkably stable, but this is due to seasonal adjustment of the data: the unadjusted growth rates continue to dem-onstrate very high volatility. The signifi cant recovery in year-on-year
manufactur-ing growth in Q4 is confi rmed in the quarterly data, while mining and quarrying
output in Q4 2009 can be seen actually to have fallen.
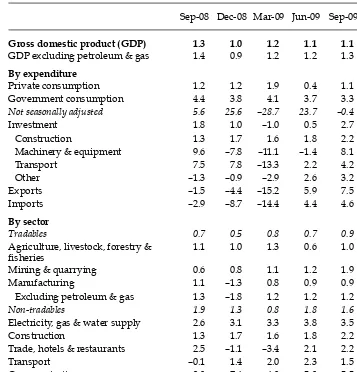
Indonesia’s total merchandise exports in 2009 contracted by 15.0% from their level of $137.0 billion in 2008, while non-oil and gas exports fell by 9.7% from $107.9 billion. In terms of sectors, exports of manufactured products fell 16.9%, while those of the agriculture and mining sectors declined by 4.8% and 31.9%, respectively (BPS 2010). As the world economy began to recover from the GFC, exports started to pick up noticeably, after reaching their low point in about March 2009 (fi gure 2a). There appears to have been a slight setback towards the end of
2009, but it is too early to tell whether this renewed softening of exports will be sustained.
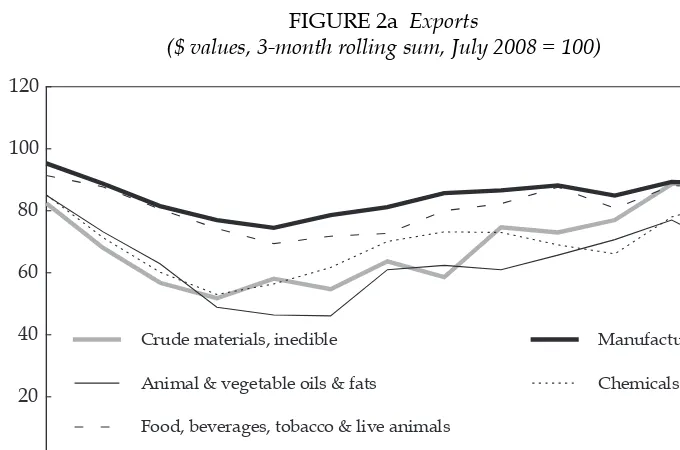
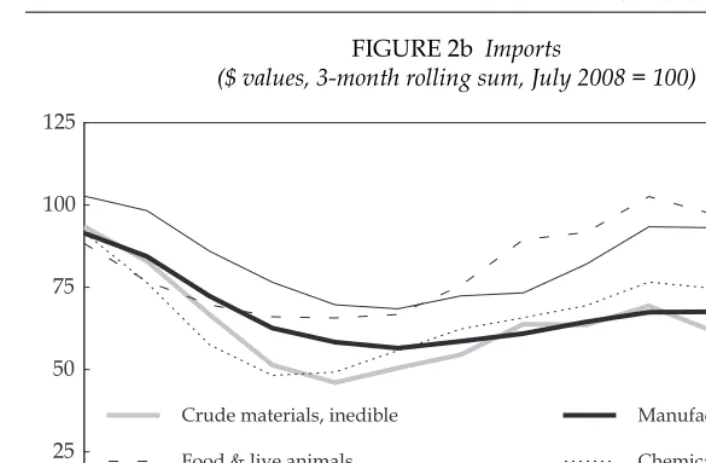
Total merchandise imports amounted to $96.9 billion in 2009, some 25.0% lower than in 2008. Non-oil and gas imports totalled $77.9 billion, down by 21.1% from 2008. Imports of consumer goods declined by 18.6%, while those of raw materials and capital goods fell by 30.0% and 4.5%, respectively (BPS 2010). The large decline in raw materials inputs refl ects similarly large declines in
manufac-tured exports, for which they are an important input. Figure 2b shows a severe decline in major import categories as the GFC began to affect Indonesia. The low point was reached in Q2 2009, and the subsequent recovery toward the end of the
Source: CEIC Asia Database.
FIGURE 2a Exports
($ values, 3-month rolling sum, July 2008 = 100)
Nov-2008 Feb-2009 May-2009 Aug-2009 Nov-2009 0
20 40 60 80 100 120
Crude materials, inedible
Animal & vegetable oils & fats
Food, beverages, tobacco & live animals
Manufactures
Chemicals
year shows evidence of an even more noticeable stagnation of imports than of exports.
Fiscal developments
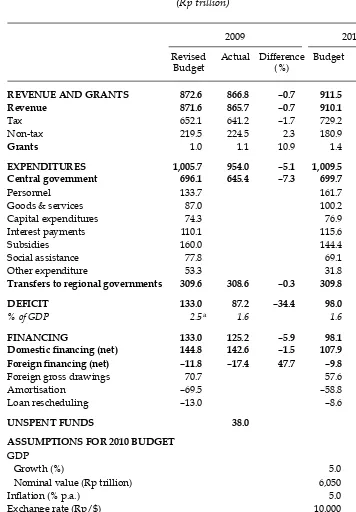
Table 2 presents key features of the 2009 and 2010 budgets. The preliminary out-come data for 2009 confi rm that the government was rather less successful than
had been hoped in providing a fi scal stimulus to counter the expected
contrac-tionary impact of the GFC. Expenditure by the central government was 7.3% less than the amount specifi ed in the revised budget, and although tax revenue was
also below its target, the overall revenue shortfall was only 0.7%. The stimulatory impact of collecting less revenue than intended would have been much too small to offset the shortfall in spending. Accordingly, the actual defi cit was far lower
than expected. The original 2009 budget had called for a defi cit equivalent to 1.1%
of GDP, but this estimate was revised in view of the need to provide a stronger
fi scal stimulus. In the revised budget the defi cit was increased to 2.5% (see table 2,
note a), but the realised defi cit was only 1.6%. One consequence of this is that
there were unspent funds amounting to Rp 38 trillion to be carried over to 2010. The shortfall in tax revenue in 2009 gives some cause for concern, although the revenues collected contributed slightly to the hoped-for fi scal stimulus. The
shortfall was mainly the consequence of disappointingly slow growth in non-oil and gas tax collections which, at 4.4%, compares poorly with the average annual growth rate of 18% during 2005–08 (Directorate General of Taxation, press release, 4/1/2010). Although the number of registered taxpayers remained low in 2009, at 15.9 million, this represented a huge proportionate increase from just 10.7 million in the previous year (Kompas, 5/1/2010), so it would seem that the downturn in the economy must have had a signifi cant negative impact on tax collections. In
2010 the target increase in tax collections is 13.7%. Accelerating economic growth Nov-2008 Feb-2009 May-2009 Aug-2009 Nov-2009
0 25 50 75 100 125
Crude materials, inedible
Food & live animals
Machinery & transport equipment
Manufactures
Chemicals
Source: CEIC Asia Database.
FIGURE 2b Imports
($ values, 3-month rolling sum, July 2008 = 100)
TABLE 2 Budgets for 2009 and 2010 (Rp trillion)
2009 2010
Revised Budget
Actual Difference (%)
Budget % GDP
REVENUE AND GRANTS 872.6 866.8 –0.7 911.5 15.1
Revenue 871.6 865.7 –0.7 910.1 15.0
Tax 652.1 641.2 –1.7 729.2 12.1
Non-tax 219.5 224.5 2.3 180.9 3.0
Grants 1.0 1.1 10.9 1.4 0.0
EXPENDITURES 1,005.7 954.0 –5.1 1,009.5 16.7
Central government 696.1 645.4 –7.3 699.7 11.6
Personnel 133.7 161.7 2.7
Goods & services 87.0 100.2 1.7
Capital expenditures 74.3 76.9 1.3
Interest payments 110.1 115.6 1.9
Subsidies 160.0 144.4 2.4
Social assistance 77.8 69.1 1.1
Other expenditure 53.3 31.8 0.5
Transfers to regional governments 309.6 308.6 –0.3 309.8 5.1
DEFICIT 133.0 87.2 –34.4 98.0 1.6
% of GDP 2.5a 1.6 1.6
FINANCING 133.0 125.2 –5.9 98.1 1.6
Domestic fi nancing (net) 144.8 142.6 –1.5 107.9 1.8
Foreign fi nancing (net) –11.8 –17.4 47.7 –9.8 –0.2
Foreign gross drawings 70.7 57.6 1.0
Amortisation –69.5 –58.8 –1.0
Loan rescheduling –13.0 –8.6 –0.1
UNSPENT FUNDS 38.0
ASSUMPTIONS FOR 2010 BUDGET GDP
Growth (%) 5.0
Nominal value (Rp trillion) 6,050
Infl ation (% p.a.) 5.0
Exchange rate (Rp/$) 10,000
3-month SBI rate, average (%)b 6.5
Oil price ($/barrel) 60
Oil production (‘000 barrels/day) 965
a The revised budget defi cit is based on MOF (2009a). MOF (2009b) reported a revised defi cit of 2.4%.
b SBI = Sertifi kat Bank Indonesia (Bank Indonesia Certifi cate).
Source: MOF (2009a, 2009b).
will be of some assistance in meeting this target, but the government will also need to improve its strategies for tax collection.
Assessing the fi scal stimulus package
It is diffi cult to evaluate the success of the government’s early 2009 fi scal
stim-ulus package. Even though the macroeconomic indicators show that Indonesia has suffered nothing more than a short-lived and small decline in its growth rate in the face of the GFC, there is no direct way to determine the extent to which the limited nature of the decline is a consequence of the fi scal stimulus program.
Nevertheless, there are important lessons from Indonesia’s experience with fi
s-cal stimulation in 2009 (Patunru and Zetha 2010). First, a fi scal stimulus relying
on extra spending on infrastructure depends heavily on the effectiveness of the ministries involved. Thus far, effectiveness has left much to be desired. Failure to execute budget allocations for infrastructure has made the stimulus program less successful than it might otherwise have been.
Second, to stimulate household spending, income tax was waived for certain workers – those with a maximum gross income of Rp 5 million per month (around $20 per day) and employed in the agriculture, fi sheries and manufacturing
sec-tors (Ministry of Finance Regulation 43/2009). It is diffi cult to see the rationale
for discriminating against workers who happen to be employed in retail trade or the construction industry, for example. Moreover, although the cut-off was high enough to include the vast majority of Indonesian employees, the context is one in which only a very small proportion of them pay income tax; for the remainder, the tax cut is irrelevant. This fact, plus the sectoral restrictions, almost certainly meant that this aspect of the stimulus package would have had virtually no impact.
Similarly restrictive eligibility criteria were applied to the provision of favoura-ble tax treatment to infrastructure projects (Minister of Finance Circular 883/2009). Projects were required to satisfy no fewer than eight conditions. They had to: 1 create a signifi cant number of job opportunities;
2 complement existing infrastructure networks in order to make them more effi cient;
3 produce immediate results, and be able to be completed during 2009; 4 be already designed or be able to be quickly designed;
5 be able to be ‘absorbed’ during 2009;
6 not be affected by land acquisition diffi culties;
7 meet the targets of Presidential Instruction 5/2008 concerning the focus of the economic program for 2008–09; and
8 be part of the government’s strategic plan.
Little of this makes sense. All infrastructure projects create employment, and it is hard to imagine any that would be inconsistent with the government’s programs, given the urgent need for infrastructure spending even if there were no necessity for a stimulus. Provided that projects could be initiated quickly, there is no obvi-ous reason why they would need to be completed in 2009, and it is not clear why it should matter whether they complement existing infrastructure (provided they have positive net social benefi ts). The requirement for immediate results makes
items 4, 5 and 6 redundant. Such an array of requirements seems to do little other than create red tape, opportunities for corrupt behaviour and an unnecessary obstacle to the desired fi scal stimulus.
The 2010 budget assumptions
Most of the assumptions underlying the 2010 budget seem plausible, although some are perplexing. Current indications suggest that the projected GDP growth rate is realistic. The government seems to be expecting the central bank to soften monetary policy somewhat, given that it foresees infl ation roughly doubling from its late 2009
level, with the rupiah weakening from current levels of around Rp 9,400/$. The key item of concern is the assumed oil price of $60/barrel, which is almost certainly too low. By early February 2010, the oil price was close to $84/barrel, and it is likely to increase quite signifi cantly, especially in the second half of 2010, as the recovery of
major world economies strengthens. As in previous years, the fi nance minister has
already signalled the government’s intention to revise its initial, unrealistic oil price assumption, this time to $80/barrel. In the absence of changes to domestic fuel and electricity prices, this will imply a huge rise in subsidies beyond the already high level of about $15 billion in the 2010 budget. Unfortunately, political attacks on the minister and the vice president seem already to have caused the government to back away from its promised reconsideration of subsidies (and the implied shift to aligning domestic energy prices more closely with world levels).
Monetary policy, infl ation, fi nancial markets and government debt
Monetary policy and infl ation
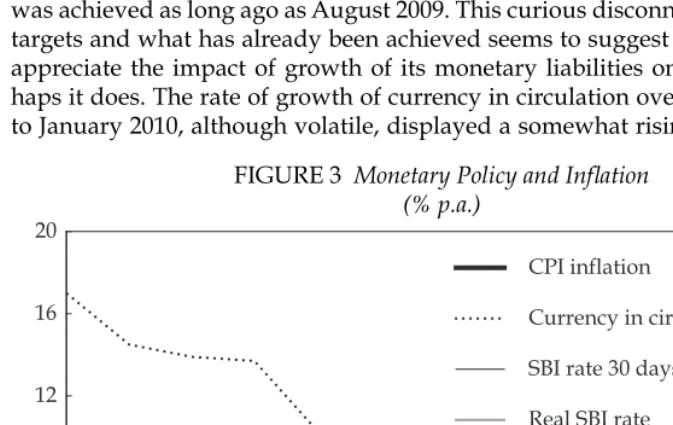
BI seems scarcely to have noticed the recent success of its monetary policy in bringing infl ation as low as 2.4% in November 2009 (fi gure 3). Inexplicably, it has
set its target infl ation rate for 2010 twice as high, at 4–6%, with a ‘declining trend’
toward its medium-term target of 3% (Nasution 2010) – even though that target was achieved as long ago as August 2009. This curious disconnect between future targets and what has already been achieved seems to suggest that BI still fails to appreciate the impact of growth of its monetary liabilities on infl ation. Or
per-haps it does. The rate of growth of currency in circulation over the three months to January 2010, although volatile, displayed a somewhat rising trend, such that
Jan-20090 Mar-2009 May-2009 Jul-2009 Sep-2009 Nov-2009 Jan-2010 4
8 12 16 20
CPI inflation
Currency in circulation
SBI rate 30 days
Real SBI rate
Source: CEIC Asia Database.
FIGURE 3 Monetary Policy and Infl ation (% p.a.)
infl ation increased quite markedly from its previous low point to 3.7% (although
it is possible that this is a short-term aberration). In turn, the real rate of interest on BI Certifi cates (SBIs) has declined – even though the nominal rate has been held
steady since September 2009. This unannounced moderate easing of monetary policy is not consistent with keeping infl ation at the low level already achieved,
but it is consistent with the soft target now set for 2010.
A real SBI rate of about 4% has been consistent with the signifi cant acceleration
of GDP growth already noted, demonstrating that monetary policy through Octo-ber 2009 was entirely appropriate to the circumstances. Nevertheless, the most recent data, combined with the newly announced infl ation target, suggest that
BI is likely to bow to populist demands to lower the nominal SBI rate (Kompas, 7/1/2010), rather than raising it somewhat in order to slow money growth. As has been the case on several occasions in the past – notably in 2000–01, 2004–05 and 2008 – gains on the infl ation front are unlikely to be sustained.
Capital and foreign exchange markets
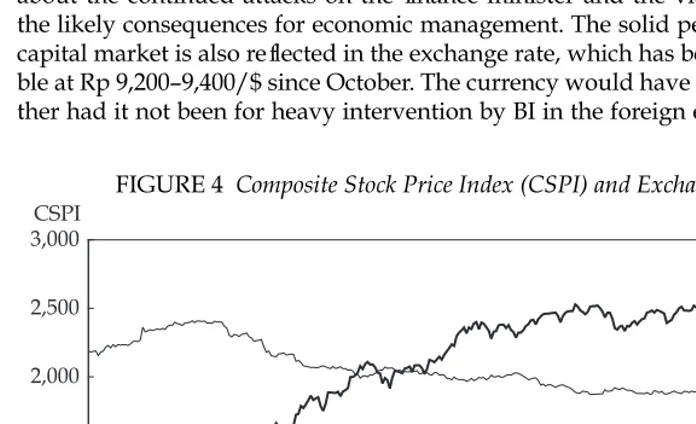
Refl ecting the strengthening of GDP growth, share prices resumed their upward
trend following a short-lived decline in October 2009 (fi gure 4). Investors’
opti-mism is shared by Fitch Ratings, which upgraded Indonesia’s long-term foreign and local currency debt from BB to BB+ on 25 January, with an outlook of ‘sta-ble’ for both (Fitch Ratings, Singapore/London, press release, 25/1/2010). This is Indonesia’s highest rating since the Asian fi nancial crisis in the late 1990s. That
said, the decline in share prices from mid-January may be a refl ection of concern
about the continued attacks on the fi nance minister and the vice president, and
the likely consequences for economic management. The solid performance of the capital market is also refl ected in the exchange rate, which has been relatively
sta-ble at Rp 9,200–9,400/$ since October. The currency would have strengthened fur-ther had it not been for heavy intervention by BI in the foreign exchange market;
31-Dec-20080 19-Mar-2009 5-Jun-2009 21-Aug-2009 6-Nov-2009 26-Jan-2010 500
1,000 1,500 2,000 2,500 3,000
0 3,000 6,000 9,000 12,000 15,000
CSPI
Exchange rate
CSPI Rp/$
Source: Indonesia Stock Exchange; Pacifi c Exchange Rate Service.
FIGURE 4 Composite Stock Price Index (CSPI) and Exchange Rate
this increased its international reserves by about $18 billion from the end of 2008 through January 2010. Although rising reserves are usually portrayed as a sign of successful macroeconomic policies, in fact they simply demonstrate the cen-tral bank’s willingness to spend heavily in the foreign exchange market. BI had to
fi nance a large part of these purchases by issuing SBIs – some $8.5 billion
equiva-lent in the 10 months through October 2009 alone. The interest cost of these SBIs is considerably higher than the yields BI obtains on the reserves, so it is hard to see what Indonesia gains from this investment.
Government debt
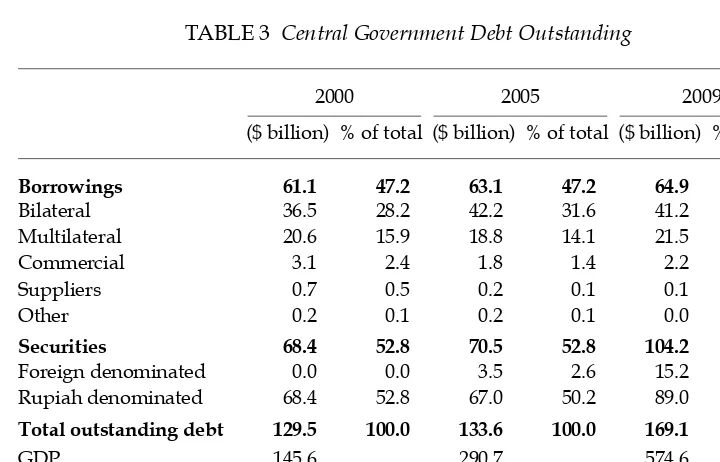
Not least because it has managed to keep its budget defi cits small, the government
has succeeded in reducing its dependence on debt from 89% of GDP in 2000 to 29% as of October 2009 (table 3). This is low by international standards (Ashcroft and Cavanough 2008: 360). During this same period, the role of borrowing (entirely from foreign sources and predominantly in the form of relatively low-cost develop-ment assistance loans) has been declining relative to that of issuing securities (Surat Berharga Negara, SBN) denominated in both domestic and foreign currency.6 Bor-rowing has declined from 47% of total debt in 2000 and 2005 to 38% in October 2009, while securities issued at market rates have increased from 53% to 62%. SBNs
6 The SBN component of the government’s overall debt is often referred to as ‘government domestic debt’, but this term leads to confusion, since a signifi cant portion of it is
actu-ally owned by foreigners. The foreign-owned share of rupiah-denominated SBNs averaged 17% during 2009, rising to almost 20% by 21 January 2010 (MOF 2010).
TABLE 3 Central Government Debt Outstanding
2000 2005 2009a
($ billion) % of total ($ billion) % of total ($ billion) % of total
Borrowings 61.1 47.2 63.1 47.2 64.9 38.4
Bilateral 36.5 28.2 42.2 31.6 41.2 24.3
Multilateral 20.6 15.9 18.8 14.1 21.5 12.7
Commercial 3.1 2.4 1.8 1.4 2.2 1.3
Suppliers 0.7 0.5 0.2 0.1 0.1 0.0
Other 0.2 0.1 0.2 0.1 0.0 0.0
Securities 68.4 52.8 70.5 52.8 104.2 61.6
Foreign denominated 0.0 0.0 3.5 2.6 15.2 9.0
Rupiah denominated 68.4 52.8 67.0 50.2 89.0 52.6
Total outstanding debt 129.5 100.0 133.6 100.0 169.1 100.0
GDP 145.6 290.7 574.6
Debt/GDP (%) 88.9 46.0 29.4
Memo item
Exchange rate (Rp/$) 9,535 9,830 9,400
a The 2009 data are for October.
Source: MOF (2010).
were fi rst introduced in 1998, and were used to recapitalise insolvent banks taken
over by the government; they were denominated almost entirely in rupiah. From 2004, however, the government also began to issue foreign currency-denominated securities. The bulk of securities outstanding in October 2009 were denominated in rupiah; a large proportion of these were in the form of bonds (with fi xed and
variable interest rates), and the rest were treasury bills. The role of government
syariah securities (that is, bonds deemed acceptable for Islamic investors) remains very small for the present.
The government’s initial target for debt fi nancing in 2009 was Rp 51.3 trillion
– almost 39% lower than the realised amount in 2008 (MOF 2009a). However, with the sudden need for fi scal stimulus in 2009 it was instead increased to Rp 133
tril-lion (table 2) – 58% more than in 2008. As it turned out the realised amount was Rp 125.2 trillion. This was more than covered by domestic fi nancing of Rp 142.6
trillion, raised mainly through the issue of government bonds (Rp 102 trillion), allowing foreign fi nancing to be run down by Rp 17.4 trillion. Given the relatively
minor impact of the GFC on Indonesia, there has been no need to draw on the $5.5 billion in stand-by loans committed by Indonesia’s development partners, the World Bank, the Asian Development Bank and the governments of Japan and Australia.
THE FIRST 100 DAYS PROGRAM
The newly assembled government established its ‘100 Days Program’ under the coordination of the vice president and the UKP4 Team, with input from all min-istries and other government agencies. There were 45 programs and 130 action items, with priority given to 15 programs, nine of which are in the fi eld of
eco-nomic policy. Resosudarmo and Yusuf (2009: 304–7) discuss the strategy for the
fi rst 100 days of the second SBY administration, arguing that the intention was to
demonstrate
that the new government is serious about conducting reform. By generating ... quick success stories, the government hopes to create a perception that it has the will and the capacity to tackle reform more generally. … It believes that ... the posi-tive impact resulting from ... small reform projects is likely to create a snowball ef-fect, making it easier to implement much larger and more sensitive reform projects subsequently.
In retrospect this interpretation of the 100-day program may have been too gen-erous. As the authors noted, it had become predictable that the media would use completion of the fi rst 100 days as the basis for generating what they hope will be
a collection of reports on the government’s performance that will be considered newsworthy by the general public. To a government leader in an age in which opinion polls have become very common, this can be a somewhat daunting pros-pect. It does not seem implausible to argue, therefore, that SBY decided to take con-trol of the process by pre-empting the media in its choice of matters for emphasis. Left to itself, the media might have focused on the government’s success – or lack of it – in tackling corruption and crime, improving defi cient infrastructure,
pre-venting electricity black-outs, ensuring compensation for victims of the Lapindo mudfl ow disaster (McMichael 2009) and so on. Instead, media commentators seem
for the most part to have been overwhelmed by the administration’s extraordinar-ily long and often vaguely specifi ed list of things to be achieved in the fi rst 100
days. This kind of approach – ambitious programs with a long list of action items – has been observed before (for a discussion of the problems it entails, see Basri and Patunru 2006). Not least of the diffi culties faced has been even to gain access
to a reliable offi cial list. Government websites have provided different versions,
and offi cials have often gone public with yet different lists. Initially, the most
com-mon classifi cation of tasks was similar to that underlying the government’s fi
ve-year program: physical/geographical infrastructure (roads, ports, electricity and housing); ‘soft infrastructure’ (ease of doing business, logistics, legal certainty and regulatory reform); and ‘social infrastructure’ (social protection for the poor).
In any event, at the end of the fi rst 100 days the president announced that
vir-tually all activities included in the program had been completed on target. The summary of these ‘achievements’ can be found at <http://www.ekon.go.id/ images/capaian100hari.pdf>, a document running to some 50 pages. We focus here only on its economic section, which lists roughly 60 ‘action plans’, for each of which the level of achievement is recorded. For almost every item the level of achievement is given as 100%; a few list achievement in excess of 100%, but none less than that. Taken at face value, the document seems to suggest that the incom-ing government has been performincom-ing extremely well.
If we focus on the concrete, albeit brief, information provided on the nature of these achievements, however, a different picture emerges. For at least half of the individual action items, the achievement amounts to issuing or announcing a new regulation, plan, blueprint, recommendation, policy or set of guidelines, and in several cases nothing more than preparing a draft thereof. In about one-fi fth of
cases the achievement has been to hold one or more meetings, seminars or site visits. In about seven cases, a letter or other document has been sent to the presi-dent or one of the ministers, from whom further action is awaited.
The important distinction to be made here is between inputs and outputs. The inputs in question encompass all the ministerial and bureaucratic activity that lies behind the delivery of services by the government to the public. The outputs are those services themselves. The general public, presumably, is not interested in the fact that ministers and bureaucrats have held meetings or written new regu-lations. What it wants to see is outputs such as improved infrastructure, better law enforcement and so on. While it is true that not enacting laws and issuing regulations often holds back progress, doing these things does not guarantee it. By way of illustration, several years ago a presidential decree was issued that was intended to clarify the government’s power of eminent domain – that is, its power to resume land needed for important public purposes such as building a new road (McLeod 2005b: 146–7). To our knowledge this decree has never been used, yet government offi cials continue to complain that slow progress in building new
infrastructure results from inability to take over the land that is needed.7 Thus, for example, PT Jasa Marga, the state-owned toll road operator, took more than two years to procure just six hectares of land in one case (Kompas, 1/2/2010).
7 Recall that one of the eligibility criteria listed above for infrastructure projects to be given favourable tax treatment as part of the fi scal stimulus package was that the project had to
be free of any land acquisition constraint.
Returning to the ‘achievements’ of the 100-day program, in a few cases 100% completion is claimed, but no concrete evidence of this is provided; in a few more, the information provided actually makes it clear that the target has not been achieved. An example of the latter relates to item P15A2: the plan to establish a food estate in Merauke. The information provided here states explicitly that this has ‘not yet been able to be implemented because certain technical conditions have still to be determined’. Several achievements seem to amount to nothing more than that the relevant department has continued to do its regular day-to-day operations (for example, item P13A3, increasing the capacity of 695 kilometres of roads in Sumatra and Sulawesi), and there is at least one case where the claimed achievement seems quite implausible (item P13A7, providing telephone access to 25,000 villages).8
Aside from the question of what has actually been achieved, little attention seems to have been given to the content of the 100-day program – to its lack of any sense of what is crucial and what is of minor importance, to items that have been left off the list, and to whether particular items have any place there. Two items that are clearly extremely important to Indonesia’s economic progress are policies relating to the subsidisation of fuels, electricity and fertiliser, and to the regulation of minimum wages. The subsidies consume tens of billions of dollars of the gov-ernment’s fi nancial resources, while wage regulation creates an insurmountable
barrier for millions of low-productivity workers who might otherwise join the formal sector workforce. The government claims to have met completely the tar-gets of the relevant action plans. In the fi rst case, ‘completion’ means ‘preparation
of a roadmap for reducing fuel subsidies’ (which seems not to have been made public); subsidies to electricity and fertiliser are not even mentioned. In reality, the Coordinating Minister for Economics has already announced that domestic fuel prices and electricity tariffs will not be changed in 2010 (Kompas, 14/1/2010). In respect of minimum wages, ‘completion’ means that a draft regulation has been delivered to the Minister of Labour and Transmigration; it has yet to be approved and issued and, in any case, no information has been provided as to whether it will free up the labour market or constrain it further.
One of the important policy issues that has been ignored in the 100-day pro-gram is the long-awaited synchronisation of regulations in the mining sector. The related regulatory framework involves laws on oil and gas; minerals and coal; the environment; forestry; spatial planning; and tax. Several cases of overlap and contradiction between these laws have created uncertainty for investors, causing billions of dollars worth of mining investments to be placed on hold.
Another important omission from the program is privatisation. This has never been implemented with any enthusiasm, and now gives every sign of having been reversed. Several of the action plans under the broad heading ‘revitalisa-tion of fertiliser and sugar manufacturing’ actually involve expansion of exist-ing, under-performing state-owned fi rms. Indeed, they even envisage extension
of one such fi rm’s activities overseas through the establishment of a joint-venture
urea factory in Iran. At the same time, new state enterprises have been set up to handle various aspects of infrastructure fi nancing. This refl ects the belief that it
8 Indonesia has about 70,000 villages, so the continuation of progress at this rate would see every village in the country with telephone access in less than nine months!
is lack of fi nancing that is holding up the development of infrastructure, whereas
in fact the greatest obstacle is the unwillingness of the government to recognise the importance of pricing policy relating to infrastructure use. If there were rea-sonable certainty that prices to users could be set on a rational basis rather than determined by political considerations, profi tability would not be at issue, and fi nancing would not be a problem.
A few of the items in the 100-day program deal with some of the sacred cows of policy making in Indonesia, including the supposed need for government support for the development of small and medium enterprises (and the related policy of subsidising, directly or indirectly, the fl ow of outside fi nancing to such fi rms); and
the desirability of self-suffi ciency in various foods, including soy beans, corn, sugar
and beef. Governments at least as far back as the Soeharto era have paid lip service to the need for policies to support small and medium business. There are few if any credible arguments in their favour: countless small and medium fi rms survive and
prosper in the absence of assistance, with some of them going on to become large. The key determinant of small fi rms’ success is the capability of their owners, which
in turn largely determines their access to outside fi nance (if not from banks, then
from a wide range of other sources). Likewise, advocacy of food self-suffi ciency
has very little basis in economic rationality; in particular, it is not sensible for a country with limited land resources to pursue self-suffi ciency in beef.
The substantial decline in the president’s opinion poll ratings has drawn a pre-dictable response from a presidential spokesman, along the lines that ‘the news media had unfairly focused on the [KPK and Bank Century] scandals and ignored the government’s progress in infrastructure projects and other areas’ (Onishi 2010). There are indeed a few important areas where the government has made some progress but, given that these have been lost in a forest of ‘achieved targets’ that are essentially vacuous, the media can hardly be blamed for its failure to focus on the genuine successes. SBY’s decline in popularity may indeed have much to do with the scandals, but it may also refl ect public disappointment with the president’s
attempt to ‘hijack’ the 100-day assessment exercise, and with the government’s failure to distinguish meaningful achievement from mere bureaucratic bustling.
Among the more genuine achievements in the fi rst 100 days are the
commence-ment of 24-hours-a-day, seven-days-a-week operation at Indonesia’s four major ports (in the cities of Jakarta, Medan, Surabaya and Makassar); the launching of the national single window (a one-stop electronic service for import and export clearance); and the issue of a joint decree (by the ministers of trade, home affairs, justice and human rights, and transmigration and manpower, and the head of the investment coordinating board) abolishing 70 business permits, with a view to reducing from 60 days to 17 days the time required to complete licensing proce-dures for the establishment of new businesses (Basri 2010; Lingga 2010).
ASEAN–CHINA FREE TRADE AGREEMENT
The ASEAN–China Free Trade Agreement (ACFTA) signed in November 2004 took effect on 1 January 2010. The agreement requires Indonesia to remove tar-iffs on some 6,682 items spread over 17 sectors, 12 in manufacturing and fi ve
in the agriculture, mining and maritime sectors. Bilateral or limited multilateral trade agreements are not the best approach to trade policy, not least because they can result in ‘trade diversion’ as well as trade creation. Trade diversion refers
to the shift of imports from more effi cient producer countries in the rest of the
world to less effi cient producers within the free trade area (FTA). This could be
avoided if countries within the FTA applied the same tariff levels to the rest of the world as to their partner countries, but that approach is rarely followed. As a consequence, FTAs require highly complex ‘rules of origin’ to prevent effi cient,
low-cost producers in the rest of the world exporting to member countries, indi-rectly, via members with the lowest tariffs against non-members. As the number of agreements joined by a country increases, there is the potential for a ‘spaghetti-bowl effect’ (Bhagwati 2008: 61–71), in which the trade agreements criss-cross and overlap, and the same commodity may be subjected to several different tariff rates and rules of origin. This leads to confusion and increased transactions costs, including bigger bureaucratic hurdles. The ACFTA risks adding to the rather wor-rying global trend towards trade dis-integration and trade diversion, because of its reliance on preferential rather than non-discriminatory tariff reductions – not to mention the far superior options of moving toward freer trade through global trade agreements or unilateral action. Nevertheless, the sheer size of the ACFTA should mean that losses from trade diversion will be small relative to gains from trade creation.
Shortly after the agreement was signed, the ASEAN Secretariat warned that
the ensuing intensifi ed competition in each region’s domestic market given the
similarity in industrial structures of ASEAN and China may entail short-run costs in the form of displacement of workers and rationalisation of some industries and
fi rms. And as such, there would be the need for adjustments amongst workers and
enterprises. (Cordenillo 2005)
Although Indonesian fi rms had had fi ve years to prepare for this new
environ-ment, there were many media reports in late 2009 and early 2010 of manufactur-ers’ concern about the new competitive pressures they now faced. Responding to these pressures, the Minister of Trade reportedly wrote to the ASEAN Secre-tariat requesting re-negotiation of some tariff posts (JP, 6/1/2010), although the veracity of this report is open to doubt. The ASEAN Secretary General denied that the government had explicitly requested any re-negotiation, but acknowl-edged receiving a letter voicing concern about the impact on local industries. The government’s position was later clarifi ed by the Coordinating Minister for
Eco-nomic Affairs (AntaraNews, 19/1/2010): Indonesia would re-negotiate directly with China on 228 items, while also improving infrastructure, logistics and the investment climate.
The parliament, meanwhile, continued to urge the government to do more to protect domestic producers. Members argued that no less than 15 of the 17 sectors ‘needed’ protection: textiles and textile products; food and beverages; petrochemicals; agricultural machinery and equipment; footwear; synthetic fi bre;
electronics; cables and electrical equipment; machinery; steel; automotive com-ponents; cosmetics and traditional herbal medicines; furniture; rubber products; and engineering, procurement and construction services (Suharmoko and Afrida 2010). The analytical basis for this long list is not readily apparent, but it would seem to suggest that the parliamentarians have little understanding of the reasons why nations trade or why protection diminishes the potential gains from trade. Simply put, nations trade in order to increase their access to goods and services,