Full Terms & Conditions of access and use can be found at
http://www.tandfonline.com/action/journalInformation?journalCode=cbie20
Download by: [Universitas Maritim Raja Ali Haji] Date: 19 January 2016, At: 20:16
Bulletin of Indonesian Economic Studies
ISSN: 0007-4918 (Print) 1472-7234 (Online) Journal homepage: http://www.tandfonline.com/loi/cbie20
INDONESIAN TRADE LIBERALISATION: ESTIMATING
THE GAINS
Tubagus Feridhanusetyawan & Mari Pangestu
To cite this article: Tubagus Feridhanusetyawan & Mari Pangestu (2003) INDONESIAN TRADE LIBERALISATION: ESTIMATING THE GAINS, Bulletin of Indonesian Economic Studies, 39:1, 51-74, DOI: 10.1080/00074910302008
To link to this article: http://dx.doi.org/10.1080/00074910302008
Published online: 17 Jun 2010.
Submit your article to this journal
Article views: 141
View related articles
ISSN 0007-4918 print/ISSN 1472-7234 online/03/010051-24 © 2003 Indonesia Project ANU
INDONESIAN TRADE LIBERALISATION:
ESTIMATING THE GAINS
Tubagus Feridhanusetyawan and Mari Pangestu
Centre for Strategic and International Studies, Jakarta
Indonesia has undergone comprehensive trade liberalisation by participating in multilateral and regional trade arrangements and by conducting unilateral liberali-sation. This paper evaluates the different paths of liberalisation the country has fol-lowed, and measures their effects on the economy. It considers the impact of several liberalisation scenarios: unilateral liberalisation; regional liberalisation through APEC (Asia Pacific Economic Cooperation) and AFTA (the ASEAN Free Trade Area); and multilateral trade liberalisation through the Uruguay Round (UR). The results show that the full implementation of UR and APEC liberalisation would greatly benefit Indonesia, and that unilateral liberalisation, carried out in conjunction with the UR commitment, would lead to large welfare gains. On the other hand, the creation of AFTA is expected to add little to welfare in Indonesia or in the other ASEAN mem-ber countries.
INTRODUCTION
Since the mid 1980s Indonesia has undergone comprehensive trade liber-alisation. The initial impetus for unilat-eral efforts to deregulate trade and investment was an adverse external development, namely the 1986 decline in oil prices. Strong political will to de-regulate paved the way for Indonesia’s active participation in the formation of the ASEAN Free Trade Area (AFTA) by 2008, a target later brought forward to 2003 and then to 2002. In 1994, the year it hosted the APEC meeting in Bogor, Indonesia emerged as the champion of concerted unilateral liberalisation, giv-ing APEC the legacy of the Bogor goals of free trade and investment by 2010 for developed countries and 2020 for devel-oping countries. Alongside these spurs to trade and investment liberalisation, Indonesia also had its multilateral
com-mitments under the Uruguay Round Agreement. As part of its UR commit-ments, Indonesia has been reducing its border tariffs, opening its markets, and reducing domestic taxes and subsidies, especially in the agricultural sector.
The aim of this paper is to evaluate the different paths of liberalisation that Indonesia has followed, using a quan-titative economic model to estimate the effects of each on the economies of the Asia Pacific region in general and In-donesia in particular. The objective of such an exercise is to compare the gains from different paths to liberalisation, and assess which set of paths will bring optimal benefits to Indonesia. Various studies using a similar modelling framework have been conducted be-fore, some of them also focusing on ag-ricultural liberalisation in the Asia
Pacific region.1 The contribution of this
paper is to focus on the impact on In-donesia of unilateral liberalisation, of regional liberalisation efforts through APEC and AFTA, and of multilateral trade liberalisation. The focus is on In-donesia, even though the model treats the country as part of an interdepen-dent world economy. The paper con-siders several liberalisation scenarios, which are combinations of unilateral, UR, APEC and AFTA initiatives, and compares the impact of each on wel-fare, output and resource allocation in the economy.
We first discuss the various pressures for trade liberalisation that Indonesia has experienced, and its responses to these through the unilateral, UR, APEC and AFTA processes. We next present the modelling framework in the form of a computable general equilibrium (CGE) model, and discuss the develop-ment of scenarios to represent various schemes of trade liberalisation. The re-sults of the simulation are then pre-sented. The paper closes with a number of conclusions and recommendations.
PRESSURES FOR
TRADE LIBERALISATION
Trade and investment policies have undergone fundamental changes in In-donesia over the last three decades as development strategies have altered: an inward looking import substitution strategy during the oil boom in the early 1970s was followed by limited lib-eralisation and deregulation in the early 1980s, and extensive deregulation and liberalisation after the oil boom ended in the mid 1980s. External pres-sure to liberalise came from the accel-eration of regional efforts in the late 1980s and the first half of the 1990s, and from Indonesia’s commitments under the Uruguay Round Agreement and through the creation of the World Trade
Organization (WTO) at the end of 1994 (effective beginning in 1995).
Unilateral Liberalisation2
The need to diversify Indonesia’s eco-nomic base away from dependence on oil led to dramatic deregulation efforts beginning in 1985. During the years 1985–90, tariffs were rationalised and reduced across the board, and some non-tariff barriers (NTBs) were removed, especially import licensing and import monopolies. As a result, average un-weighted tariffs declined from 27% in 1986 to 20% by 1992. NTBs as a percent-age of tariff lines declined from 32% in 1986 to 17% in 1990 and to 5% by 1992; as a percentage of imports they fell from 43% in 1986 to 13% by 1990. Other im-portant reforms included replacing the corrupt customs service with a private Swiss surveying company (Société Générale de Surveillance, SGS) (Panges-tu 1996). The duty drawback scheme for exporters was improved substantially, and more liberal treatment was given to export-oriented investments with re-spect to foreign ownership and exemp-tion from duties and value added tax (VAT). Restrictions on other investment were also reduced. These trade and in-vestment reforms led to rapid growth of non-oil exports, to the consequent di-versification of Indonesia’s export base, and to inflows of export-oriented do-mestic and foreign investment. Growth tended to be in the sectors in which In-donesia has a comparative advantage, especially those that are unskilled labour intensive.
By 1991 progress on unilateral reforms had slowed because of the difficulty of reducing protection and removing NTBs in politically sensitive sectors such as ag-riculture (e.g. sugar, wheat flour, soy-beans, garlic, cloves, milk and dairy products), and in certain manufacturing subsectors such as motor vehicles,
tic and cement.3 Another wave of
unilat-eral investment and trade reform began in 1994, apparently influenced by Indo-nesia’s external commitments. Foreign ownership restrictions and divestment requirements were liberalised dramati-cally in consequence of Indonesia’s host-ing of that year’s APEC meethost-ing. In May 1995 a comprehensive program of tariff reductions (affecting 64% of tariff lines) was announced. It contained, for the first time, a schedule for tariff reduction for the 1995–2003 period. The government announced that by 2003 all tariffs except those on motor vehicle components and products would be set at a maximum of 10%, with most falling in the 0–5% range. This timetable was influenced by the AFTA schedule that the government had to prepare, although tariffs for intra-ASEAN trade under AFTA were to fall to a lower target rate of 0–5%. This was followed by another trade liberalisation package in 1996, bringing average un-weighted tariffs down to 12%, and NTBs to around 3% of tariff lines and 12% of imports.
Before the 1997 crisis, therefore, trade and investment liberalisation had made considerable progress. Since the crisis further liberalisation, including of the agricultural sector, has taken place un-der Indonesia’s Letters of Intent (LOI) to the IMF. For a large number of tariff lines, the 2003 targets had already been realised in 1998/99. There were some in-consistencies, however, as the case of rice shows. Before the crisis, the logis-tics agency, Bulog, had the monopoly on rice imports, but under the LOI this mo-nopoly was revoked and replaced by a 30% tariff.
In June 1999, separately from the IMF package, the government announced a major liberalisation of the most pro-tected manufacturing sector, motor ve-hicles. It comprised removal of local content requirements, reduction of
tar-iffs on imported cars and components, and simplification of licensing proce-dures. The reforms were aimed at de-veloping an efficient and globally competitive motor vehicle sector.
The Uruguay Round and the WTO4
The completion of the GATT Uruguay Round negotiations in 1994 was fol-lowed by the establishment of the WTO on 1 January 1995. Indonesia’s commit-ments to the WTO can be summarised under six major areas.
The first is the binding of a majority of tariffs across the board at the ceiling rate of 40%. The bindings cover 95% of all tariff items and 92% of all imports. This commitment had little impact on actual trade liberalisation because the average tariff line already carried a tar-iff of around 15% in 1994.
The second area is the agricultural sector, with tariffication of quantitative restrictions and binding of tariffs on all agricultural items, and a reduction in tariffs of at least 10% per line item, or about 24% overall, during the 10 years from 1994. In addition, as part of the agreement on Trade Related Invest-ment Measures (TRIMs), the local con-tent requirement for milk products was to be notified to the WTO and elimi-nated by the end of 2000. Indonesia did in fact fulfil this commitment. In terms of minimum market access, the govern-ment agreed to the import of 70,000 tons of rice annually (at a 90% tariff). Rice subsidies were still allowed. As was the case for many other countries, the tariffication and the bound rates set for agricultural tariffs in Indonesia’s WTO agreement were well above the actual tariff levels for agricultural prod-ucts. Finally, under the UR agreement, the special status of Bulog as a state trading enterprise dealing with strate-gic food items was notified and main-tained under the provision on ‘green
efit Indonesia is the elimination of bilat-eral quotas imposed under the Multi-Fibre Arrangement (MFA). Under the UR all bilateral import quotas on textiles and garments are to be removed by 2005, and the only trade restrictions in place will be bound tariffs. Since Indonesia is an important textile and clothing ex-porter, it could be a major beneficiary of the elimination of the MFA quotas.
Another important characteristic of the UR agreement is its emphasis on progres-sive agricultural liberalisation. Other in-ternational trade agreements, many of which are more progressive than the UR in terms of eliminating barriers on non-agricultural products, often exclude or contain minimal commitments on agri-cultural liberalisation. APEC, for in-stance, is more extensive in its tariff reductions, yet lacks any real program for removal of other distortions in the agri-cultural sector. The success of the UR in including agriculture in its agreement has become the primary source of efficiency gains in this sector. Prior to this agree-ment, trading economies could impose inefficient and costly barriers, since the sector was not regulated under the GATT or the WTO rules.
Apart from gaining greater access to external markets, Indonesia should also benefit from its participation in the WTO because of pressure to impose internal discipline, for example by reducing do-mestic distortions in agriculture, refrain-ing from imposrefrain-ing higher tariffs on the bound items committed in the WTO, and further reducing tariffs on the re-maining sensitive and exempted items.6
Asia Pacific Economic Cooperation At this stage, economic cooperation un-der APEC remains informal, in the sense that the decisions taken in APEC are not made through a process of negotiation and are not binding. APEC was created box measures’ (dealing with domestic
support and not regarded as NTBs).5
The third area covered by Indonesia’s WTO undertakings is the commitment to remove non-tariff barriers, such as various import licensing schemes, in the 10 years from 1994. The most common NTBs to be removed are the Import Pro-ducer licences for iron and steel prod-ucts, engines and engine parts, heavy transport equipment, and electronic products. Others include Approved Im-porter and Approved Sole Agent li-cences, which were applied to various industries, ranging from food-related subsectors to lubricants.
The fourth area is the elimination of all import surcharges on items included in Indonesia’s market access offer over the 10-year period from 1994. As noted earlier, Indonesia unilaterally acceler-ated its liberalisation measures in this area under two deregulation packages in June 1994 and June 1995.
The fifth area is the commitment to liberalise, or to the binding of existing market access opportunities for, five ser-vices sectors, namely telecommunica-tions, industrial services, tourism, financial services and banking.
The last area is the commitment to remove local content regulations under the TRIMs agreement, with the local content requirements for motor vehicles and agricultural products being notified in 1995 and removed by the end of 2000. The government took a step backward in its liberalisation program in 1996, with the passage of a controversial na-tional car policy that reinstated certain local content requirements, and with the introduction of other policies that ap-peared to violate Most Favoured Nation (MFN) and national treatment under the GATT rules.
One important characteristic of the WTO agreement that is expected to
in 1989 in order to bring the countries of the western Pacific closer to the eastern Pacific region. In the wake of trade ten-sions between the US and Japan, there was serious concern that trade conflicts might occur between the western and eastern sides of the Pacific Ocean. The main impetus for liberalisation in APEC came in 1993, with the first Leaders Meeting in Seattle providing a vision of free trade and investment in the region. In the following year Indonesia hosted the meeting, contributing to the APEC process by setting the long-term goal of free and open trade and investment in the Asia Pacific region, by 2010 for de-veloped economies and 2020 for devel-oping countries. In 1994, the architecture of APEC was also introduced, namely the three pillars of trade and investment liberalisation, trade and investment fa-cilitation, and economic and technical cooperation. The APEC non-binding investment principles, intended to en-sure equal treatment for domestic and foreign investors regardless of origin, were introduced in the same year. For a country that has traditionally been na-tionalistic and clearly saw foreign investment as having a supplementary role, Indonesia played a major part in ensuring that these principles were adopted. Their acceptance (in spite of their being non-binding) was a major breakthrough for Indonesia and other APEC members.
The framework and action agenda for APEC-style liberalisation, facilitation and cooperation were set in the follow-ing two years, 1995 and 1996. The APEC process did not adopt the preferential regional liberalisation route, but instead envisaged a process of ‘unilateral con-certed liberalisation’, which means that members voluntarily undertake unilat-eral libunilat-eralisation toward all countries, not just APEC members (i.e. on an MFN
basis). APEC contributes to the process through confidence building and peer pressure to encourage all members to act similarly. The process relies on there being ‘champions’ who voluntarily undertake these unilateral liberalisation efforts, with the economy hosting the APEC meeting often taking on the role of champion. The APEC process clearly had an influence on the trade and invest-ment liberalisation that Indonesia un-dertook in 1994 and 1995.
Members are also asked to provide individual action plans annually, to in-dicate the unilateral schedule of liberal-isation, facilitation and, more recently, economic and technical cooperation (Ecotech). The voluntary and non-binding nature of APEC has often been criticised as not amounting to much by way of pressure and discipline to under-take trade liberalisation and accompa-nying reforms. However, the experience of the mid 1990s shows that the APEC process did play a role in building con-fidence and applying peer pressure to undertake concerted unilateral liberali-sation. An unmeasurable benefit of APEC is the extent to which capacity and knowledge building on matters related to trade and investment liberalisation and facilitation occurs just through attendance at the meetings, interaction, and the need to come up with positions and principles in an informal, non-negotiating and non-binding setting.
APEC has also been seen as instru-mental in acting as a catalyst for the WTO. In 1993 the Informal APEC Lead-ers Meeting was said to have served as a warning signal to Europe, paving the way for discussion and compromise to overcome the deadlock on agricultural liberalisation which had been one of the main obstacles to the completion of the Uruguay Round. In 1996 APEC was able to provide the critical mass to launch
Unprocessed agricultural products were then placed on the inclusion list (CEPT), the temporary exclusion list, or the sen-sitive list. Items in the latter were to be liberalised under a separate schedule, but this was intended to go beyond ASEAN’s commitments in agriculture under the WTO. Tentative lists available at the time of writing indicated that close to 70% of unprocessed agricultural products were to be on the inclusion list. Items on the temporary exclusion list were to be phased into the inclusion list by 2003. There has been agreement that the sensitive list should be kept to a minimum; up to 2000 it comprised around 10% of the tariff lines in unproc-essed agricultural products.
Despite accelerated progress in the mid 1990s, difficulties were experienced in reaching agreement on the agricul-tural items that were to be included in the temporary exclusion and sensitive lists, and on the deadline by which all items were to be phased into the inclu-sion list. At the ASEAN summit in 1995, for example, Indonesia reintroduced to its sensitive list 15 agricultural products that had earlier been in the temporary exclusion list. The majority of these products were items whose sale was co-ordinated by Bulog, including rice, sugar, wheat flour and soybeans.
Indonesia’s decision to postpone the liberalisation of these 15 food items dominated the 10th AFTA Council meet-ing in Jakarta in September 1996. Indo-nesia, supported by the Philippines, refused to accept a 2010 deadline for in-cluding rice and sugar in the CEPT scheme. In addition to the sensitive list, it created a new list called the ‘very sen-sitive list’ and included these two items in that list. Indonesia and the Philippines demanded that the 2010 deadline be pushed back by 10 years. On the other side, Thailand insisted that all unproc-essed agricultural commodities be negotiations under the WTO that led to
the Information Technology Agreement (ITA) to reduce tariffs on information technology products.7
ASEAN and AFTA
The Association of Southeast Asian Na-tions (ASEAN) has existed since 1967, but it was only in January 1992 that its members agreed to the formation of an ASEAN Free Trade Area in 2003. Origi-nally, 15 commodity groups were cho-sen to be on the fast track for tariff reduction,8 including politically
sensi-tive agricultural commodities such as vegetable oils. Under the fast track scheme, products with tariffs greater than 20% have their tariffs immediately reduced to 20% and to 0–5% within 10 years, while fast track products with tar-iffs at 20% or below have their tartar-iffs reduced to 0–5% within seven years. To qualify for the intra-ASEAN Common Effective Preferential Tariff (CEPT), goods must satisfy the ASEAN content requirement of 40%, referring to both single country and cumulative ASEAN content. Unprocessed agricultural prod-ucts were initially excluded from the CEPT.
Various factors, including the com-mitments under the UR, progress in APEC, and unilateral liberalisation, con-tributed to a process of acceleration and deepening of AFTA and ASEAN coop-eration, with the timetable for tariff re-ductions being brought forward from 2003 to 2002. Subsequently, tariff reduc-tions on a number of additional prod-ucts were accelerated to 2000, which meant that by that year 88% of tariff lines were in the 0–5% tariff range.
The product coverage of the CEPT was broadened to include unprocessed agricultural products. This meant that by 2000 all goods were basically under CEPT coverage, apart from a few items classified under ‘general exclusions’.
agreeing to grant MFN and national treatment to ASEAN member countries, and to promote transparency in its trade regime. Vietnam was allowed to accede to AFTA immediately, although with flexible terms under which it had a time frame of 10 years (1996–2006) to reduce tariffs to AFTA levels. Vietnam offered to reduce tariffs on 857 lines—28% of the total—upon its entry to the CEPT scheme on 1 January 1996. The Decem-ber 1996 Summit agreed to include Cam-bodia, Laos and Myanmar in ASEAN. At the Ministerial Meeting in July 1997, Laos and Myanmar were formally ad-mitted as the eighth and ninth members, but the admission of Cambodia was postponed owing to the political turmoil in the region at the time. Finally, in De-cember 1998, at the Sixth Summit, ASEAN leaders decided to allow Cam-bodia to enter, and in April 1999 it was formally accepted as the tenth member. In addition to the decision to admit Cambodia, the Sixth ASEAN Summit in Hanoi also adopted the Hanoi Plan of Action (HPA), a document that was drafted to realise the ‘ASEAN Vision 2020’ adopted at the Second ASEAN In-formal Summit held in Kuala Lumpur in December 1997. The ASEAN Vision 2020 describes an ideal form of coopera-tion among Southeast Asian nacoopera-tions. In the HPA, ASEAN leaders agreed to ac-celerate the implementation of AFTA by maximising the number of tariff lines whose CEPT tariff rates were to be re-duced to 0–5% by the year 2000 (2003 for Vietnam and 2005 for Laos and Myanmar). This meant that by January 2000 more than 85% of products were to have 0–5% tariffs. The leaders also agreed to maximise the number of tariff lines whose CEPT rates were to be re-duced to 0% by 2003 (2006 for Vietnam and 2008 for Laos and Myanmar).
Despite these bold measures, some ASEAN members were reluctant to phased into the scheme by 1 January
2003 and be totally liberalised by 2010. By the end of the meeting, it was agreed that the liberalisation of the sensitive agricultural commodities would begin in January 2003 and end in 2010, but that Indonesia and the Philippines would be allowed some flexibility with regard to the end tariff rates and utilisation of safe-guards (i.e. temporary protection mea-sures) in 2010. With such flexibility, Indonesia can still maintain import tar-iffs on rice and sugar above 5% after 2010, and introduce safeguard measures intended to protect domestic producers. Apart from the setback in agricultural liberalisation, discipline was introduced into the use of temporary exclusion lists through the requirement that all goods that had been temporarily excluded from tariff reductions be phased into the CEPT by 1 January 2001. Products in the temporary exclusion list were to be transferred to the inclusion list in five equal instalments of 20%, beginning on 1 January 1996. There have also been in-dications of further broadening of the coverage of liberalisation, especially to encompass new areas that have been included in the WTO, such as services, investment and intellectual property rights.
Furthermore, progress has been made in customs harmonisation between coun-tries, including the implementation of a ‘green [no customs inspection] lane’ for CEPT products, to speed up customs clearance of shipments. The tariff no-menclature was harmonised at the HS (Harmonised System) 8-digit level in 1997, the GATT valuation system was adopted in the same year, and an ASEAN Agreement on Customs was drafted to strengthen the commitment to customs harmonisation.
Finally, there was a widening of ASEAN membership. Vietnam became the seventh member in July 1995, after
open their markets fully. Malaysia, for instance, wanted to delay the imple-mentation of tariff cuts that were due to commence in 2000. In particular, it wanted to exempt motor vehicles from the inclusion list of sectors to be liberalised in 2003. Nevertheless, AFTA members as a group seemed intent upon liberalising the region. In the joint statement from the AFTA Council meeting in September 1999, ASEAN economic leaders expressed their inten-tion to eliminate import duties on all products by 2015 for the six original ASEAN members (Brunei Darussalam, Indonesia, Malaysia, the Philippines, Singapore and Thailand) and by 2018 for the newer members (Laos, Myan-mar, Vietnam and Cambodia). As an interim measure, ASEAN countries were to reduce tariffs on 60% of their products to 0% by 2003.9
COMPARING THE PROCESSES OF LIBERALISATION
The most effective liberalisation is uni-lateral. However, in Indonesia’s case, regional commitments and efforts have complemented the unilateral process. The multilateral process under the WTO has been important in placing some discipline on the types of trade and investment policies that a country like Indonesia can adopt. It has helped to keep the unilateral liberalisation pro-cess on track and has imposed disci-pline with respect to a mutually agreed set of multilateral rules.
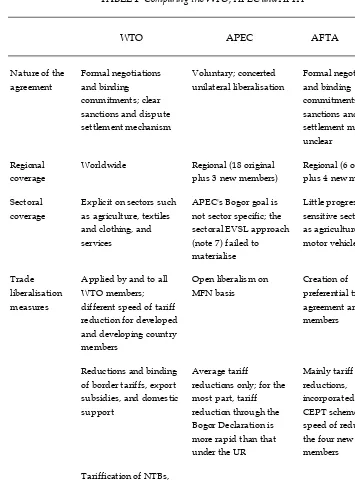
In pursuing their liberalisation goals, APEC, the WTO and AFTA use differ-ent approaches (table 1). The WTO uses a legalistic approach in which a liberal-isation agreement is legally binding and signatories face potential sanctions if they fail to implement their commit-ments. APEC promotes liberalisation by adopting ‘concerted unilateral liberali-sation’. In essence, this mechanism
al-lows APEC economies to achieve the goal decided at the 1994 Bogor Meet-ing—free and open trade and invest-ment by 2010 for developed economies and 2020 for developing economies— through unilateral liberalisation plans or Individual Action Plans (IAPs). These IAPs can be implemented according to each economy’s domestic policy objec-tives and are reviewed jointly by all APEC members in order to achieve the Bogor targets. On the surface, AFTA looks like the WTO in the sense that its members have jointly set and commit-ted to a tariff reduction scheme leading to a common tariff level within a certain period. It is supposed to be a binding commitment, but in contrast to the WTO, it is not clear what the sanctions are for violating the AFTA commit-ments. AFTA therefore plays a much weaker disciplining role.
The voluntary mechanism of APEC was deemed best at the time it was adopted, given the initial resistance of the Asian members to a more legalistic approach.10 One of the arguments for
this position was that it would take years to change APEC into a negotiat-ing body like the WTO, and that would mean losing the momentum provided by the Bogor Declaration. The volun-tary mechanism has so far been success-ful in pushing for tariff liberalisation towards the Bogor target. The challenge now is to accelerate this process.
The WTO, APEC and AFTA have dif-ferent targets for tariff reduction. In terms of the average tariff, the Bogor goal of APEC, for example, proposed a more rapid tariff reduction than that re-quired by the UR commitments of APEC member economies (PECC 1995; Pangestu, Findlay et al. 1996; Yama-zawa 1997; Pangestu and Stephenson 1996). All individual APEC economies are well on track to meet the Bogor goal. Their tariff reductions are, for the most
part, faster and deeper than their UR commitments.
AFTA is more far reaching than the WTO and APEC in terms of tariff re-ductions, and so will achieve the
tar-geted 0–5% tariffs sooner than the other two schemes. However, unlike WTO commitments and voluntary unilateral liberalisation under APEC, tariff reduc-tion under AFTA is applicable only to
TABLE 1 Comparing the WTO, APEC and AFTA
WTO APEC AFTA
Nature of the agreement
Formal negotiations and binding commitments; clear sanctions and dispute settlement mechanism
Voluntary; concerted unilateral liberalisation
Formal negotiations and binding commitments; sanctions and dispute settlement mechanism unclear
Regional coverage
Worldwide Regional (18 original
plus 3 new members)
Regional (6 original plus 4 new members) Sectoral
coverage
Explicit on sectors such as agriculture, textiles and clothing, and services
APEC's Bogor goal is not sector specific; the sectoral EVSL approach (note 7) failed to materialise
Little progress in sensitive sectors such as agriculture and motor vehicles
Trade liberalisation measures
Applied by and to all WTO members; different speed of tariff reduction for developed and developing country members
Open liberalism on MFN basis
Creation of preferential trading agreement among members
Reductions and binding of border tariffs, export subsidies, and domestic support
Average tariff reductions only; for the most part, tariff reduction through the Bogor Declaration is more rapid than that under the UR
Mainly tariff reductions, incorporated in the CEPT scheme; slower speed of reduction for the four new ASEAN members
Tariffication of NTBs, especially for the agricultural and textiles and clothing sectors
the AFTA member economies. In real-ity, owing to rapid progress in unilat-eral libunilat-eralisation in each of the AFTA member economies, the difference be-tween the preferential AFTA tariff and the MFN tariff for non-AFTA econo-mies is small, so that the percentage of intra-ASEAN trade conducted at the preferential AFTA tariff is very small (Soesastro 2001).
If one looks beyond tariff liberalisa-tion, the WTO is more comprehensive than either AFTA or APEC. The latter two concentrate mainly on tariff reduc-tion, while under the WTO there is al-ready a commitment to eliminate domestic distortions, non-tariff barri-ers, dumping and even other possible discriminatory actions. Furthermore, in contrast to the WTO, under AFTA there is no clear agenda for agricultural lib-eralisation. As we have seen, another important difference between the WTO on the one hand and AFTA and APEC on the other is that, given the binding nature of its commitments, the WTO is more effective in ensuring that the lib-eralisation and reforms implemented under its auspices remain on track.
MODELLING TRADE LIBERALISATION
The impact of international trade liber-alisation on Indonesia’s economy is modelled in this paper using a global CGE framework known as the Global Trade Analysis Project (GTAP).11 GTAP
relies on a frequently updated database. This study uses the third version of the database, for two reasons. First, the tar-iff lines in version 3 of the database are based on 1994 data and therefore more realistically represent the situation when the UR and other regional arrangements were launched in the early 1990s. Tariff rates in version 4 of the database (based on 1996 data) are much lower than those in version 3, partly because of rapid
worldwide tariff reductions between 1993 and 1996 as a result of the UR com-mitments made in 1994. It was therefore decided to apply the tariff reductions committed to in 1994 to 1994 tariff data, rather than 1996 data, to capture the real impact of UR liberalisation. Second, ver-sion 3 of the GTAP database has a built-in calculation of UR tariff reductions, so their impact can be modelled more pre-cisely.
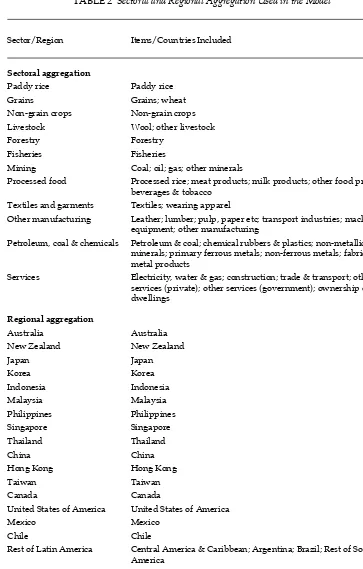
To model the impact of trade liberal-isation in this global CGE model, the world economy is aggregated into 19 regions and 12 sectors. Table 2 shows how the original 37 commodities are ag-gregated. The sectoral aggregation se-lected uses a detailed breakdown of the agricultural sector, because some sce-narios in this study explicitly estimate the impact of agricultural liberalisation. There are 12 sectors in total: four agri-cultural subsectors (paddy rice; grain; other crops; and livestock), three other primary sectors (forestry; fisheries; and mining), four manufacturing sectors (textiles and garments; processed food; petroleum–metal–chemical; and other manufacturing), and one aggregated service sector. The table also indicates groups of countries that have been ag-gregated into regions. The world economy is aggregated into 19 regions in order to give a detailed coverage of the Asia Pacific region, especially the APEC member economies. While most of the Asia Pacific economies are indi-vidually classified in the model, some economies in other regions such as Eu-rope and Latin America are aggregated into larger groupings.
We model a range of trade liberali-sation approaches. The purpose is to simulate what would happen if each approach was followed, and what would happen if the existing agree-ments were expanded to include the ag-ricultural sector. Initially we consider
TABLE 2 Sectoral and Regional AggregationUsed in the Model
Sector/Region Items/Countries Included
Sectoral aggregation
Paddy rice Paddy rice
Grains Grains; wheat
Non-grain crops Non-grain crops
Livestock Wool; other livestock
Forestry Forestry
Fisheries Fisheries
Mining Coal; oil; gas; other minerals
Processed food Processed rice; meat products; milk products; other food products;
beverages & tobacco
Textiles and garments Textiles; wearing apparel
Other manufacturing Leather; lumber; pulp, paper etc; transport industries; machinery &
equipment; other manufacturing
Petroleum, coal & chemicals Petroleum & coal; chemical rubbers & plastics; non-metallic
minerals; primary ferrous metals; non-ferrous metals; fabricated metal products
Services Electricity, water & gas; construction; trade & transport; other
services (private); other services (government); ownership of dwellings
Regional aggregation
Australia Australia
New Zealand New Zealand
Japan Japan
Korea Korea
Indonesia Indonesia
Malaysia Malaysia
Philippines Philippines
Singapore Singapore
Thailand Thailand
China China
Hong Kong Hong Kong
Taiwan Taiwan
Canada Canada
United States of America United States of America
Mexico Mexico
Chile Chile
Rest of Latin America Central America & Caribbean; Argentina; Brazil; Rest of South
America
European Union European Union 12
Rest of the world India; Rest of South Asia; Austria; Finland; Sweden; European Free
Trade Area; Central European Associates; Former Soviet Union; Middle East; North Africa; Sub-Saharan Africa; and other countries
the impact of full implementation of the UR by all countries. This serves as a benchmark for results from other simu-lations, because almost every economy participates, and because the UR im-port tariff reductions are smaller than the commitments under APEC and AFTA. In other words, the UR scenario is the minimum liberalisation scheme committed to by every region (other than China and Taiwan, which only later joined the WTO).
In accordance with the UR commit-ments, four different shocks are applied: • domestic tax or subsidy reductions in the agricultural subsectors, by 20% in developed countries and 13% in de-veloping countries;
• agricultural export tax or subsidy re-duction, by 36% in developed countries and 24% in developing countries; • tariff reductions, in both agricultural and non-agricultural commodities, cal-culated using the pre-UR and post-UR tariff data available in the GTAP version 3 database;
• elimination of MFA quotas by cut-ting the export tariff equivalent of the quota, data on which are also provided by the GTAP database.
Note that, in all scenarios, there is no trade liberalisation in services. In other words, there is no shock applied to the services sector.
The first of the remaining trade policy scenarios assumes full implementation of the UR elsewhere plus unilateral lib-eralisation by Indonesia, such that the tariff reduction goes further, with a 5% across-the-board import tariff set on both agricultural and non-agricultural commodities. The second such scenario simulates the impact of AFTA in com-bination with the UR. The first variant of this scenario excludes liberalisation of the agriculture sector (simply follow-ing the UR commitments), while the sec-ond includes it.
Whereas the UR includes reduction of domestic distortions, export taxes and import tariffs, AFTA requires reductions only in import tariffs, although these are much greater than the UR reductions. AFTA’s schedule for tariff reductions and the implementation of the free trade zone in 2003 is faster than the APEC schedule, with its end dates of 2010 and 2020. How-ever, in terms of coverage AFTA is more restrictive, because tariff reductions are applied only to intra-ASEAN trade, while tariffs on imports from non-ASEAN members are maintained.
To model the combined impact of UR and AFTA trade liberalisation, we ap-ply domestic subsidy and export tax re-ductions in agriculture in accordance with the UR commitments, while im-port tariff reductions follow the AFTA scheme. Tariffs between ASEAN mem-ber economies are reduced to zero, while tariffs between ASEAN and non-ASEAN economies are maintained at the level committed for the UR. In other words, the model simulates the forma-tion of AFTA as a free trade area that maintains some trade barriers against non-ASEAN member economies.
The third scenario is a combination of the UR and APEC schemes, focus-ing on the contribution of APEC to re-gional economies if its liberalisation principles were to be applied in addi-tion to the UR commitments. As with the first AFTA scenario, reductions in domestic and export subsidies in agri-culture are applied in accordance with the UR commitments, while import tar-iff reductions are calculated based on the APEC commitments: the Bogor goal of achieving zero tariffs in 2010 for the developed and 2020 for the developing economies of APEC.12 Since the GTAP
is a static model, this study applies the targeted tariff structure for 2010 (i.e. assuming the changes are brought in immediately), when all tariffs of
oped economies in APEC are assumed to be zero, while those in APEC’s de-veloping economies are assumed to be 5%. As before, the first variant of this scenario excludes liberalisation of the agriculture sector (simply following the UR commitments), while the second includes it. Unlike AFTA, under which only intra-ASEAN tariffs are reduced, tariff reductions by all APEC member economies are applied on an MFN ba-sis, in line with the open regionalism spirit of APEC.
RESULTS Welfare
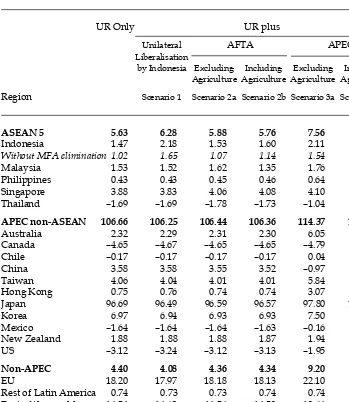
The CGE approach permits a compari-son of the effects of different trade lib-eralisation scenarios on the economy. The impact on welfare of liberalisation under the various scenarios, measured as the value of equivalent variation,13 is
presented in table 3. Although in real-ity tariff reductions in several of these scenarios will be phased in over time, for present purposes it is assumed that the structure of tariffs as targeted for 2010 under each scenario applies with immediate effect. The outcomes should be interpreted as welfare changes (in-creases or de(in-creases) compared with the case without any trade liberalisa-tion. Figure 1 compares Indonesia’s welfare gains under each scenario as a share of 1995 GDP, while figure 2 com-pares welfare gains in various econo-mies under the UR and UR plus APEC scenarios (again as a share of 1995 GDP). The results in general confirm the conventional wisdom that a more liberal trade regime leads to greater welfare. Broader country participation, larger tariff reductions and wider sectoral coverage also enhance the ben-efits of trade liberalisation.
The welfare gain to Indonesia’s economy as it was in 1994, as a result of participating in the UR, is estimated at
about $1.5 billion (table 3).14 A
signifi-cant part of this gain comes from the elimination of the MFA quotas: without this, the estimated welfare gain would be only about $1 billion.15 The gain
would increase significantly, to around $2.2 billion, if Indonesia decided unilat-erally to reduce all of its tariffs to 5%. In other words, by unilaterally liberalising trade, Indonesia increases the potential welfare gain by half. The gain from UR liberalisation plus participation in APEC—around $2.1 billion—is roughly the same as that from unilateral liberal-isation. By contrast, the benefit from participation in AFTA, over and above the benefits from UR liberalisation, is negligible.
Table 3 shows also that trade liberal-isation by the AFTA route contributes very little to welfare gains for the ASEAN member economies as a group, over and above what has been achieved from the UR. By contrast, there is a sig-nificant additional gain for ASEAN from participation in APEC, over and above that from implementing the UR alone. The reason for the small welfare impact of AFTA is mainly that it creates a free trade area among its members, and since ASEAN member economies trade more with non-ASEAN members than with each other, the negative impact of trade diversion outweighs the positive effect of trade creation.16
While Indonesia would benefit from the elimination of the MFA, this is not the case for all ASEAN members. For example, without the elimination of the MFA, the increases in welfare in Malay-sia and the Philippines under AFTA liberalisation scenario 2b ($1.40 billion and $0.78 billion, respectively) would be greater than the gain with the elimina-tion of the MFA shown in table 3 ($1.35 billion and $0.46 billion). With the elimi-nation of the MFA, Indonesia, being the most competitive textile producer,
would dominate ASEAN textile exports. Thus the elimination of the MFA quota would create large additional benefits for Indonesia at the expense of some other ASEAN economies.
The inclusion of the agricultural sec-tor in the AFTA liberalisation scenario results in a slight reduction in the
aggregate welfare gain for ASEAN members as a group. There is some ad-ditional benefit to Indonesia, which becomes the major agricultural export-ing country in ASEAN as a conse-quence of becoming more competitive in agriculture than the other members. The gains to Malaysia become
notice-TABLE 3 Impact of Trade Liberalisation on Welfare (Equivalent Variation)a ($ billion)
UR Only UR plus
Unilateral AFTA APEC
Liberalisation
by Indonesia Excluding Including Excluding Including
Agriculture Agriculture Agriculture Agriculture
Region Scenario 1 Scenario 2a Scenario 2b Scenario 3a Scenario 3b
ASEAN 5 5.63 6.28 5.88 5.76 7.56 7.70
Indonesia 1.47 2.18 1.53 1.60 2.11 2.10
Without MFA elimination 1.02 1.65 1.07 1.14 1.54 1.54
Malaysia 1.53 1.52 1.62 1.35 1.76 1.74 Philippines 0.43 0.43 0.45 0.46 0.64 0.85 Singapore 3.88 3.83 4.06 4.08 4.10 4.13 Thailand –1.69 –1.69 –1.78 –1.73 –1.04 –1.12
APEC non-ASEAN 106.66 106.25 106.44 106.36 114.37 118.99
Australia 2.32 2.29 2.31 2.30 6.05 5.51 Canada –4.65 –4.67 –4.65 –4.65 –4.79 –4.84 Chile –0.17 –0.17 –0.17 –0.17 0.04 0.05 China 3.58 3.58 3.55 3.52 –0.97 –0.67 Taiwan 4.06 4.04 4.01 4.01 5.84 7.76 Hong Kong 0.75 0.76 0.74 0.74 3.07 3.02 Japan 96.69 96.49 96.59 96.57 97.80 100.57 Korea 6.97 6.94 6.93 6.93 7.50 8.10 Mexico –1.64 –1.64 –1.64 –1.63 –0.16 –0.11 New Zealand 1.88 1.88 1.88 1.87 1.94 1.90 US –3.12 –3.24 –3.12 –3.13 –1.95 –2.31
Non-APEC 4.40 4.08 4.36 4.34 9.20 8.85
EU 18.20 17.97 18.18 18.13 22.10 21.69 Rest of Latin America 0.74 0.73 0.73 0.74 0.74 0.71 Rest of the world –14.54 –14.62 –14.56 –14.53 –13.64 –13.55
World total 116.68 116.61 116.67 116.46 131.14 135.53
aExcept as noted for Indonesia, all scenarios include the elimination of the MFA. The result
of liberalisation without MFA elimination is presented for Indonesia only, to show the difference between the two outcomes.
ably smaller owing to trade diversion, while the other members are largely unaffected. That is, AFTA makes it cheaper for other ASEAN economies to import agricultural products from Indonesia because high tariffs are main-tained against more efficient non-ASEAN producers.
The additional benefit from imple-menting APEC in addition to the UR is much greater than that from imple-menting AFTA. For Indonesia, the ad-ditional gain, with or without the inclusion of agriculture, would be about $0.64 billion, equivalent to about 44% of the gain from the UR alone. The aggregate additional welfare gain for the five original ASEAN member economies would be about $2 billion. For the non-ASEAN APEC economies, the total welfare gain from implement-ing the UR would be around $107 bil-lion, but if APEC is implemented as well the gain would increase to $114
billion ($119 billion if agricultural lib-eralisation is included). The impact of this liberalisation scenario for non-APEC economies is also positive, but much smaller.
Larger tariff reductions in agricul-tural products through APEC, beyond those committed through the WTO, would benefit net importers of tural products. The inclusion of agricul-ture in tariff reductions through APEC would increase welfare in Japan, Tai-wan and Korea, while the total benefit for the APEC economies overall would be relatively small. The gain from agri-cultural liberalisation comes mainly from the UR, especially in the form of reductions in domestic distortion.
Figure 1 shows the impact of vari-ous trade liberalisation scenarios on Indonesia’s welfare (equivalent varia-tion) in terms of its 1995 GDP. Trade liberalisation is expected to increase Indonesia’s welfare by about 0.5–1.1%
0.0 0.4 0.8 1.2
UR (base scenario)
UR + Indonesia unilateral liberalisation
(scenario 1)
UR + AFTA excluding agriculture (scenario 2a)
UR + AFTA including agriculture (scenario 2b)
UR + APEC excluding agriculture (scenario 3a)
UR + APEC including agriculture (scenario 3b)
With MFA elimination Without MFA elimination
% of 1995 GDP
FIGURE 1 Welfare Impact of Trade Liberalisation in Indonesia
-2.4
UR scenario UR + APEC including agriculture (scenario 3b)
of GDP, depending on the scenario, compared with the case of no liberali-sation. The elimination of the MFA un-der the various scenarios is estimated to increase welfare by about 0.2–0.3% of GDP. Implementation of Indonesia’s UR commitment alone, including the elimination of MFA quotas, would in-crease welfare by something less than 0.8% of GDP. By contrast, the gain from UR implementation plus unilateral tar-iff reductions and elimination of MFA quotas would be 1.1% of GDP.
Figure 1 also shows clearly that par-ticipation in AFTA yields Indonesia al-most negligible benefits, regardless of whether the agricultural sector is in-cluded in the scheme, and that unilateral
liberalisation would yield a far superior outcome. However, the additional wel-fare gain from unilateral liberalisation andfrom APEC participation is signifi-cant—again regardless of whether there is agricultural liberalisation.
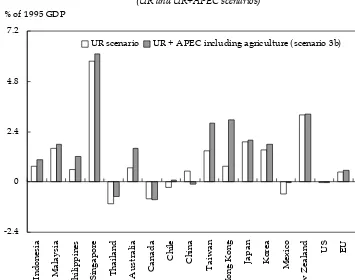
Figure 2 compares the welfare effects of trade liberalisation in terms of 1995 GDP among various economies. The re-sults show that the implementation of the UR would lead to positive welfare gains for most economies, even China and Taiwan, which did not participate in the UR. The welfare gains from par-ticipating in the UR come mainly from the increase in efficiency that results from greater market access and reduced distortions in the economy, particularly
FIGURE 2 Impact of Trade Liberalisation on Welfare: International Comparison (UR and UR+APEC scenarios)
through reduction of tariffs in all sectors, and of other domestic distortions in the agricultural sector, as required by the UR scheme.
One clear pattern to emerge from fig-ure 2 is the significant contribution of APEC to welfare, in addition to that from the UR. Small open economies like Singapore, Hong Kong, Taiwan and New Zealand tend to get the highest benefit from UR plus APEC trade liber-alisation, measured as a percentage of their GDP. Welfare is expected to in-crease by 6% of GDP in Singapore, and by around 3% in Hong Kong, Taiwan and New Zealand. The gain for Singa-pore is greater than for other countries because its trade is much larger relative to GDP. For example, the value of Singapore’s exports is about the same as its GDP. The gain for China is small be-cause in the period covered by this study China was not yet included in the WTO. While Taiwan is in the same position as China with respect to WTO accession, the gain for Taiwan is quite large be-cause it has been more open and has liberalised its economy as though it were in the WTO.
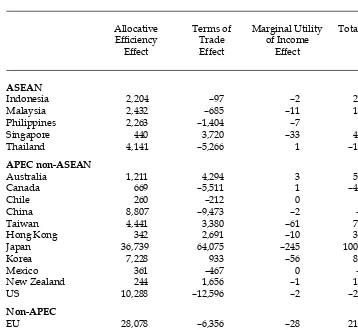
Figure 2 also shows that the welfare gains from the UR and APEC for some countries, such as Thailand, Canada and Mexico, are negative.17
Decompo-sition analysis of the changes in wel-fare can be conducted to explain these results. In a CGE model there are sev-eral potential sources of welfare change from trade liberalisation. Following Huff and Hertel (1996), we can disag-gregate welfare changes into three com-ponents: allocative efficiency effects, terms of trade effects, and marginal utility of income effects. Allocative ef-ficiency effects are generally positive, so that trade liberalisation improves efficiency of resource allocation within
the domestic economy. On the other hand, the terms of trade—the relative price of exports over imports—may improve or deteriorate, depending on a country’s own and other countries’ liberalisation. If the change in the terms of trade is negative and relatively large, then there is a possibility that the wel-fare loss from the deteriorating terms of trade might outweigh the benefit from increasing the efficiency of do-mestic resource allocation. Finally, the assumption in the model of non-homothetic household preferences results in changes in consumption pat-terns when income changes. When policy shocks lead to increases (de-creases) in household income, the pro-portion of income spent on inferior (superior) goods decreases (increases), implying more (less) income available for all other goods, and creating addi-tional positive (negative) effects on welfare. In the case of homothetic pref-erences, there is no additional welfare effect from the changes in marginal util-ity of income, because consumption patterns do not change.18
Table 4 presents a decomposition of welfare effects based on the results of trade liberalisation scenario 3b (UR plus APEC, including agriculture). For most countries, the results show that changes in welfare are dominated largely by allocative efficiency and terms of trade effects; the contribution from the change in marginal utility is negligible. For In-donesia, however, the decomposition of welfare effects shows that the welfare gain comes mainly from better resource allocation, while the contribution of the terms of trade and the marginal utility of income are small.
The decomposition of welfare effects also provides some explanation for the small welfare impact of trade
tion in some cases—for example, Thai-land, Canada, the US and China. The simulation results predict that trade lib-eralisation would lead to worsening terms of trade in those economies. In these cases the negative effect due to worsening terms of trade outweighs the positive effect of more efficient resource allocation.19
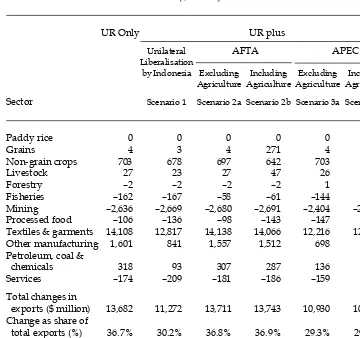
The Changing Patterns of Production and Exports
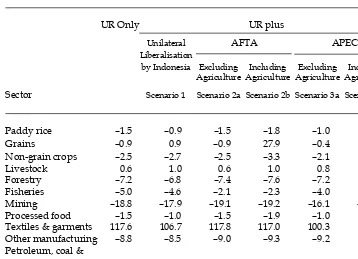
Trade liberalisation leads to better re-source reallocation, which is reflected in changes in the sectoral pattern of pro-duction and exports. Table 5 depicts the impact of trade liberalisation on output
composition in Indonesia, expressed as percentage differences from no-liberal-isation outcomes. Table 6 presents data about the impact of trade liberalisation on the value of exports. In general, the results show that in all liberalisation sce-narios, resources move to the textiles and garments sector, such that the out-put of its industries is projected to in-crease by 100% or more.20 Exports of
textiles and garments are expected to rise by $12–14 billion, which is roughly equivalent to the entire increase in Indonesia’s total exports.
In the agricultural sector, the output of paddy rice and non-grain crops is ex-pected to decline by 0.9% (paddy rice,
TABLE 4 Decomposition of the Welfare Impact of Trade Liberalisation (Scenario 3b) ($ million)
Allocative Terms of Marginal Utility Total Effect Efficiency Trade of Income
Effect Effect Effect
ASEAN
Indonesia 2,204 –97 –2 2,105
Malaysia 2,432 –685 –11 1,737 Philippines 2,263 –1,404 –7 852 Singapore 440 3,720 –33 4,127 Thailand 4,141 –5,266 1 –1,124
APEC non-ASEAN
Australia 1,211 4,294 3 5,508
Canada 669 –5,511 1 –4,841
Chile 260 –212 0 48
China 8,807 –9,473 –2 –667
Taiwan 4,441 3,380 –61 7,760
Hong Kong 342 2,691 –10 3,024 Japan 36,739 64,075 –245 100,569
Korea 7,228 933 –56 8,105
Mexico 361 –467 0 –106
New Zealand 244 1,656 –1 1,899
US 10,288 –12,596 –2 –2,310
Non-APEC
EU 28,078 –6,356 –28 21,695
Rest of Latin America 5,861 –5,154 1 707 Rest of the world 22,473 –36,024 –3 –13,555
scenario 1) to 3.3% (non-grain crops, sce-nario 2b). On the other hand, with the inclusion of agriculture in AFTA, Indo-nesia becomes a major grain producer in ASEAN, and its grain sector output is projected to increase by about 28%. Un-der this liberalisation scheme (scenario 2b), Indonesia’s annual grain exports are expected to rise by $271 million. Exports of agricultural commodities to ASEAN from traditional agricultural exporters such as Australia and the US would de-cline when import tariffs for agricultural exports from other ASEAN economies are reduced under AFTA. A similar, though less marked, trend is expected in the livestock sector, output of which is predicted to increase by 0.6 to 1%. Ex-ports are expected to increase by $47 mil-lion in liberalisation scenario 2b and by $23–27 million in other scenarios.
The results for all scenarios in tables 5 and 6 show that the output of the min-ing sector in Indonesia is estimated to decline by 16% or more with trade lib-eralisation, while its exports are ex-pected to decline by $2.4–2.7 billion. Similar trends were observed in the study for many other Asian countries. In almost all Asia Pacific economies, both output and exports of the mining sector tend to decline with trade liberal-isation, while imports tend to increase. In contrast, output and exports of min-ing from the US, Canada, Latin America and the Rest of the World are projected by the model to increase.
The study assumes that factor inputs are identical across sectors, and finds that, in all scenarios, labour and capital in Indonesia tend to move, in particu-lar, to the textile and garment industries.
TABLE 5 Indonesia: Impact of Trade Liberalisation on Outputa (% change)
UR Only UR plus
Unilateral AFTA APEC
Liberalisation
by Indonesia Excluding Including Excluding Including
Agriculture Agriculture Agriculture Agriculture
Sector Scenario 1 Scenario 2a Scenario 2b Scenario 3a Scenario 3b
Paddy rice –1.5 –0.9 –1.5 –1.8 –1.0 –1.3 Grains –0.9 0.9 –0.9 27.9 –0.4 1.3 Non-grain crops –2.5 –2.7 –2.5 –3.3 –2.1 –2.1 Livestock 0.6 1.0 0.6 1.0 0.8 0.9 Forestry –7.2 –6.8 –7.4 –7.6 –7.2 –7.0 Fisheries –5.0 –4.6 –2.1 –2.3 –4.0 –3.9 Mining –18.8 –17.9 –19.1 –19.2 –16.1 –16.0 Processed food –1.5 –1.0 –1.5 –1.9 –1.0 –1.3 Textiles & garments 117.6 106.7 117.8 117.0 100.3 99.7 Other manufacturing –8.8 –8.5 –9.0 –9.3 –9.2 –9.0 Petroleum, coal &
chemicals –2.1 –1.0 –2.2 –2.4 –0.8 –0.8 Services 0.1 0.2 0.1 0.0 0.2 0.2
aThese results reflect the impact with MFA elimination.
In the agricultural sector, the use of land tends to shift from paddy rice to grain crops and livestock. The shift of re-sources out of the mining, forestry, and fisheries sectors, for example, causes the decline in production in those sectors (table 5). The model assumes that labour and capital, as primary inputs, are im-mobile between countries/regions. Thus, in moving to the new equilibrium in a certain scenario, wages and the rental price of capital inputs are pre-dicted to increase by about 7.5–8.1% and 6.3–6.5%, respectively, in real terms.
Trade liberalisation has the potential to improve the efficiency of trade among regions, so it is not surprising that Indonesia’s exports increase in all liber-alisation scenarios considered here, by 29–37%. The trade surplus is expected to increase by $428–518 million, depend-ing on the scenario. In other words, both exports and imports are expected to in-crease, but the predicted increase in ex-ports is greater. In the GTAP model, the change in each country’s trade balance is equal to the change in the balance be-tween saving and investment in that
TABLE 6 Indonesia: Impact of Trade Liberalisation on Exportsa ($ million)
UR Only UR plus
Unilateral AFTA APEC
Liberalisation
by Indonesia Excluding Including Excluding Including
Agriculture Agriculture Agriculture Agriculture
Sector Scenario 1 Scenario 2a Scenario 2b Scenario 3a Scenario 3b
Paddy rice 0 0 0 0 0 0
Grains 4 3 4 271 4 4
Non-grain crops 703 678 697 642 703 738
Livestock 27 23 27 47 26 26
Forestry –2 –2 –2 –2 1 2
Fisheries –162 –167 –58 –61 –144 –137 Mining –2,636 –2,669 –2,680 –2,691 –2,404 –2,393 Processed food –106 –136 –98 –143 –147 –178 Textiles & garments 14,108 12,817 14,138 14,066 12,216 12,192 Other manufacturing 1,601 841 1,557 1,512 698 725 Petroleum, coal &
chemicals 318 93 307 287 136 140 Services –174 –209 –181 –186 –159 –157
Total changes in
exports ($ million) 13,682 11,272 13,711 13,743 10,930 10,963 Change as share of
total exports (%) 36.7% 30.2% 36.8% 36.9% 29.3% 29.4% Change in trade
balance ($ million) 434.5 427.7 447.9 517.8 433.2 453.5
aThese results reflect the impact with MFA elimination.
country. A higher trade balance means that the change in saving is larger than the change in investment.21
It is interesting to note that the in-crease in Indonesia’s exports under UR plus AFTA liberalisation is expected to be larger than that under UR plus APEC liberalisation. This is reflected in the larger exports of Indonesia’s manufac-tured products (textiles and garments, petroleum and chemicals based manu-factures, and other manufactures) when an ASEAN trading bloc is created. This confirms the expectation that the trade diversion effect of AFTA is likely to be large.
While an increase in textile and gar-ment exports is expected, it may have been overestimated, because potential competition from China has not been taken into account. In this simulation, China and Taiwan are not yet included in the WTO (although they are assumed to follow the APEC tariff reduction scheme), and therefore the potential benefit from MFA elimination is not ex-tended to these two economies.
The effect of the elimination of the MFA is also clear from the pattern of Indonesia’s manufacturing exports. Without MFA elimination, increases in exports are more evenly distributed among several manufacturing com-modities, and less concentrated on tex-tiles and garments. In other words, without the elimination of the MFA, exports of other manufacturing com-modities would be larger. Under liber-alisation scenario 2a, for example, textile and garment exports are ex-pected to increase by just $5.5 billion without the elimination of the MFA, compared with $14.1 billion with its elimination (table 6). Meanwhile, ex-ports of other manufacturing commodi-ties would increase by $3.0 billion, compared with just $1.6 billion if the
MFA is eliminated. The increase in ex-ports of petroleum, coal and chemical manufacturing products would also be higher, at about $676 million, if the MFA were not eliminated.
CONCLUSIONS
The gains from liberalisation estimated in this study are consistent with results from various studies of trade liberalisa-tion in the Asia Pacific region: larger tar-iff cuts and wider coverage of trade liberalisation generally lead to increased welfare gains. The benefits of trade lib-eralisation are reflected in the rises in welfare, and in wages and other factor prices, that result from improved pat-terns of production, exports and im-ports. However, the welfare gain from agricultural liberalisation comes mainly from the implementation of the UR com-mitments, which include the removal of domestic distortions in agriculture.
This study demonstrates that imple-mentation of the two major liberalisa-tion commitments in the Asia Pacific region, namely the UR and APEC, would greatly benefit Indonesia. The gains from the UR come through greater market access flowing from general tariff reductions, and through reduced domestic distortions in agri-culture. The elimination of the MFA is expected to provide a large additional welfare benefit. The contribution of APEC comes mainly from tariff reduc-tions in the manufacturing sector as a whole. The study also shows that uni-lateral liberalisation by Indonesia, in addition to other countries implement-ing their UR commitments, would lead to a larger welfare gain for Indonesia than UR implementation alone. The ad-ditional benefit from pursuing unilat-eral libunilat-eralisation to the extent assumed here is comparable with the full imple-mentation of the UR plus APEC.
The creation of AFTA, on the other hand, is estimated to contribute little ad-ditional welfare benefit either to Indo-nesia or to other ASEAN member economies. This is because ASEAN as a free trade area and market is small, and because most trade by ASEAN members is with non-ASEAN countries. Thus, while tariff reductions under the pref-erential CEPT scheme are more exten-sive than those under the UR and APEC, the expected gains are small because the tariff reduction is applied only to ASEAN members. The conclusion is that ASEAN would gain more by pursuing more open and non-discriminatory trade liberalisation unilaterally, or through APEC or the new round of the WTO. In practice, the benefit of the AFTA process is precisely that it has accelerated unilateral liberalisation in many of the ASEAN member countries. Having to submit schedules of tariff re-duction to be achieved by certain dead-lines has strongly influenced members’ own unilateral processes of tariff reduc-tion. Therefore, the gains from AFTA
cannot be measured simply by estimat-ing the welfare gains from the AFTA sce-nario alone.
In the Indonesian case, the greatest expansion is expected to take place in the textiles and garments sector, and at the expense of the mining sector. Even with-out the elimination of the MFA the gain is significant. The results show that trade liberalisation tends to move resources from primary sectors such as mining and agriculture to other sectors, especially manufacturing. Of course this has to do also with the assumption in the model that factor inputs are identical in nature, and perfectly mobile across sectors. Thus, with trade liberalisation, Indonesia’s comparative advantage in the textile and garment industries, and to a lesser extent in general manufacturing, should be-come clearer. The predicted impact of ag-ricultural liberalisation on Indonesia’s trade pattern is generally modest, except in the case of agricultural liberalisation in AFTA, which makes Indonesia poten-tially the major producer of agricultural commodities in ASEAN.
NOTES
1 Other studies of trade liberalisation in the Asia Pacific that use a similar framework include APEC (1997, 1999); Anderson, Dimaranan et al. (1997); and Young and Huff (1997). For previous studies on In-donesia see Erwidodo and Feridhanu-setyawan (1997); FeridhanuFeridhanu-setyawan (1997); and Feridhanusetyawan, Panges-tu and Erwidodo (2002).
2 For comprehensive discussion of Indonesia’s economic deregulation and liberalisation see Pangestu (1996) and Feridhanusetyawan (2001).
3 Several non-transparent preferential poli-cies emerged during this period. Among the most controversial were a clove mo-nopoly and restrictions on inter-island trade in oranges from West Kalimantan in 1991 (Nasution 1991); the increased tariff surcharge on propylene and
ethyl-ene imports in 1993 (McLeod 1993); and exemption from the 35% luxury tax for the national car, the Timor (Bird 1996). All of these cases involved the business in-terests of the president’s family or cronies. 4 See Stephenson and Pangestu (1996) for
a more detailed discussion.
5 Since the crisis and Indonesia’s accep-tance of the IMF program of assisaccep-tance, most import monopolies in agricultural products under Bulog have been re-moved in compliance with the IMF Let-ters of Intent. However, Bulog remains a state trading company from the perspec-tive of the WTO, and is thus exempt from WTO commitments.
6 The government learned a lesson on the role of external WTO discipline from the case of the PT Timor national car. In 1996, this company, owned by former
President Soeharto’s youngest son, had been given the special privilege of im-porting its components duty free, as its product had been designated a ‘national car’ and was to achieve a certain per-centage of local content within a speci-fied period. The major WTO members, led by Japan, took the case to the WTO dispute settlement panel; Indonesia lost and was required to change the discrimi-natory treatment that had favoured PT Timor at the expense of other car manu-facturers.
7 Riding on the success of the ITA, there were further attempts to promote sectoral liberalisation under the WTO through the Early Voluntary Sectoral Liberalisation (EVSL) program. These were unsuccess-ful because EVSL was not suited to the APEC process. Negotiation of which sec-tors to include and what was to be in-cluded in each sector could not take place under the APEC umbrella, so this initia-tive has not taken off.
8 The fast track products are vegetable oils, chemicals, fertilisers, rubber prod-ucts, pulp and paper, wooden and rat-tan furniture, gems and jewellery products, cement, pharmaceuticals, plastics, leather products, textiles, ce-ramics and glass products, copper cath-odes, and electronics.
9 Joint Press Statement of the 13th Meet-ing of the AFTA Council, 29 September 1999, Singapore, available at http:// www.asean.or.id/summit/.
10 This resistance to making APEC more formal is reflected in the original under-standing that APEC would not be insti-tutionalised as a negotiating body like the WTO.
11 Full documentation of the model and data can be found in Hertel (1997). 12 The Bogor Declaration specifies that ‘free
trade and investment’ in the region should be achieved by 2010 for developed econo-mies and 2020 for developing econoecono-mies, without defining specifically what this term implies. Thus far it seems that the
accepted norm is for each member coun-try to interpret what the Bogor targets mean for its economy.
13 Equivalent variation is the change in in-come that would be equivalent to the price changes resulting from liberalisa-tion in terms of their welfare impact. 14 This gain is larger than that obtained by
Feridhanusetyawan (1997) and Erwi-dodo and Feridhanusetyawan (1997), who used the earlier version of the GTAP database and assumed a smaller degree of tariff reduction.
15 The five scenarios were re-simulated as-suming the MFA remains in place. Full details are not reported here, except for Indonesia (table 3 and figure 1). 16 If APEC were to become a trading bloc,
with import protection removed among APEC members but maintained between the rest of the world and APEC members, this would also lead to inferior welfare outcomes for APEC member economies (Young and Huff 1997).
17 Implementation of APEC roughly offsets the losses to Mexico from the UR. 18 A detailed technical derivation of the
welfare decomposition can be found in Huff and Hertel (1996).
19 These negative terms of trade effects in North America and Thailand are consis-tent with the results of a previous study by Young and Huff (1997), which also uses the GTAP to model APEC trade lib-eralisation.
20 Even without the elimination of the MFA, the output of the textiles and garments sector would increase by at least 30%. 21 This is based on standard economic
clo-sure, in which the trade balance equals saving minus investment. This study uses one of the standard GTAP closures, in which the changes in rates of return on investment are equalised across coun-tries. In other words, the model would distribute a change in global saving across regions or countries in such a way that all expected regional rates of return change by the same percentage.