COAL BED METHANE POTENCY
OF TANJUNG FORMATION IN TANAH BUMBU
SOUTH KALIMANTAN
Oleh :David P. Simatupang, Deddy Amarullah
Pusat Sumber Daya Geologi Jl. Soekarno Hatta No. 444 Bandung
Endapan batubara tersebar luas di Indonesia, terutama di Pulau Sumatera dan Kalimantan. Endapan ini menjadi indikasi besarnya potensi coal-bed methane (CBM). Sebagai salah satu sumber energy yang ramah lingkungan, CBM dapat menjadi salah satu sumber energi bagi Indonesia dimasa yang akan datang. Pusat Sumber Daya Geologi (PSDG) telah mulai melakukan eksplorasi sumber energi ini sejak tahun 2005, dimana pada tahun 2008 dilakukan di Formasi Tanjung di Daerah Tanah Bumbu, Kalimantan Selatan
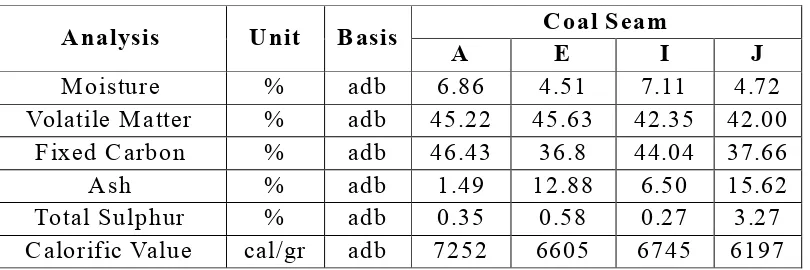
Pemboran sumur CSAT-1 dilakukan untuk memberikan data sumber daya CBM dan data potensi tambang dalam untuk Formasi Tanjung yang berumur Eosen di Cekungan Asem-asem. Sumur tersebut menembus 10 lapisan batubara, dengan tiga diantaranya sebagai lapisan utama, yaitu lapisan E pada kedalaman 212,34 213,30 m, lapisan I pada kedalaman 261,93264,20 m, dan lapisan J pada 270,20 -275,35 m. Nilai kalori dari ketiga lapisan utama ini dikategorikan sebagai batubara rank tinggi, dengan variasi dari 6197 - 6745 cal/gram (adb), dengan total moisture antara 4,51 - 7,11 %, adb
Total sumber daya batubara yang digunakan untuk penghitungan sumber daya CBM adalah 112.733.226 ton (yang berada di kedalaman antara 300 hingga 1000 meter). Berdasarkan desorption test dan pengukuran gas chromatography terhadap sampel batubara pada berbagai kedalaman di ketiga seam utama, batubara tersebut memberikan sumber daya metana sekitar 420 MSCF dengan kandungan metana yang bervariasi antara 1,2 6,6 cu-ft/ton batubara.
Formasi Tanjung,Tanah Bumbu, CBM, kandungan metana.
Kata Kunci: SARI
Coal deposits distributes widely in Indonesia, mainly in Sumatera and Kalimantan. These deposits become an indication for a huge quantity of coal-bed methane (CBM) potency. As an environmentally friendly source of energy, CBM could be one of Indonesia's future energy sources. Centre for Geological Resources (CGR) started the exploration for this energy since 2005, while the study was conducted in 2008 at Tanjung Formation in Tanah BumbuArea, South Kalimantan.
CSAT-1 well was drilled to provide CBM resources and deep coal mine potency data for Tanjung Formation (Eocene) in Asem-asem Basin. This well went through 10 coal seams with three main seam, which is E seam at 212.34-213.30 m depth, I seam at 261.93-264.20 m, and J seam at 270.20-275.35 m depth. Calorific value from this three main seam categorized as high rank coal, vary from 6197-6745 cal/gram (adb), with total moisture between 4.51-7.11 %, adb.
Total coal resources used for CBM resources quantification is 112,733,226 tons (between 300 to 1000 meters depth). Based on desorption test and gas chromatograph measurement from samples at various depth from three main seams, those coal gives methane resources estimation about 430 MSCF, with methane content vary between 1.2 - 6.6 cu-ft/ton of coal.
Tanjung Formation, Tanah Bumbu, CBM, methane content.
Keywords: ABSTRACT
1 2
Coal deposits are distributed widely in Indonesia, mainly in Sumatera and Kalimantan islands, which is utilized mostly for power plant. The other energy resource from coal deposits that environmentally clean is the saturated gas within the coal which is known as coal-bed
methane (CBM). Some advantages of CBM are can make underground mining saver, provide cleaner & environmentally friendly source of energy and can be easily transported with pipeline network for national and regional supply.
As a government institution with fossil
Resources (CGR) has been carried out CBM exploration since 2005. Some exploration drilling has conducted in several basins in order to provide CBM and deep coal mine resources potency data. The latest exploration drilling commenced in 2008 at Tanah Bumbu area, in purpose to measure the methane content of Tanjung Formation.
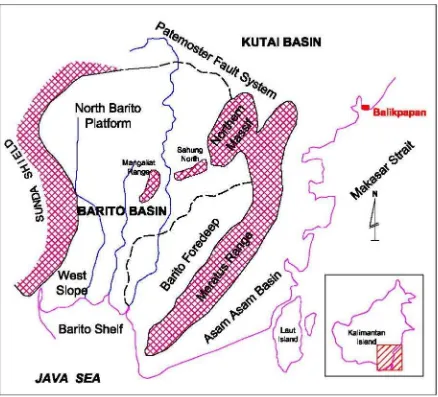
Coal deposits of Tanjung Formation in Tanah Bumbu area is believed as one of potential coal bearing that have significant methane content. The Eocene Tanjung Formation is included into Asem-Asem Basin (E. Rustandi et al., 1995; N. Sikumbang et al., 1994). Administratively, the study area is within to Tanah Bumbu Regency, South Kalimantan Province.
CBM exploration in Tanah Bumbu Area drilled CSAT-1 well, this location selected based on geological mapping, to get samples from
METHODOLOGY
several coal seams in Tanjung Formation. After core descript, the coal was packed into canisters and sealed due to prevent leakage. After leak test, the canister was ready for desorption test.
Desorption test measurement was made in periodical time intervals by vent out the gas until there are none gas come out from canister. After desorption test finished, coal from canister was crushed to get the residual gas that still trap inside. Gas samples from each canister tested with Gas Chromatograph (GC) to get the compositional data. Finally, the crushed coal was sent to laboratory for coal quality measurements.
Coal resources for gas content measurement calculated at depth interval 300-1000 meters and only for three main seams with an assumption that the methane can be produced efficiently in that depth interval and in thick coal seams.
GEOLOGYAND COAL DEPOSIT RESULT
Tanah Bumbu area is part of Asem-Asem Basin, located in the south eastern Kalimantan. Asem-Asem Basin is part of Barito Basin that separated by Meratus Montains (N. Sikumbang, 1986; A.H. Satyana and P.D. Silitonga, 1994). According to E. Rustandi et al., (1995), Tertiary stratigraphy of Asem-Asem Basin begins by Eocene age Tanjung Formation as coal measures, conformably overlain by Oligo-Miocene Berai Formation, which predominantly consist of limestone. The Middle Miocene Warukin Formation that also coal measures, lay conformably above Berai Formation. The upper formation is Mio-Pliocene Dahor Formation, which predominantly consist of coarse sandstone, laid unconformably above Warukin Formation. The structural configuration in Tanah Bumbu area classified as simple structures with dip of bedding generally ranging between 10-20o
southeastwardly. Target in this study is Tanjung Formation coal.
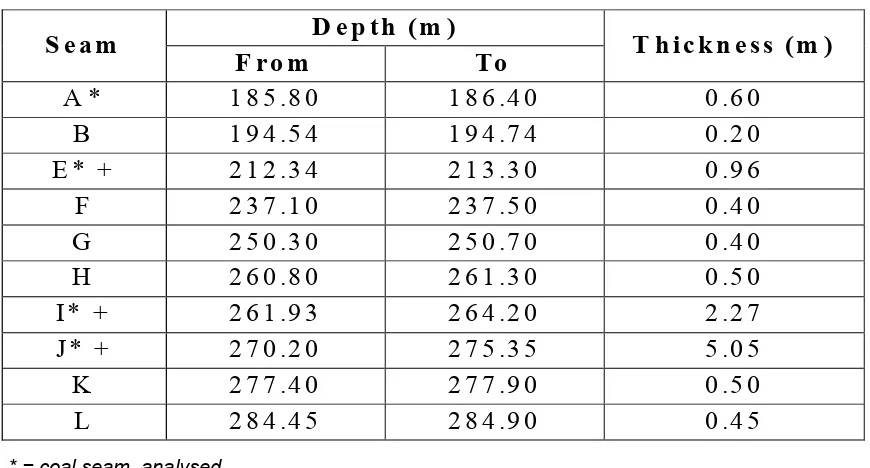
Ten coal seams were found through exploration drilling activity in Tanjung Formation at the study area. The upper seam depth was located at 185.80 - 186.40 m and the lowest seam was at 284.45 - 284.90 m. The thickest coal seam at 270.20 - 275.35 m and the thinnest coal seam found at 194.54 - 194.74 m depth. Complete coal seams data from drilling result are listed inTable 1 Coal resources of Tanjung Formation were calculated separately in two Blocks. Block I is for depth between 300-500 m and Blok II for 500-1000 m. This resource calculation based on coal spread as far as 3000 meter along strike. Total coal resources are 112,733,226 tons (Table 2). Based on the thickness, gas content was measured from 3 (E, I, & J) out of ten coal seams. This is due to an assumption that only thick seams have possibility to produce significant gas..
Table 1. Coal seams of CSAT-1
* = coal seam analysed += gas content calculated
Seam
Depth (m eter)
From
To
(m eter)
Thick
300-500 m
Coal Resources (Ton)
500-1000 m
E
212.34 213.3
0.96
3,734,434
9,336,085
I
261.93 264.2
2.27
8,830,380
22,075,951
J
270.2 275.35
5.05
19,644,679
49,111,697
Total
32,209,493
80,523,733
S eam
F rom
D ep th (m )
To
T h ick n ess (m )
A *
185.80
186.40
0.60
B
194.54
194.74
0.20
E * +
212.34
213.30
0.96
F
237.10
237.50
0.40
G
250.30
250.70
0.40
H
260.80
261.30
0.50
I* +
261.93
264.20
2.27
J* +
270.20
275.35
5.05
K
277.40
277.90
0.50
L
284.45
284.90
0.45
Analysis
Unit
Basis
A
Coal Seam
E
I
J
Moisture
%
adb
6.86
4.51
7.11
4.72
Volatile Matter
%
adb
45.22
45.63
42.35 42.00
Fixed Carbon
%
adb
46.43
36.8
44.04 37.66
Ash
%
adb
1.49
12.88
6.50
15.62
Total Sulphur
%
adb
0.35
0.58
0.27
3.27
Calorific Value
cal/gr
adb
7252
6605
6745
6197
Table 3. Coal Quality
Table 4. Canisters Properties
C oal
S eam
C an ister
N o
D ep th
C ore
L en gth
W eigh t
C oal
F rom
To
m eter
m eter
m eter
gram
A
1
185.80 186.40
0.60
714
B
2
194.54 194.74
0.20
345
E
3
4
212.34 212.84
212.84 213.30
0.94
1098
895
F
5
237.10 237.50
0.40
970
G
9
250.30 250.70
0.40
910
H
6
260.80 261.30
0.50
1041
I
7
261.93 262.40
2.27
1096
8
262.40 262.70
342
10
262.70 263.20
1089
11
263.20 263.70
832
12
263.70 264.20
968
J
13
270.20 270.60
5.15
904
14
270.60 271.00
921
15
271.00 271.35
814
16
271.40 271.70
792
17
271.70 272.35
1286
18
272.40 273.00
1185
19
273.00 273.50
1011
20
273.50 274.10
1130
21
274.10 274.70
1097
22
274.70 275.35
1608
K
23
24
277.40 277.70
277.70 277.90
0.50
572
458
C oal
Seam
C anister
N o
Q 1
G as Volum e (cc)
Q 2
Q 3
G as (cc)
Total
E
3
4
37.37
2.89
429.00
159.00
641.06
522.54
1107.43
684.43
I
7
25.45 1,082.00
895.72
2003.17
8
42.28
320.00
163.48
525.76
10
43.93 1,124.00
890.00
2057.93
11
97.46
970.00
620.33
1687.79
12
57.40 1,170.00
791.11
2018.51
J
13
16.59
182.20
344.84
543.63
14
81.31
706.50
443.37
1231.18
15
24.12
610.00
391.86
1025.97
16
23.20
732.25
381.27
1136.72
17
41.63
638.75 1,152.78
1833.16
18
21.52
975.00
570.45
1566.97
19
41.41
764.00
486.69
1292.10
20
6.22 1,034.50
543.98
1584.70
21
41.41
541.00
876.96
1459.37
22
153.97 1,350.75
774.08
2278.80
Table 5. Result of Q1, Q2, Q3 and Total Gas in Canisters
Coal
Seam CanisterNo
Total
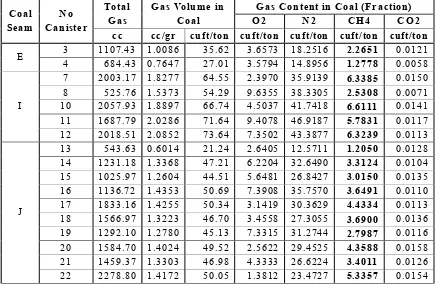
Gas Gas Volume inCoal O2Gas Content in Coal (Fraction)N2 CH4 CO2 cc cc/gr cuft/ton cuft/ton cuft/ton cuft/ton cuft/ton E 34 1107.43 1.0086684.43 0.7647 35.6227.01 3.6573 18.25163.5794 14.8956 2.26511.2778 0.01210.0058
I
7 2003.17 1.8277 64.55 2.3970 35.9139 6.3385 0.0150
8 525.76 1.5373 54.29 9.6355 38.3305 2.5308 0.0071
10 2057.93 1.8897 66.74 4.5037 41.7418 6.6111 0.0141
11 1687.79 2.0286 71.64 9.4078 46.9187 5.7831 0.0117
12 2018.51 2.0852 73.64 7.3502 43.3877 6.3239 0.0113
J
13 543.63 0.6014 21.24 2.6405 12.5711 1.2050 0.0128
14 1231.18 1.3368 47.21 6.2204 32.6490 3.3124 0.0104
15 1025.97 1.2604 44.51 5.6481 26.8427 3.0150 0.0135
16 1136.72 1.4353 50.69 7.3908 35.7570 3.6491 0.0110
17 1833.16 1.4255 50.34 3.1419 30.3629 4.4334 0.0113
18 1566.97 1.3223 46.70 3.4558 27.3055 3.6900 0.0136
19 1292.10 1.2780 45.13 7.3315 31.2744 2.7987 0.0116
20 1584.70 1.4024 49.52 2.5622 29.4525 4.3588 0.0158
21 1459.37 1.3303 46.98 4.3333 26.6224 3.4011 0.0126
22 2278.80 1.4172 50.05 1.3812 23.4727 5.3357 0.0154
Table 6. Gas Content Measurement and Fraction of Gas
S e a m
C o n te n t (c u ft/to n )
Av e r a g e M e t h a n e
E
1 .8 2 1 7 3 3
I
4 .9 5 9 8 8 9
J
3 .6 8 6 6 6 3
Table 7. Average Methane Content for each Seam
Seam
Coal Resources
(Ton)
Content (cuft/ton)
Average M ethane
Total M ethane
(cuft)
E
3,734,434
1.821733
6,803,141.654
I
8,830,380
4.959889
43,797,704.63
J
19,644,679
3.686663
72,423,311.22
Sub Total
123,024,157.5
Table 8. Total Methane between 300-500 meters depth
Table 9. Total Methane between 500-1000 meters depth
Seam
Coal Resources
(Ton)
Content (cuft/ton)
Average M ethane
Total M ethane
(cuft)
E
9,336,085
1.821733
17,007,854.14
I
22,075,951
4.959889
109,494,266.53
Quality of coal from laboratory result show that range of calorific value (adb) is between 6197 - 7252 cal/gr, total sulphur (adb) 0.27 - 3.27 %, and ash content (adb) 1.49 - 15.62 %. Complete coal quality data are listed in Table 3. This result classified in SNI (Indonesian National Standard) as high rank coal.
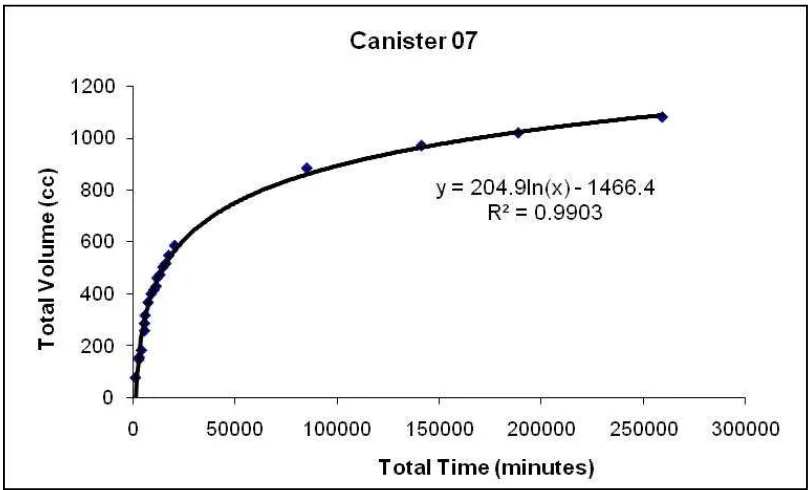
Since the gas was trapped inside coal cleats and matrix, special methods to calculate gas content have to be applied. This study measured the gas content directly by collect the fresh coal from core barrel and sealed it in canisters. The gas was vent out from the canister in periodical of time and the volume is measured and labelled as Q2. From this Q2 data series, the lost gas volume (Q1) was calculated by extrapolate the Q2 vs. time graphic to initial time (first gas came out from the coal). The gas that still saturated in coal push out by crushed the coal; volume of the gas from crusher chamber is measures to get the Q3. The total gas in a bulk of coal calculates by summation Q1, Q2 & Q3.Asample graphic of Q2 is presented in Figure 3.
Canisters that were used in this study made from PVC with HQ diameter and 60 cm length. Properties of canister after filled with coal are presented in Table 4. The coloured seam (E, I and J) is the seam which gas volume was included in resources potency calculations.
Q2 measurement graphic is vary for each seam, there were some canisters that continuing to produce gas (after 8 month) when others were stop earlier and crushed to get the Q3. Some Q3 calculation in Table 5 generated by used Q3 data's from other canisters in the same coal seam. This study is still in progress until there is no gas came out from the coal.
The produced gas samples were collected and analysed with GC in CGR mobile laboratory (Figure 4). Further, the gas content data then converted in to cubic-feet and presented in Table 6. Average methane content for each coal seams (Table 7) and coal resources (Table 2) was used to determine the coal bed methane content at Tanjung Formation in Tanah Bumbu area (Table 8 andTable 9).
Total methane content of Tanjung Formation in Tanah Bumbu Area between 300 to 1000 meters depth is 430,584,554.36 cu-ft (~430 MSCF).
430 MSCF methane result is seems small for production scale, but we should consider this result is only for small part of the Tanjung Formation's coal. The desorption test measurement only reach its maximum at 6.3
Gas Content Measurement
DISCUSSION
cuft/ton, with the highest average methane content 4.95 cuft/ton at I seam. This is caused by sample depth which only 212.34 - 275.35 m. At this depth, methane probably still going up through overburden and release to atmosphere, besides the meteoric water might still can reach the coal seams. We believe that methane content will increase if drilling reaches deeper coal seam. This result can take as a minimum methane content of the Tanjung Formation.
The deepest point of CSAT-1 drilling was 284.90 m, however in this study the methane content measurement calculated for coal is at 300-1000 m depth. This calculation based on assumption that 300 to 1000 meter is the sweet spot for methane accumulation. As mention above, shallow coal will give lower methane content, while for coal deeper than 1000 m, the cleat volume and permeability will significantly decrease by the overburden pressure. Ideally, we collect coal samples deeper than 300 m, but drilling equipment limitation push us to make this result as minimum methane content, not the average methane content for Tanjung Formation. Hopefully, in the future we can drill deeper and collect more representative samples for this formation.
With only one well, it is challenging to evaluate the data for basin or even formation scale that is why we restricted our study to some thick coal seams from Tanjung Formation at Tanah Bumbu area. For a detail prospection it is better to have some drilling wells to get more data and to be used as production/dewatering wells. But, for CGR that have task to provide primary data for the next exploration stage, this data can give minimum estimation for methane content in Tanjung Formation.
CGR as government institution provide resource potency data in Tanjung Formation for further follow-up. In Tanah Bumbu Area, South Kalimantan, CGR drilled CSAT-1 to find methane content in Eocene Tanjung Formation. Based on the three main coal seam from exploration well, the average methane content vary from 1.82 to 4.95 cu-ft per tons, whereas the total reach up to 430 MSCF of methane.
REFERENCES
Rustandi, E., Nila, E. S., Sanyoto, P. & Margono, U. 1995. Peta Geologi Lembar Kotabaru Kalimantan, P3G.
Satyana, A. H & Silitonga, P. D. 1994. Tectonic Reversal in East Barito Basin, South Kalimantan: Consideration of the Type of Inversion Structures and Petroleum System Significance. Proceedings of the Indonesian 22ndAnnual Convention.
Sikumbang N. 1986. Geology and Tectonics of Pre Tertiary Rocks in Meratus Mountains, South East Kalimantan, Indonesia. Ph.D Thesis University of London.
Sikumbang, N. & Heryanto, R. 1994. Peta Geologi Lembar Banjarmasin, Kalimantan, P3G.