Changes in Effective Tax Rates and
Guarantees in U.S. Transfer Programs,
1983–2002
James P. Ziliak
a b s t r a c t
In the 1990s, many states liberalized statutory rules regarding the tax treatment of earned and unearned income for welfare program eligibility and benefit levels. I use quality control data from the AFDC/TANF program over 1983–2002 to document changes in the corresponding effective tax rates and benefit guarantees. After welfare reform I find that effective tax rates fell by 50 percent on earned income and by at least 70 percent on unearned income. States that aggressively reformed their welfare programs, especially those that implemented a stringent sanctions policy on benefits, experienced more rapid reductions in effective tax rates and guarantees.
I. Introduction
A fundamental challenge facing policymakers in the design of trans-fer programs for the poor is the tradeoff between the generosity in both the level and coverage of benefits and the desire to minimize work disincentives among the so-called able-bodied poor. The debates surrounding this tradeoff in the modern U.S. transfer system came to a head during the 1990s welfare reform, when a com-mon theme emerged that welfare policy choices should be further decentralized to the state and local level and that these policies should be redesigned to ‘‘make work pay.’’ While some of the state reforms encouraging work were sticks such as
James P. Ziliak is the Carol Martin Gatton Endowed Chair in Microeconomics and Director of the University of Kentucky Center for Poverty Research. He thanks Terra McKinnish, Robert Moffitt, Seth Sanders, Jeff Smith, and two anonymous referees for helpful comments on earlier versions of the paper. The conclusions expressed herein are solely those of the author and should not be construed as representing the opinions or policy of any agency of the Federal government. The data used in this article can be obtained beginning January 2008 through December 2010 from James P. Ziliak at Department of Economics, Gatton College of Business & Economics, University of Kentucky, Lexington, KY 40506–0034. E-mail: jziliak@uky.edu.
[Submitted June 2005; accepted August 2006]
ISSN 022-166X E-ISSN 1548-8004Ó2007 by the Board of Regents of the University of Wisconsin System
mandatory work requirements and time limits on benefit receipt, other reforms in-volved carrots such as cuts in statutory tax rates on earned and unearned income, expansions in the amount of earnings disregarded for benefit determination, increases in liquid asset limits for program eligibility, and expansions in the refundable Earned Income Tax Credit for low-wage workers. A result of this new fiscal federalism has been a more diverse array of program rules across states, especially statutory tax rates and income disregards. While it is well established that statutory tax rates and benefit guarantees diverged from their effective counterparts under the old Aid to Families with Dependent Children (AFDC) program (Lurie 1974; Hutchens 1978; Fraker, Moffitt, and Wolf 1985; McKinnish, Sanders, and Smith 1999), it is not known whether this pattern changed in the years leading up to and following wel-fare reform. In this paper, I document changes in the effective tax rates and benefit guarantees in AFDC and its replacement Temporary Assistance for Needy Families (TANF) over the past two decades spanning 1983–2002.
In the typical transfer program, much of the policy control over work incentives stems from the generosity of the maximum benefit guarantee, the rate at which the benefit is reduced as earned and other unearned income increases, and the level and sources of income that can be excluded from benefit determination. In the AFDC program, the maximum benefit guarantee was set at the state level, and there was considerable state variation in the generosity reflecting both income and cost-of-living differences and also voter preferences for redistribution (Ribar and Wilhelm 1999). The official tax rate on earned income after deductions was cut from 100 per-cent to 67 perper-cent in the late 1960s, only to be raised back to 100 perper-cent as part of OBRA 1981. The official tax rate on unearned income was also 100 percent. To de-termine benefits, it is illustrative to consider the statutory earnings test. Benefits for recipients were calculated using earnings minus a $90 work expense disregard, fol-lowed by a disregard of $30 and one-third of remaining earnings. After four months of consecutive earnings, recipients were no longer eligible for the one-third disre-gard, so the disregard was simply $120. After eight additional months of consecutive earnings, recipients were no longer eligible for the $30 disregard, so the disregard was $90, after which earnings were taxed at 100 percent. The compelling evidence found in Lurie (1974); Hutchens (1978); Fraker et al. (1985); and McKinnish et al. (1999) showed that whether by design or by error the effective tax rate on earned and unearned income in AFDC was well below the statutory level and there was consid-erable cross-state heterogeneity. The key mechanism driving the wedge in the effec-tive and official rates was the sources and levels of income disregarded from benefit determination. The more income disregarded, the lower the effective tax on that in-come. This variation in income disregards could be the result of official state policy, by caseworker discretion and/or error, or by shifting composition of income among recipients (Moffitt 1979; McKinnish et al. 1999).
that pursued a more aggressive reform agenda in terms of sanctions, time limits, and other policies also more aggressively altered effective tax rates and guarantees. For example, only nine states retained the $90 and ‘‘30 and one-third’’ rule, with most states expanding the amount and length of time the disregard could be claimed and also cutting the statutory tax rate (Gallagher et al. 1998), and of those leaving statutory tax rates unchanged, only Virginia added a full-family sanction as part of its TANF plan, suggesting that aggressive reforms may have been bundled.
Given more decentralized rulemaking it is possible that effective tax rates remained unchanged after welfare reform if the new official rules were designed to line up with actual past practice. On the other hand, with the strong emphasis on encouraging work, it is also possible that effective rates fell along with the stat-utory rates, and the extent of the cuts could be positively related to a more compre-hensive agenda of reform. The latter could occur if states passed more income through without subjecting it to taxation, or because the composition of those remaining on welfare had income from sources less subject to taxation, or both.
The most recent evidence on effective tax rates and guarantees in the AFDC pro-gram comes from McKinnish et al. (1999). They provide an extensive discussion on the interpretation and utility of these estimated benefit and tax schedules. For exam-ple, with individual-level data on earned and unearned income, it is possible to pre-dict AFDC benefits out-of-sample or to construct net of transfer wage rates, each of which in turn can be used in a variety of research applications such as behavioral models of the effect of AFDC on labor supply or family structure (Fraker and Moffitt 1988; Gottschalk 1988; Hoynes 1996; Moffitt 1983; Rosenzweig and Wolpin 1994; Ziliak 2004). However, a limitation of McKinnish et al. (1999) is that their analysis ends with the 1991 fiscal year. Given both the state welfare waiver experiments in the early 1990s, followed by the 1996 federal legislation, updated estimates of effective tax rates and guarantees are of importance both for understanding whether there have been changes in these rates and benefits after welfare reform and for their potential use in behavioral models. The use of effective tax rates in behavioral models is lim-ited somewhat because they are more akin to average marginal tax rates. However, Fraker et al. (1985) argue that the extreme nonlinearities in the budget frontier likely means that AFDC recipients only perceive average rates when making labor supply choices, and recent ethnographic research by Romich (2006) lends support to this conjecture. Indeed, in light of the increasing complexity of the statutory rules across states after welfare reform, the complete budget set approach is likely to be much more cumbersome for both the recipient and the researcher to model, making esti-mated effective rates more valuable in practice.1
Using administrative data for 1983–2002 from the AFDC Quality Control System and the National TANF Data Reporting System, in this paper I document changes in the effective tax rates and benefit guarantees in AFDC/TANF through the first five years of welfare reform. I estimate guarantees and tax rates for all states, as well as for subsets of states based on the aggressiveness of welfare reform policies. I find
that effective tax rates on earnings in AFDC/TANF fell 50 percent after welfare re-form, and that the tax on unearned income fell at least 70 percent. Moreover, while the decade-long slide in both real statutory and effective benefit guarantees in AFDC/ TANF abated after welfare reform, the gap between the two expanded, which rein-forced the attractiveness of work.
II. Estimating Effective Tax Rates and
Benefit Guarantees
To estimate the effective tax rates and guarantees I follow the reduced-form methodology established by Hutchens (1978); Fraker, Moffitt, and Wolf (1985); and McKinnish, Sanders, and Smith (1999) for the AFDC program. The basic idea is to regress the AFDC benefit for recipienti¼1,.N, in statej¼
1,.J, in time periodt¼1,.Ton the recipient’s earned income, unearned income,
and variables indicating family size.2Specifically,
Bijt ¼a0
whereBis the monthly benefit amount, K2is an indicator variable equaling one if there are two or more children in the recipient unit,K3is a variable equaling the number of children greater than two and equaling zero if there are two or fewer children in the assistance unit,Eis earned income,Nis unearned income, andeis
a random error term. The state-specific and time-varying intercepts (a0
jt) reflect the
effective benefit guarantee for a two person AFDC unit (that is, for my purposes a single mother with one assistance child), the suma0
jt+a1jtreflects the effective
guar-antee for a three-person family, the suma0 jt+a
1
jt+a
2
jtis the effective guarantee for a unit
with one adult and three children, and the suma0 jt+a
1
jt+a
2
jt2 is the effective
guar-antee for a unit with one adult and four children, and so on. The coefficientstjte;t n jt
reflect effective tax rates on earned and unearned income.3 Because the AFDC/ TANF benefit has a statutory minimum of $10 the distribution of all possible recip-ients (that is, those eligible for benefits < $10) are not in the data and thus the sample is truncated. This implies that Ordinary Least Squares estimation of Equation 1 is not consistent, but a truncated maximum likelihood estimator along the lines proposed by Hausman and Wise (1977) is consistent and is the estimator utilized here and in the previous literature. However, as noted by Fraker et al. (1985) and McKinnish et al. (1999), the OLS and truncated maximum likelihood estimates are quite similar because of the high explanatory power in the OLS models (adjusted R2s are at least 0.95).
2. I also explored specifications including quadratic terms in earned and unearned income, and also spec-ifications with splines of earned and unearned income. While many of the higher-order terms were individ-ually statistically significant, the overall model fit was little changed, and the predicted benefits at the 25th,
50th, and 75thpercentiles did not differ by more than 1 percent and often were nearly identical. Thus, the
more parsimonious specification in Equation 1 seems to capture adequately the relationship between ben-efits and earned and unearned incomes.
McKinnish et al. (1999) provide a thorough discussion of the interpretation and subsequent utilization in policy discussions and behavioral models of the coefficients estimated in Equation 1. I briefly review the issues raised by McKinnish et al. (1999), and then elaborate upon them within the context of TANF. On the plus side, given data limitations in most social science surveys such as the Current Population Sur-vey, the Panel Study of Income Dynamics, and the Survey of Income Program Par-ticipation, among others, the effective tax rates and guarantees likely provide much more accurate estimates of benefits received by recipients than a naı¨ve approach of applying statutory rules to total income. Benefit levels in AFDC for a given family size were based on net income, that is, gross income less deductions, and because most surveys do not contain information on deductions but they do have information on income and number of children, the effective rates and guarantees likely better reflect benefits received. In addition to lacking detailed data necessary to calculate statutory deductions, Moffitt (1979) argued that caseworkers may use discretion in calculating deductions, either because of difficulties in implementing complex pro-grammatic rules or by personal choice due to disagreement over policy rules, but the effective rates will net out these influences that cannot be measured with statutory rules or microsimulation methods. There are also large computational advantages with the effective tax rates and guarantees compared to microsimulation methods, especially if one is interested in analyses across states and over time. With the plethora of state-specific rules that vary over time, modeling the complete budget constraint facing a recipient is prohibitive, and thus the effective tax rates and guar-antees provide a succinct summary of constraints facing the average recipient.
A limitation of the estimated tax rates and guarantees is that since they are aver-ages reflecting state rules and practice, as well as the demographic composition of the caseload, the coefficients in Equation 1 do not necessarily reflect marginal deci-sion-making and thus do not possess any particular structural interpretation. Specif-ically, the effective tax rates and guarantees may change in response to a change in income levels and income sources among recipients, but with no concurrent change in official policy or actual caseworker behavior. For example, if recipients switch to unearned income sources that do not reduce the size of the benefit then we would document a decline in effective tax rates on unearned income even though official rates were unchanged. As a consequence, the coefficients from Equation 1 are most useful for out-of-sample predictions if nonparticipants face the same budget con-straint as participants. If they do not, the coefficients are still an improvement over the naı¨ve approach using total income with statutory rules, but caution on any struc-tural interpretation is imperative. Of course, even in situations where a strucstruc-tural in-terpretation is not possible, the coefficients remain quite useful for predicting benefits among recipients, and also can be useful in characterizing state program conditions in reduced-form models of transfer-program participation.
reforms are not likely to have any bearing on the basic methodology. Included in this group are expanded asset limits, time limits on benefits, and work requirements. Of course, work requirements imply that more recipients should report earned income (though this is highly dependent on the state’s definition of what constitutes work), and if the earnings levels surpass disregards, then this may result in an increase in effective tax rates on earnings. However, the prospective change in composition of income under TANF is perfectly consistent with the methodology as it applied to the AFDC program.
Other new rules, however, have affected benefit generosity, and still others affected both program eligibility and benefit generosity. An example of the former is family caps, while an example of the latter is sanctions. Because of widespread perception that welfare generosity led to higher rates of out-of-wedlock childbearing many states obtained waivers to impose so-called family caps on benefits, which as typi-cally implemented, freeze the level of benefits even if the size of the assistance unit increases (16 states implemented family caps under waivers, and five more added caps to their TANF program). Sanctions for failure to adhere to work requirements were first introduced into AFDC in 1988 with passage of the Family Support Act that created the Job Opportunities and Basic Skills (JOBS) program. With waivers in the early 1990s, and then with TANF, many states stiffened their JOBS sanction policy, some imposing a partial sanction on benefits (usually retaining the benefit for chil-dren, but sanctioning adult beneficiaries), and others imposing a full sanction on the family (six states impose a full-family lifetime sanction as part of their TANF program).
Importantly, for the present purposes of estimating effective tax rates and guaran-tees with Equation 1 the imposition of family caps and sanctions has no fundamental impact on the specification of the regression model. Moreover, the basic interpreta-tion of the coefficients is unchanged in that the model still produces estimates of average benefit guarantees and average tax rates on earned and unearned income. However, in addition to reflecting the usual state policies and typical deductions from total income the averages also reflect other policies such as family caps and sanctions (and possible caseworker discretion in the imposition of such policies).4 As em-phasized by McKinnish et al. (1999), Equation 1 is most useful in predicting benefits for actual recipients, and not necessarily as a mechanism to predict how benefits change with a change in income or family size. This same caveat applies in the TANF era.
Although in general it is not possible to separately identify the underlying reasons why effective tax rates and guarantees change over time because they are convolu-tions of state policies, caseworker discretion, and demographic composition of recip-ients, in the context of welfare reform it may be possible to further isolate the influence of official state policy from other reasons by exploiting the fact that states differed widely in how aggressively they reformed their AFDC programs. It is quite likely that states that pursued a more aggressive reform agenda in terms of sanctions,
time limits, work requirements, asset limits, and other policies also more aggres-sively altered effective tax rates and guarantees. If so, then if it is possible to identify groups of states by the degree of ‘‘aggressiveness’’ of welfare reform then it may be possible to identify to a greater extent the role of official policy in affecting changes in effective tax rates and guarantees (though causal statements will still not be pos-sible with this descriptive analysis).
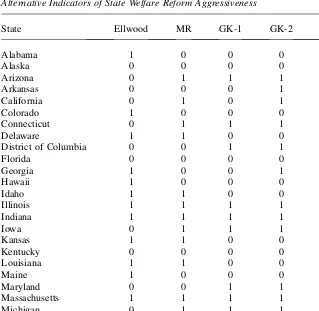
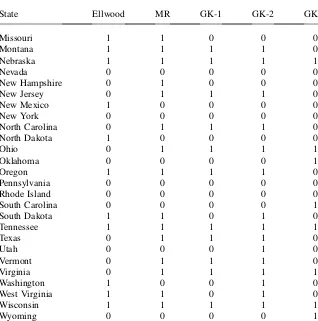
There is no generally agreed-upon measure of aggressiveness in terms of welfare policy. Consequently, I consider five separate groupings of states as summarized in Table 1. The first measure, labeled Ellwood, refers to a statistical approach of aggres-siveness adopted by David Ellwood (1999) in his analysis of the effects of the EITC and welfare reform on various social and economic outcomes. Specifically, Ellwood argued that a plausible measure of aggressiveness is one that captures the changing odds that people of a given earnings level in a given state would receive public
Table 1
Alternative Indicators of State Welfare Reform Aggressiveness
State Ellwood MR GK-1 GK-2 GK-3
Alabama 1 0 0 0 0
Massachusetts 1 1 1 1 0
Michigan 0 1 1 1 0
Minnesota 0 0 0 0 0
Mississippi 1 0 0 1 1
assistance. To construct the measure he used data from the Current Population Sur-vey over the period 1984–92 to estimate a probit model of AFDC participation among single parents in each state as a function of age, education, race, state unem-ployment, earnings, and a linear trend. Then he predicted the likelihood of receiving aid using the same demographic and state level variable but with data from the 1997
Table 1 (continued)
State Ellwood MR GK-1 GK-2 GK-3
Missouri 1 1 0 0 0
and 1998 CPS under the proviso that AFDC program rules were the same as in the base period of 1984–92. The difference between the actual and predicted decline in AFDC participation between 1991–92 and 1997–98 is used as the metric of ag-gressiveness. For my purpose I denote with a 1 in Table 1 those states predicted to be most aggressive based on Ellwood’s methodology; that is, those states with a greater than ten percentage point difference between actual and predicted AFDC participation.
The second category is labeled MR, which refers to Ellwood’s categorization of the programmatic listing of aggressiveness by Meyer and Rosenbaum (2001), and which consists of four parts: (1) whether the real AFDC benefit fell at least 25 per-cent between 1986 and 1997; (2) whether the state imposed a time limit waiver; (3) whether a state imposed full family sanctions for failure to comply with JOBS requirements; and (4) whether any persons were terminated for failure to meet a re-quirement under AFDC waivers. For states that satisfied at least three of the four cri-teria, Ellwood defined these states as most aggressive and I denote such states with a 1 in the second column of Table 1.
The last three columns labeled GK–1, –2, and –3 refer to the three separate meas-ures of aggressiveness as depicted in Grogger and Karoly (2005). GK–1 is derived from their Table 4.1 where a state is deemed aggressive if it had three or more waiv-ers implemented between 1992 and 1996. GK–2 is also derived from their Table 4.1 where a state is deemed aggressive if it had 1 or more waivers implemented between 1992 and 1996. Obviously, the latter is a much weaker criteria for aggressive as nearly three-fourths of states had such waivers. GK–3 is perhaps the most extreme measure of aggressiveness as it is derived from their Table 4.2 where a state is deemed aggressive if all four studies on state sanctions policies summarized in the table agree that the state’s sanction policy is stringent during the 1992–96 period (where stringent typically means full family benefit sanction). Although none of these measures alone depict any concise notion of aggressiveness, taken together the five measures denote variation in the degree of reform ambition and collectively should shed some light on how states differed in their approach to tax rates and guar-antees.
III. Quality Control Data
In this project I use administrative data for the 20-year period span-ning 1983–2002 from the AFDC Quality Control System from 1983–97 (AFDC-QC) and the National TANF Data System (NTDS) from 1998–2002 (in 1998–99 the tran-sitional NTDS was called the Emergency TANF Data System).
1983–91 for their calculations as the post 1982 AFDC-QC data contains about 60,000 observations. The Urban Institute, under contract with DHHS, has made AFDC-QC data and codebooks for 1983–97 available online at http://afdc.urban.org/.
With the creation of TANF after passage of PRWORA in 1996, the AFDC-QC sys-tem was eliminated. However, states are obligated to provide quarterly reports of their total monthly TANF caseload, or a random sample of the caseload, to the Na-tional TANF Data Reporting System. I obtained the public-use version of this data for 1998–2002 from the Administration for Children and Families in DHHS. These data files contain information on 160,000 to over 200,000 recipient households across the various years and contain income and demographic data akin to those found in the AFDC-QC data.
I adhere closely to the selection criteria of McKinnish et al. (1999) for the AFDC/ TANF analysis. Specifically, the unit of observation is single female-headed families with dependent children younger than 18. This excludes assistance units under the AFDC-Unemployed Parent Program, which permits both biological parents to be present in the household, as well as child-only assistance units. In addition, the fe-male head is required to be between the ages of 15 and 65, to have a monthly benefit less than $1,100, to have monthly earned income less than $2,000, to have monthly unearned income less than $2,000, and to have nonmissing values for any of the var-iables used in the analysis. In the first year of the sample, I obtain 56,385 observa-tions as compared to 56,141 in McKinnish et al. (1999).5
An implication of the exclusion of child-only cases is that as the AFDC caseload fell in the mid 1990s, the composition of the caseload shifted toward child-only cases and thus the sample sizes of single mother cases fell. For example, by 1997 there are just less than 17,000 single mother assistance units meeting the selection criteria in the AFDC-QC data. For the NTDS data I use similar selection criteria as in the ear-lier years, although the data in the 1998 and 1999 fiscal years do not identify the gen-der of the household head such that it is possible that some single heads in the sample are male (but this is likely to be no more than 1–2 percent). In fiscal year 2000 DHHS resumes reporting the gender of the head in the NTDS database. Because of the larger initial samples in the NTDS, about 70,000 single-head assistance units are available for estimation for each year over the 1998–2002 period.
I also follow McKinnish et al. (1999) in defining earned income as the sum of wages and salaries, self-employment income, and any reported refunds from the Earned Income Tax Credit. Very few assistance units report EITC income both be-cause few female heads actually worked during the AFDC era, and while consider-ably more work in the TANF period, some of that work is not eligible for the EITC, but for most cases the EITC was not received during the reporting month or the month prior (and there is some ambiguity as to whether the states should only report monthly EITC income when only about 1 percent of all EITC recipients receive the
advanced monthly payment). The definition of unearned income varies by year depending on data availability, but generally is defined as the sum of income from Social Security, railroad retirement, Supplemental Security Income, food stamps, un-employment insurance, workers compensation, veterans benefits, child support, gen-eral assistance, housing subsidies, education grants, other unearned income, other government assistance, and other deemed income. The earned and unearned income is summed across all members of the assistance unit.6
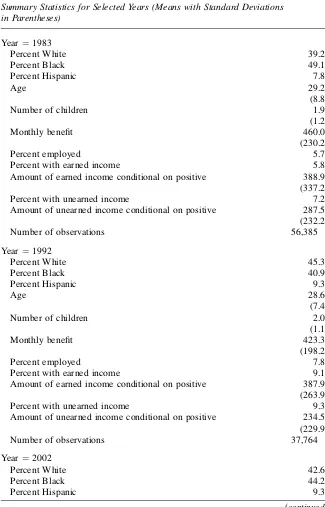
Table 2 presents summary statistics for selected years and demographic variables from the AFDC/TANF administrative files. As is evident from the table, there have been some changes in the demographic composition of the AFDC caseload over the past two decades. The fraction of caseload heads that are white or Hispanic grew over time, the age of the average recipient head declined by almost one year, the real benefit declined on average, and perhaps most striking the fraction of adult heads who are employed increased nearly four-fold from 5.8 percent to 23.5 percent. As a consequence, the average amount of earned income in the assistance unit increased nearly $240 in real terms over 1983–2002. Also of note in Table 2 is striking growth in the fraction of families with unearned income, which as described below is largely driven by changes in the reporting of the dollar value of food stamps.
IV. Effective Tax Rates and Benefit Guarantees in
AFDC/TANF, 1983-2002
I present results on changes in effective tax rates and guarantees in the AFDC/TANF program over the two decades 1983–2002. In each year, there are up to 255 coefficients, and thus I follow the previous literature by focusing the discussion on major cross-state trends over time. In Appendix Tables 1–5, I present the estimated effective guarantees for two-, three-, and four-person AFDC/TANF units, along with the effective tax rates on earned and unearned income, by state and by year.7In terms of model fit, in OLS models (as opposed to the reported trun-cated regression coefficients) the R-squared is consistently around 0.95 in the AFDC-QC period, and never falls below 0.91 in the NTDS database.
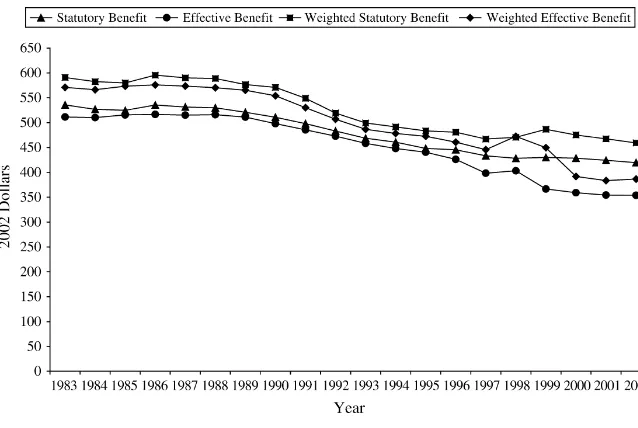
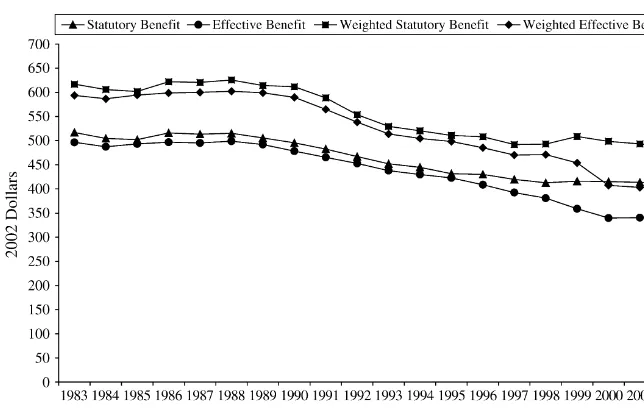
In Figure 1, I show the trends in the inflation-adjusted statutory and effective AFDC/TANF benefit guarantee for a single mother with two dependent children.8 Following McKinnish et al. (1999) I also present the guarantees weighted by the number of AFDC/TANF recipients in the given state-year. The unweighted estimates refer to the average state in a given year, while the weighted estimates refer to the average recipient.
There are a number of interesting results in Figure 1. First, there is a strong down-ward trend in the statutory maximum benefit guarantee beginning in the late 1980s,
6. A data appendix with Stata programs for sample selection and estimation are available from the author upon request.
7. These estimates are available as appendix tables at the JHR website http://www.ssc.wisc.edu/jhr/ and as an Excel spreadsheet at http://gatton.uky.edu/Faculty/Ziliak/workpap.htm.
Table 2
Summary Statistics for Selected Years (Means with Standard Deviations in Parentheses)
Amount of earned income conditional on positive 388.9
(337.2)
Percent with unearned income 7.2
Amount of unearned income conditional on positive 287.5
(232.2)
Amount of earned income conditional on positive 387.9
(263.9)
Percent with unearned income 9.3
Amount of unearned income conditional on positive 234.5
but this long-term slide abates around 1998 after welfare reform is passed.9The ini-tial upward adjustment in 1998 is primarily driven by Wisconsin’s adoption of a fam-ily cap on benefits, whereby the statutory TANF benefit for a three-person famfam-ily in Wisconsin increased from $517 per month in 1997 to $673 per month in 1998. Real benefits stabilized after 1998 due to the fact that more than 20 states raised their nominal statutory benefits in 2000 and inflation was relatively modest in the subse-quent years. Second, like McKinnish et al. (1999) I find that in the 1980s there is little difference between the statutory guarantee and the effective guarantee, and that this similarity persists until the 1996 welfare reform legislation when a significant wedge is driven between the effective and statutory guarantees. Falling effective guar-antees makes welfare less attractive to recipients and is consistent with the stated pol-icy goal of encouraging work and discouraging welfare. Third, I find that the weighted guarantees exceed the unweighted guarantees, which as argued by McKinnish et al. (1999) suggests that states with larger than average caseloads have larger than aver-age benefits. Interestingly the weighted effective guarantee exceeds the unweighted statutory guarantee until 2000, which likely reflects the strong decline in AFDC case-loads among some of the states.
One of the most striking findings in Figure 1 is the divergence between the effec-tive and statutory guarantees after welfare reform. With the elimination of the AFDC-QC system in 1997 and creation of the NTDS there were an increased number of states with missing data, or data with insufficient variation to estimate the model parameters, especially in the first two years of the transition 1998 and 1999 (See Ap-pendix Tables 1–5). As a check to make sure this divergence is not driven by changes
Table 2 (continued)
Amount of earned income conditional on positive 624.1
(391.6)
Percent with unearned income 90.1
Amount of unearned income conditional on positive 316.2
(181.5)
Number of observations 76,408
Note: All dollar amounts are deflated by the personal consumption expenditure deflator with 2002 base year.
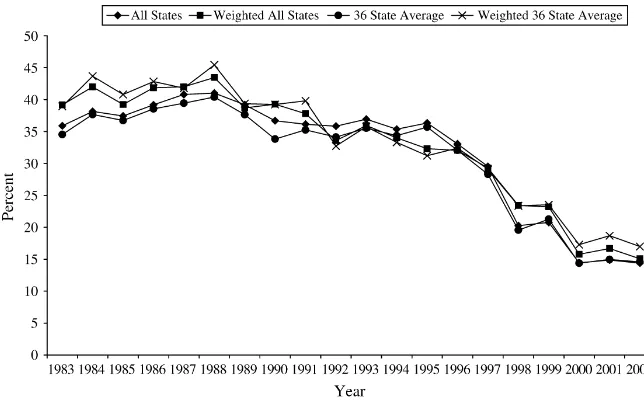
in sample composition, I restrict attention to the 36 states that provide a complete time series on all estimated model parameters from 1983–2002. Figure 2 records the results of the 36-state average, and as is apparent, the gap between statutory and effective guarantees remains in the balanced subsample. Because the data source changes from the AFDC-QC to the NTDS in 1998, I cannot rule out the possibility that the relative decline in effective guarantees is due to a different sampling frames in the NTDS; however, given that the fall in effective guarantees is present in both the full sample and balanced subsample, this is suggestive that the push toward en-couraging work (and/or disen-couraging welfare) was real and not the result of shifting composition of states used in the analyses.
The expanding gap between average statutory and effective guarantees may or may not have been associated with a change in cross-state inequality in welfare gen-erosity. In Table 3, I document the coefficient of variation in (unweighted) statutory and effective guarantees for selected years using all available states. As seen in the table, between-state inequality in statutory benefits actually peaked in 1993 and then fell to levels similar to the 1980s after welfare reform. However, inequality in effec-tive guarantees continued to expand and reached a peak in 1998, suggesting that the decentralization of welfare in the late 1990s expanded cross-state discretion in imple-menting benefit payment policies.
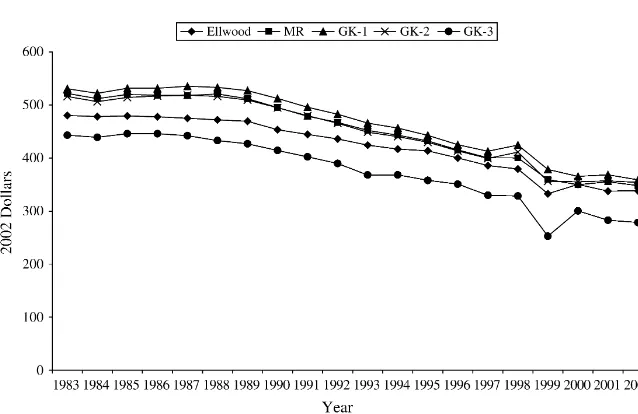
A deeper glimpse into the role of possible changes in official state policies on the time series of effective guarantees can be seen by examining whether there is het-erogeneity across states based on the extent of aggressiveness in pursuing reforms to the state programs. In Figures 3 and 4, I depict statutory and effective guarantees
Figure 1
for three-person units based on the five categories of aggressiveness delineated in Table 1 (that is, I plot the series for the states that are 1s in each category). The esti-mates are for all states in the case of statutory benefits and for those with nonmissing data for the effective benefits, and are unweighted because the interest here is on the average state and not average recipient. In both figures there is little difference be-tween the states grouped on the MR and GK–1 and 2 measures, but states deemed aggressive based on Ellwood’s statistical measure and on whether the states sanction policy is deemed to be stringent (GK–3) have systematically less generous welfare programs, and in the case of stringent sanctions states, reduced guarantees at a faster
Figure 2
Real AFDC/TANF Guarantees for three Persons, 36 State Average
Table 3
Changes in Cross-State Benefit Inequality in the AFDC/TANF Program
Year
Coefficient of Variation for Three-Person Statutory
Benefit
Coefficient of Variation for Three-Person Effective
Benefit
1983 0.385 0.381
1988 0.376 0.373
1993 0.400 0.404
1998 0.388 0.425
Figure 4
Real AFDC/TANF Effective Guarantees for Three-Persons by State Welfare Reform Aggressiveness
Figure 3
rate on average after 1992 compared to other states as depicted in the first two panels of Table 4. (Note that the drop in effective guarantees in 1999 in Figure 4 is wholly explained by the fact that Wisconsin is dropped from the analysis that year because the truncated estimator failed to properly converge for Wisconsin. Linearly interpo-lating between 1998 and 2000 suggests that effective guarantees more smoothly de-cline in practice.)
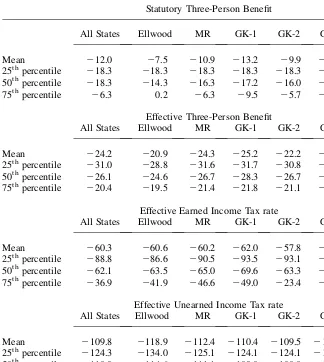
Table 4
Cross-State Distribution of Changes in AFDC/TANF Benefits and Tax Rates in the Welfare Reform Era (Percent Change Between 1992–2002)
Statutory Three-Person Benefit
All States Ellwood MR GK-1 GK-2 GK-3
Mean 212.0 27.5 210.9 213.2 29.9 214.6
25thpercentile 218.3 218.3 218.3 218.3 218.3 222.8
50thpercentile 218.3 214.3 216.3 217.2 216.0 218.3
75thpercentile 26.3 0.2 26.3 29.5 25.7 210.2
Effective Three-Person Benefit
All States Ellwood MR GK-1 GK-2 GK-3
Mean 224.2 220.9 224.3 225.2 222.2 226.3
25thpercentile 231.0 228.8 231.6 231.7 230.8 233.6
50thpercentile 226.1 224.6 226.7 228.3 226.7 224.1
75thpercentile 220.4 219.5 221.4 221.8 221.1 221.4
Effective Earned Income Tax rate
All States Ellwood MR GK-1 GK-2 GK-3
Mean 260.3 260.6 260.2 262.0 257.8 274.2
25thpercentile 288.8 286.6 290.5 293.5 293.1 287.2
50thpercentile
262.1 263.5 265.0 269.6 263.3 273.7
75thpercentile 236.9 241.9 246.6 249.0 223.4 266.1
Effective Unearned Income Tax rate
All States Ellwood MR GK-1 GK-2 GK-3
Mean 2109.8 2118.9 2112.4 2110.4 2109.5 2116.0
25thpercentile 2124.3 2134.0 2125.1 2124.1 2124.1 2125.6
50thpercentile 2110.9 2114.6 2111.1 2109.8 2108.0 2110.9
75thpercentile 296.6 2100.8 298.5 296.1 297.5 2102.3
I next turn to an examination of trends in effective tax rates on earned and earned income. In Figure 5, I present the 20-year time series of weighted and un-weighted effective tax rates on earnings using all available state-years as well as the common set of 36 states present for all periods. The effective tax rate on earnings is fairly stable through the mid 1980s, though considerably below the statutory rate of 100 percent suggesting that states historically passed through a significant portion of recipients’ earned income. As conjectured previously, with the new flexibility afforded states with welfare reform it is quite plausible that these effective rates would not change much if policymakers aligned the new statutory policies with the previous actual practice. However, as seen in Figure 5, after peaking in 1988 a secular downward trend in the tax rate on earnings emerged, and accelerated in the mid 1990s during the welfare reform period. By the end of the sample period, the effective tax rate on earnings fell over 60 percent on average from about 40 per-cent to 15 perper-cent.
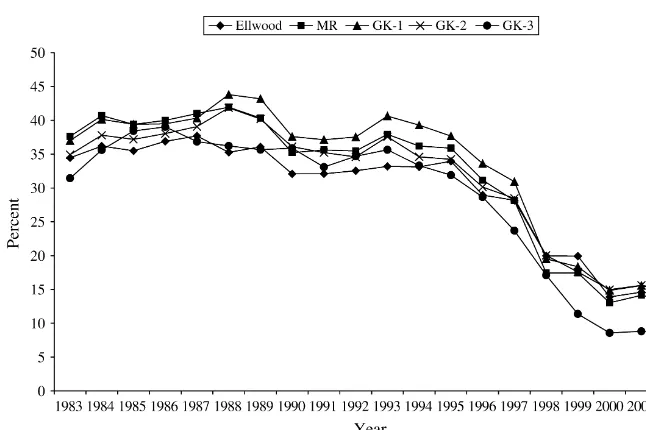
It is important to recall that changes in effective tax rates could come from changes in official policy, changes in caseworker behavior, or changes in the compo-sition of income among recipients toward sources less subject to taxation, or some combination of all these the factors. Notwithstanding this caveat, the sharp decline in effective tax rates in both the average state and for the average recipient is con-sistent with the ‘‘making work pay’’ philosophy of the 1990s. To examine this fur-ther, I once again separate states based on aggressiveness of welfare policy choices and record the time series in Figure 6. Although the effective earned income tax rates states are bunched together fairly tightly, there is as much as an eight percentage point difference in average tax rate levels between the least aggressive group of states
Figure 5
(GK–1) and the most aggressive group of states (GK–3). Moreover, as reported in the third panel of Table 4, states that implemented stringent sanctions in the waiver pe-riod experienced the most dramatic reductions in earned income tax rates, an average reduction of 74 percent compared to 60 percent for all states.
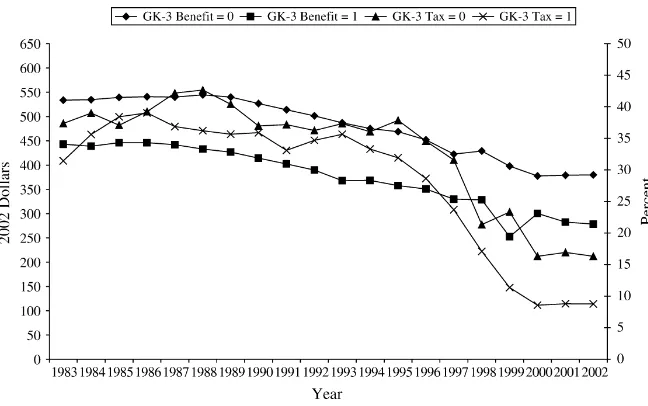
Because stringent sanction policy appears to be an important indicator of other welfare policies, it is instructive to examine just how much cross-state heterogeneity in effective guarantees and earned-income tax rates exists across states based on ag-gressive sanction policy (GK–3). In Figure 7, I depict on the left axis the time series of three-person effective guarantees for states without aggressive sanctions policies (GK–3 Benefit¼ 0) and those with aggressive policies (GK–3 Benefit¼ 1), and on the right axis I depict the corresponding effective tax rates on earned income (GK–3 Tax¼0 and GK–3 Tax¼1). States with aggressive sanctions policies had effective guarantees about $100 lower on average in every year. On the other hand, these same states had effective tax rates on earned income lower than states without stringent sanctions policies in every year except one, and the rates were about one-half the size after 1998. Both sets of trends are consistent with the work pays philos-ophy that appears to be prevalent in states adopting stringent sanction policies.
In Figure 8, I present the time-series of cross-state average effective tax rates on unearned income, and in Figure 9, I present parallel series based on state welfare re-form aggressiveness. Perhaps not surprising the time series of unearned income tax rates is less smooth than that on earned income because the composition of unearned income varies considerably across recipients within a state and over time, and also is likely subject to more variable tax treatment by caseworkers. The large drop in 1986,
Figure 6
Figure 8
Effective AFDC/TANF Unearned Income Tax Rates, 1983–2002
Figure 7
which is also found in Appendix Table 3C of McKinnish et al. (1999), is likely due to the expanded unearned income sources collected in the AFDC-QC system. Subse-quent to this drop, there is an upward trend in effective unearned tax rates until the early 1990s, whereupon a secular downward trend emerges. With passage of welfare reform, however, the effective tax rate on unearned income is eliminated, suggesting complete pass through of nonlabor income for TANF benefit determina-tion. As seen in Figure 9 the extreme reduction in effective unearned income tax rates holds for all states as well as for those with aggressive reforms.
Because the elimination of the unearned tax rate coincides with the transition from the AFDC-QC data to the NTDS data it is important once again to examine differ-ences in the two surveys. McKinnish et al. (1999) include food stamps in their cal-culation of unearned income, as do I, but they note that reported food stamps in the AFDC-QC is zero for most recipients even though they receive the transfer. Appar-ently, administrators of the AFDC-QC omitted food stamps from the data set because it is not subject to taxation by the AFDC/TANF system. With the advent of the NTDS, however, the dollar amount of the food-stamp benefit is recorded for recipi-ents. For example, in 1997, the fraction of unearned income received in the form of food stamps is 17 percent and the fraction of families receiving nonfood-stamp un-earned income is 8.6 percent. In 1999, the fraction of unun-earned income received in the form of food stamps jumps to 92 percent, and the fraction of families reporting nonfood-stamp unearned income remains stable at 8.4 percent. Thus, it is possible that the large drop in unearned tax rates is explained by the inclusion of food stamps (and thus the estimates for 1983-97 using the AFDC-QC are over-estimates because of the omission of food-stamp benefits).
Figure 9
As a check on the influence of food stamps to the estimates in Figure 8 and in Appendix Table 5, in Figure 10 I repeat the unweighted time series for all states in-clusive of food stamps, and then include a revised set of average estimates for 1998-2002 in the NTDS excluding food stamps. Without food stamps, the estimates for 1998 and 1999 are similar to those for 1997 in the AFDC-QC, suggesting that the omission of food stamps in the AFDC-QC system leads to an upward bias in the esti-mates. However, beginning in 2000 the effective rate falls about 70 percent even without food stamps. This decline could be the result of deliberate policy reform or caseworker discretion to facilitate welfare to work transitions, but one also cannot rule out the possibility that it is the result of reporting differences across data systems and/or a change in the composition of unearned income among recipients. In 1998 and 1999 the NTDS reports the dollar amount of food stamps and unearned income, but not the individual components such as SSI, Social Security, Unemployment In-surance, child support, among others. As of 2000, they resume reporting the individ-ual components and thus it is necessary to construct unearned income by summing across these sources. Hence, the fact that the average effective tax rates in 1998 and 1999 exclusive of food stamps do not change relative to 1997 could simply be due to the omission of untaxed, unearned income in the Emergency TANF Data System for those two years. A third, and perhaps more plausible, reason could be a composition shift among income received by recipients. Recall from Table 2 that there was up-ward of a fourfold increase in the fraction of recipients reporting earned income be-tween the AFDC era and the TANF era. There was also a doubling of the fraction of recipients reporting nonfood-stamp unearned income between AFDC and TANF. Between 1999 and 2000, the percentage of recipients with nonfood-stamp unearned income rose from 8 percent to 16 percent, and this higher level persisted through
Figure 10
2002. Most of this income is likely passed through by policy, resulting in the lower observed effective tax rates on unearned income.
V. Conclusion
In this paper, I used administrative data over the two-decade period 1983–2002 to estimate effective tax rates and benefit guarantees in the AFDC/TANF program. These estimates are of interest both because they are useful in tracking cross-state over time changes in program administration and targeting, and because they can be used in reduced-form and structural models of labor supply and transfer program participation, among other outcomes. The latter should be especially useful to researchers interested in understanding the dramatic changes in work and welfare over the 1990s.
I found that effective tax rates on earnings in AFDC/TANF fell 50 percent after welfare reform, and that the tax on unearned income fell at least 70 percent and per-haps was eliminated altogether. Moreover, while the decade-long slide in both real statutory and effective benefit guarantees in AFDC/TANF abated after welfare re-form, the gap between the two expanded, which reinforced the attractiveness of work along with the tax cuts. States that aggressively reformed their welfare programs, es-pecially those states that implemented a stringent sanctions policy on benefits, expe-rienced a more rapid reduction in effective tax rates and guarantees, suggesting that benefit policy may have been bundled with other aspects of the cultural change in the provision of cash assistance. Although it is not possible to attribute all these changes to policy reforms given the change in reporting systems and possible composition changes among the population of welfare recipients, they are suggestive that policy-makers in the 1990s succeeded in their pledge to reduce the work disincentive effects of transfer programs.
References
Ellwood, David. 1999. ‘‘The Impact of the Earned Income Tax Credit and Social Policy Reforms on Work, Marriage, and Living Arrangements.’’National Tax Journal53(4, Part 2):1063–1105.
Fraker, Thomas, and Robert Moffitt. 1988. ‘‘The Effect of Food Stamps on Labor Supply: A Bivariate Selection Model.’’Journal of Public Economics35:25–56.
Fraker, Thomas, Robert Moffitt, and Douglas Wolf. 1985. ‘‘Effective Tax Rates and Guarantees in the AFDC Program, 1967–1982.’’Journal of Human Resources 20(2):251–63.
Gallagher, L. Jerome, Megan Gallagher, Kevin Perese, Susan Schreiber, and Keith Watson. 1998. ‘‘One Year After Federal Welfare Reform: A Description of State Temporary Assistance for Needy Families (TANF) Decisions as of October 1997.’’ The Urban Institute. Unpublished.
Gottschalk, Peter. 1988. ‘‘The Impact of Taxes and Transfers on Job Search.’’Journal of Labor Economics6(3):362–75.
Hausman, Jerry, and David Wise. 1977. ‘‘Social Experimentation, Truncated Distributions, and Efficient Estimation.’’Econometrica45(4):919–38.
Hoynes, Hilary. 1996. ‘‘Welfare Transfers in Two-Parent Families: Labor Supply and Welfare Participation under AFDC-UP.’’Econometrica64(2):295–332.
Hutchens, Robert. 1978. ‘‘Changes in AFDC Tax Rates: 1967–71.’’Journal of Human Resources13(1):60–74.
Lurie, Irene. 1974. ‘‘Estimates of Tax Rates in the AFDC Program.’’National Tax Journal 27(1):93–111.
MaCurdy, Thomas, David Green, and Harry Paarsch. 1990. ‘‘Assessing Empirical Approaches for Analyzing Taxes and Labor Supply.’’Journal of Human Resources25(3):416–89. McKinnish, Terra, Seth Sanders, and Jeffrey Smith. 1999. ‘‘Estimates of Effective Guarantees
and Tax Rates in the AFDC Program for the Post-OBRA Period.’’Journal of Human Resources34(2):312–45.
Moffitt, Robert. 1979. ‘‘Cumulative Effective Tax Rates and Guarantees in Low-Income Transfer Programs.’’Journal of Human Resources14(1):122–29.
———. 1983. ‘‘An Economic Model of Welfare Stigma.’’The American Economic Review 73(5):1023–35.
Ribar, David, and Mark Wilhelm. 1999. ‘‘The Demand for Welfare Generosity.’’Review of Economics and Statistics81(1):96–108.
Romich, Jennifer L. 2006. ‘‘Difficult Calculations: Low-Income Workers and Marginal Tax Rates.’’Social Service Review80(1):27–66.
Rosenzweig, Mark, and Kenneth Wolpin. 1994. ‘‘Parental and Public Transfer to Young Women and Their Children.’’American Economic Review84(5):1195–1212.
U.S. House of Representatives, Committee on Ways & Means. 2004. ‘‘Other Programs.’’ 2004 Green Book, http://waysandmeans.house.gov/media/pdf/greenbook2003/ Section15merge.pdf.