T H E J O U R N A L O F H U M A N R E S O U R C E S • 45 • 3
Smoking Decisions
Evidence from Smoking Histories in the
United States, 1940–2000
Damien de Walque
A B S T R A C T
This paper tests the hypothesis that education improves health and in-creases life expectancy. The analysis of smoking histories shows that after 1950, when information about the dangers of tobacco started to diffuse, the prevalence of smoking declined earlier and most dramatically for col-lege graduates. I construct panels based on smoking histories in an at-tempt to isolate the causal effect of smoking from the influence of time-invariant unobservable characteristics. The results suggest that, at least among women, college education has a negative effect on smoking preva-lence and that more educated individuals responded faster to the diffusion of information on the dangers of smoking.
I. Introduction
The strong correlation between education and health outcomes, even after controlling for income, has been recognized as a robust empirical observation in the social sciences and economic literature (Cutler and Lleras-Muney 2006; Dea-ton and Paxson 2003; Fuchs 1982; Grossman 2006; Lleras-Muney 2005). The de-cision to smoke or not to smoke is a conscious choice that directly affects the health
Damien de Walque is a Senior Economist at the World Bank, Development Research Group. He thanks Gary Becker, Pedro Carneiro, Raphael De Coninck, Mark Duggan, Michael Greenstone, Michael Grossman, Ted Joyce, Donald Kenkel, Fabian Lange, Steven Levitt, Ellen Meara, Chris Rohlfs, Tomas Philipson, and participants in the Applications Workshop at the University of Chicago, the NBER Health economics seminar, the 24th Arne Ryde Symposium on the Economics of Substance Use at Lund Univer-sity (Sweden), the Econometric Society World Congress (UniverUniver-sity College London) 2005, the AEA Meetings (Boston) 2006, and Lehigh University for helpful comments and discussions. The findings, in-terpretations, and conclusions expressed in this paper are those of the author and do not necessarily represent the views of the World Bank, its Executive Directors, or the governments they represent. The data used in this article can be obtained beginning February 2011 through January 2014 from Damien de Walque, 1818 H Street, NW, Washington, DC 20433, USA. ddewalque@worldbank.org
[Submitted November 2007; accepted April 2009]
status and ultimately the mortality of individuals. Smoking behaviors therefore pro-vide an interesting opportunity to investigate how education, by influencing behav-iors, affects health outcomes.
Smoking habits were not initially perceived as dangerous. The information re-vealing the health-damaging consequences of cigarette smoking emerged gradually between 1950 and 1970. Variations in smoking prevalence across education groups during this period might inform us about the way individuals reacted to that infor-mation and how education helps in accessing and processing this inforinfor-mation.
This paper, using smoking behavior as an example, examines whether the effect of education on improving health outcomes can be considered as causal. It turns out smoking is the leading cause of premature adult mortality. Each year in the United States, tobacco use causes more than 438,000 deaths.1
The issue of the causality in the relationship between education and health is important in the health economics literature. Theoretical explanations for this cor-relation can be classified into three broad categories. One explanation stresses that education is an investment. Education will deliver a higher income, a higher con-sumption level in the future, and raises the value of staying alive (Becker 1993; Becker 2007). More educated individuals are healthier because their investment in the future gives them the right incentives to protect their health. Another explanation, based on education entering as a factor in the health production function (Grossman 1972), emphasizes that education improves the access to health-related information and the processing of that information to make health-related decisions. A third view (Farrell and Fuchs 1982; Fuchs 1982) claims that the observed correlation between health and education is mainly due to unobservables, like the discount factor or the ability that causes the same individuals both to study longer and to take greater care of their health. This study will attempt to distinguish the first two explanations from the third one, but will not attempt to separate the first two.
I investigate whether the effect of education in reducing smoking is causal in three steps. I first analyze smoking behaviors across education groups in the United States from 1940 to 2000. Despite the lack of surveys linking education and smoking before 1966, I obtain this information by using retrospective smoking histories structed from the smoking supplements of National Health Interview Surveys con-ducted between 1978 and 2000 (U.S. Department of Health and Human Services, 1978–2000). Such a reconstruction had never been done systematically and is a useful contribution to the knowledge of historical patterns in smoking behaviors. The conclusion from the analysis is that the smoking prevalence among more edu-cated individuals, college graduates in particular, declined earlier and most dramat-ically than in any other education category. The decline for college graduates started in 1954, four years after the medical consensus on the health consequences of smok-ing and ten years before the publication of the first Surgeon General’s Report on this issue. This suggests that they had easier access to the information and/or were more able to process that information.
Farrell and Fuchs (1982), however, challenge this conclusion taken from cross-sectional analysis. They show that the strong negative relation between schooling
and smoking observed at age 24 is accounted for by differences in smoking prev-alence at age 17, when schooling is still very similar across individuals. Using the smoking histories constructed for this paper, my second step is to reproduce results similar to Farrell and Fuchs (1982). From their analysis, it would therefore appear that a causal link between education and smoking cannot be established and that a “third unobservable variable” should be preferred as the hypothesis to explain the correlation between smoking and education.
But, by limiting their analysis to the 17 to 24 age range, Farrell and Fuchs (1982) omit most of people’s smoking histories, and, in particular, they almost entirely ignore smoking cessation.
This paper uses the information recovered from the smoking histories to construct a series of panels and analyze smoking behavior in a way that allows accounting for time-invariant unobservable characteristics. Given a date of smoking initiation and of smoking cessation, the smoking status of an individual can be reconstructed for each age. Assuming that college graduation takes place between ages 17 and 25, allows one to analyze smoking behavior for the same individual before and after college.
Comparing the results from an individual-level panel data analysis using fixed effects with cross-sectional estimates is instructive as the panel data analysis allows removing the influence of unobserved individual time-invariant characteristics like time preference or ability. In the cross-sectional analysis, for males, the negative gradient between education and smoking is present for all birth cohorts (starting with those born between 1910 and 1919) but its magnitude increases with age and with later birth cohorts, while the negative association between schooling and smok-ing among females begins to appear around the time that evidence of a causal link between smoking and lung cancer became widely known. In the fixed effect panel regressions, the negative gradient between smoking and college takes longer to ap-pear. For females, the negative association is still roughly coincident with the wide-spread knowledge of the smoking-cancer link. But this is not true for males. It is not until the male birth cohorts of 1950–59 that the negative association appears.
The paper is structured as follows. Section II presents descriptive results from the analysis of the smoking prevalence in the United States from 1940 to 2000. Section III focuses on a multivariate, cross-sectional, analysis of smoking behaviors, includ-ing a replication of results similar to Farrell and Fuchs (1982). Section IV presents the results of the panel regressions. Section V concludes.
II. Evidence from Smoking Histories in the United
States, 1940–2000
It is well known by social scientists that more educated people are less likely to smoke (Wald 1988). The literature about the negative correlation be-tween education and tobacco use has become a key element in the debate about whether education is causal in improving health.2
Smoking habits prior to the arrival of the information about the dangers of smok-ing for the health have been less studied due to lack of data (Ferrence 1989; Gilpin and Pierce 2002; Harris 1983; U.S. Department of Health and Human Services 1980; Meara 2001). Before 1950, even though the medical literature mentioned tobacco smoking as a possible factor in causing mouth and lip cancer, there was no consensus in the medical profession. This consensus was achieved in 1950, with the publication of five studies, four in the United States and one in the United Kingdom showing the link between smoking and lung cancer (Peto et al. 2000). These medical findings were echoed in the popular press in 1953 in the Reader’s Digestand inConsumer Report(U.S. Department of Health and Human Services 1989; Cutler and Kadiyala 2003; Viscusi 1992). In 1964, the publication of the first Surgeon General’s Report (U.S. Department of Health and Human Services 1964) gave the endorsement of the government and disseminated the information to a larger public. The release of this report has been ranked one the most important news events of 1964 (U.S. Center for Disease Control and Prevention 2004). The report marks the beginning of aware-ness campaigns and prevention efforts. In 1966, a first health warning was made mandatory on cigarette packages. The wording was rather timid: “Caution: Cigarette Smoking May be Hazardous to Your Health.” Long debates in Washington (National Conference on Smoking and Health 1970) brought in a stronger language in 1970: “Warning: The Surgeon General Has Determined that Cigarette Smoking Is Dan-gerous to Your Health.” Given the overwhelming majority of literate smokers in 1970, the health-damaging consequences of smoking can be considered as common knowledge by then. The period 1950–70 can thus be interpreted as a period of gradual diffusion of that information and it is reasonable to expect the more educated individuals to have had access to that information earlier in that period. How did this differential access to information impact smoking behaviors? This part of the paper will address this question.
A. Data
One problem in studying smoking behaviors before and after the health-damaging consequences of smoking became widely known to the public is the lack of data linking smoking prevalence and education category before 1966. The first smoking supplement included in the National Health Interview Survey dates from 1965,3and in 1966 education categories were included (U.S. Department of Health and Human Services 2004).4 Sander (1995a; 1995b) reports smoking behaviors by schooling
3. Gallup surveys about tobacco use were available as early as 1949, but do not classify the respondents by education category (Cutler and Kadiyala 2003; Viscusi 1992).
levels after 1965. Meara (2001) uses the National Health Interview Survey to look at differential trends in smoking behavior of women by education level after 1966 and she uses the answer to the question of whether a woman had ever smoked in 1966 as a proxy measure of pre-1964 smoking behavior.
This paper uses 16 smoking supplements from different years of the National Health Interview Survey between 1978 and 2000 to construct detailed smoking his-tories going back before 1950. A similar method, based on cohort reconstruction, has been used in the sociological and medical literature with U.S. and Canadian data (Ferrence 1989; Gilpin and Pierce 2002; Harris 1983; Pierce et al. 1989; U.S. De-partment of Health and Human Services 1980).
Since 1978 the smoking questionnaire in the National Health Interview Survey includes questions about the age at which individuals started smoking cigarettes, if they ever started, and about how long ago they stopped, if they did so. Using the year at which individuals started smoking and the year at which they stopped, I constructed 373,738 smoking histories of adults aged 25 and older at the time of the interview.5
To make sure that the education variable is not time sensitive, and given that most people will have reached their definitive education level by age 25, I have sampled only individuals aged 25 and older.
B. Smoking Prevalence by Education Category, 1940–2000
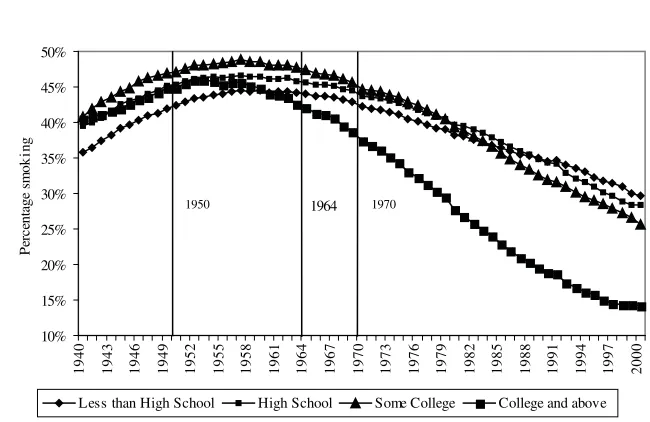
Figure 1 shows how the general smoking prevalence evolved in the United States from 1940 to 2000. The years 1950 (consensus in medical journals), 1964 (first Surgeon General Report), and 1970 (clear health warning on the packages) are benchmarks in the gradual diffusion of the information about the health conse-quences of tobacco. Smoking prevalence in the population aged 25 and older was 37.7 percent in 1940 and reached a peak of 45.9 percent in 1957, before the pub-lication of the Surgeon General’s report. After that, it steadily decreased and reached 24.6 percent in 2000.
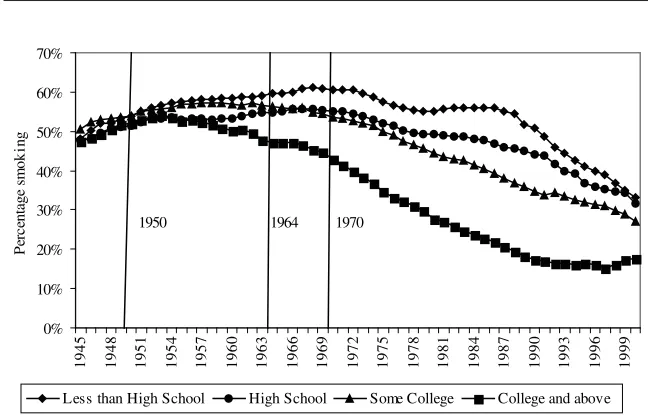
Figure 2 breaks down the data used in Figure 1 in four educational groups: in-dividuals with less than a high school degree, high school graduates, inin-dividuals with some undergraduate education, and finally college graduates together with in-dividuals having studied at the graduate level. Each point on Figure 2 is estimated from at least 1,000 observations. In 1940, individuals with less than a high school degree are the least likely to smoke (35.8 percent). The smoking prevalence for the
0%
1940 1943 1946 1949 1952 1955 1958 1961 1964 1967 1970 1973 1976 1979 1982 1985 1988 1991 1994 1997 2000
Year
Prevalence of Smoking in the United States, Age 25 and older, 1940–2000
Note: From smoking histories constructed from the 1978, 1979, 1980, 1983, 1985, 1987, 1988, 1990, 1991, 1992, 1994, 1995, 1997, 1998, 1999, and 2000 National Health Interview Surveys. The information about the dangers of smoking diffused gradually: 1950, consensus in medical journals, 1964, first Surgeon Gen-eral’s Report, 1970, clear health warning on packages.
10%
1940 1943 1946 1949 1952 1955 1958 1961 1964 1967 1970 1973 1976 1979 1982 1985 1988 1991 1994 1997 2000
Pe
Less than High School High School Some College College and above
1950 1964 1970
Figure 2
Prevalence of Smoking by Education Category in the United States, Age 25 and older, 1940–2000
Note: From smoking histories constructed from the 1978, 1979, 1980, 1983, 1985, 1987, 1988, 1990, 1991, 1992, 1994, 1995, 1997, 1998, 1999, and 2000 National Health Interview Surveys. The information about the dangers of smoking diffused gradually: 1950, consensus in medical journals, 1964, first Surgeon Gen-eral’s Report, 1970, clear health warning on packages.
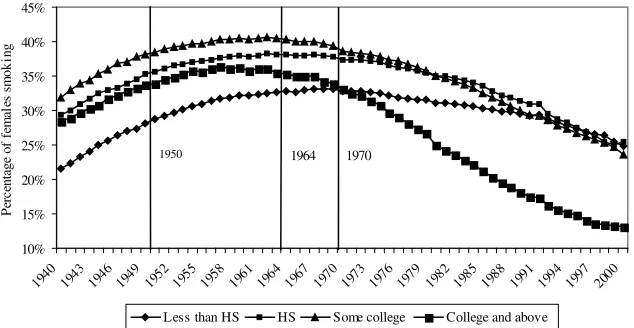
much above 40 percent).6That gender gap is much smaller in 2000 and has all but disappeared for the college graduates. The relatively low (around 22 percent) prev-alence for women with less than a high school degree is what drives down the general prevalence for that category in 1940.
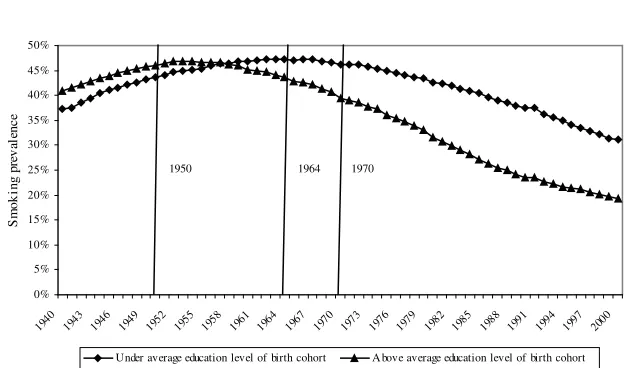
Keep in mind that in this analysis the general level of education in the population has been steadily increasing between 1940 and 2000. Being a college graduate in 1940 was more exceptional than it was in 2000. Figure 5 addresses this question by plotting the smoking prevalence among individuals above or under the average edu-cation level in each year for individuals aged 25 in that particular year.7Initially, individuals above the average education level were more likely to smoke. The posi-tive difference between the prevalence in both groups has been gradually decreasing and now the situation has been inverted, since individuals under the average school-ing level in the population are much more likely to smoke.
6. One of the reasons why smoking prevalence among men was historically higher than among women is that smoking was heavily subsidized during military service, as documented in Bedard and Deschenes 2006. In De Walque 2007b, I explicitly include (Vietnam) veteran status in the analysis and I find that veterans are more likely to smoke, but that the introduction of the veteran status variable does not affect OLS estimates of the impact of education on smoking behaviors.
10%
Less than HS HS Some college College and above
1950 1964 1970
Figure 3
Prevalence of Smoking by Education Category in the United States, Males, Age 25 and older, 1940–2000
Note: From smoking histories constructed from the 1978, 1979, 1980, 1983, 1985, 1987, 1988, 1990, 1991, 1992, 1994, 1995, 1997, 1998, 1999, and 2000 National Health Interview Surveys. The information about the dangers of smoking diffused gradually: 1950, consensus in medical journals, 1964, first Surgeon Gen-eral’s Report, 1970, clear health warning on packages.
10%
Less than HS HS Some college College and above
1950 1964 1970
Figure 4
Prevalence of Smoking by Education Category in the United States, Females, Age 25 and older, 1940–2000
0%
Under average education level of birth cohort A bove average education level of birth cohort
1950 1964 1970
Figure 5
Prevalence of Smoking by Relative Educational Level in the United States, Age 25 and older, 1940–2000
Note: From smoking histories constructed from the 1978, 1979, 1980, 1983, 1985, 1987, 1988, 1990, 1991, 1992, 1994, 1995, 1997, 1998, 1999, and 2000 National Health Interview Surveys. The information about the dangers of smoking diffused gradually: 1950, consensus in medical journals, 1964, first Surgeon Gen-eral’s Report, 1970, clear health warning on packages. Each individual is classified as above or under the average educational achievement in each year for individuals who were aged 25 in that particular year.
C. Sample Composition Issues
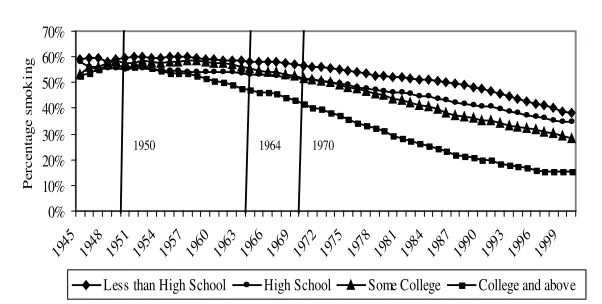
The retrospective smoking histories allow a complete overview of smoking preva-lence patterns by education levels from 1940.8However, this method presents two problems in the composition of the sample. First, since the information about smok-ing prevalence between 1940 and 1977 is gathered from surveys taken between 1978 and 2000, only individuals who survived up to the year of the survey are interviewed. Since smokers usually die sooner than nonsmokers, this creates a “survivor” bias: nonsmokers are disproportionately represented among persons interviewed at older ages. For example, if we take someone who is 40 years old in 1945—that person would be 73 in 1978. To make it into the sample, he would have had to survive through the ages that smokers are least likely to survive, so he is less likely to have been a smoker. This problem can be mitigated by selecting respondents younger than 60 years of ageat the time of their interview in the survey.Even though there is already some excess mortality due to smoking before age 60, most of the pre-mature deaths from smoking-related diseases occur between age 60 and 75 (Peto et al. 2000). Figure 6 plots the smoking prevalence from 1945 to 2000 by education
0%
Less than High School High School Some College College and above
1950 1964 1970
Figure 6
Prevalence of Smoking by Education Category in the United States, Age 25 to 60 at the Time of the Survey, 1945–2000
Note: From smoking histories constructed from the 1978, 1979, 1980, 1983, 1985, 1987, 1988, 1990, 1991, 1992, 1994, 1995, 1997, 1998, 1999, and 2000 National Health Interview Surveys. Only individuals aged younger than 60 at the time of the interview were selected. The information about the dangers of smoking diffused gradually: 1950, consensus in medical journals, 1964, first Surgeon General’s Report, 1970, clear health warning on packages.
categories for respondents aged 60 or less at the time of the interview (for example, the person who is 40 in 1945 and 73 in 1978 would be dropped from the sample). The historical patterns of smoking prevalence by education levels are similar to the ones described previously.9
The fact that data for the period 1940–77 are taken from interviews after 1977 implies that the age distribution for the years before 1978 is not complete. The data for the year 1940, for example, is made from individuals 25 years of age and older, but young enough in 1940 to have survived up to at least 1978, 38 years later. As one gets closer to 1978, the age distribution in the sample becomes closer to the age distribution in the general population. To address this problem and maintain a constant age distribution, Figure 7 plots the smoking prevalence by education for individuals between the age of 25 and 30 in each year. If we consider that Figure 7 is somewhat less precisely estimated given the reduced sample size implied by the selection of the 25–30 age group, Figures 2, 6, and 7 are very similar.10
9. However, a comparison between Figures 2 and 6 confirms the existence of a survivor bias. This is best seen in the 1945–50 period: In Figure 6 the smoking prevalence is higher (above 50 percent) than in Figure 2 and the trend up to the early 1960s is rather flat, whereas Figure 2 suggests an increasing prevalence up to that point. These two comparisons suggest that in figure 2, between 1940 and 1950, nonsmokers are overrepresented because of the survivor bias. By construction, however, the importance of this survivor bias decreases over time.
0% 10% 20% 30% 40% 50% 60% 70%
1945 1948 1951 1954 1957 1960 1963 1966 1969 1972 1975 1978 1981 1984 1987 1990 1993 1996 1999
Pe
rc
en
ta
g
e s
m
o
k
in
g
Less than High School High School Some College College and above
1950 1964 1970
Figure 7
Prevalence of Smoking by Education Category in the United States, Age 25–30, 1945–2000
Note: From smoking histories constructed from the 1978, 1979, 1980, 1983, 1985, 1987, 1988, 1990, 1991, 1992, 1994, 1995, 1997, 1998, 1999, and 2000 National Health Interview Surveys. The information about the dangers of smoking diffused gradually: 1950, consensus in medical journals, 1964, first Surgeon Gen-eral’s Report, 1970, clear health warning on packages.
Even though the above mentioned sample composition issues, which are inherent to the retrospective nature of the data, need to be taken into consideration and have some influence on the estimation of the smoking prevalence between 1940 and 1950, they do not affect the main conclusion already drawn from Figure 2: More educated individuals reacted earlier and more dramatically to the arrival of information about the health consequences of smoking. By controlling the year of birth, the multivariate regressions of the type performed in the following sections also address some of those sample composition issues.
Another problem, however, with the way the data set has been constructed, is that it is only possible to use time-invariant variables like gender, race, and educational achievement (which I assume does not vary after age 25). Variables such as income or the number of cigarettes smoked per day, present in most of the surveys, are
0
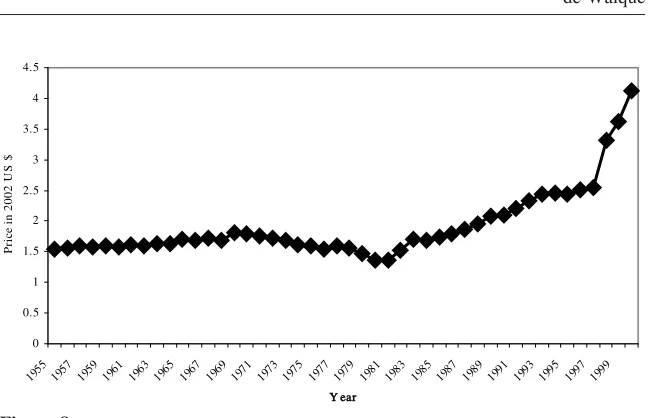
Real price of one pack of 20 cigarettes, United States, 1955–2000, in 2002 Dollars
Note: The data for the 1955-90 period are taken from the “Tax Burden on Tobacco”, an historical com-pilation edited by the Tobacco Tax Council (Tobacco Tax Council, 1990). From 1993, the index on “Cigarette and other tobacco products” in the Consumer Price Index database of the Bureau of Labor Statistics is used (U.S. Department of Labor, 2001). The prices for 1991 and 1992 were obtained by using interpolation between 1990 and 1993. I have used the inflation calculator of the Bureau of Labor Statistics to transform the prices in 2002 dollars.
measured at the date of the survey but, since they can vary over time, they cannot be included in regressions which I rely on retrospective data.11
The price of cigarettes is also an important element of the smoking decision, even if tobacco is an addictive good (Becker, Grossman, and Murphy 1994). The National Health Interview Surveys do not include information about prices but the evolution of the real, after-tax price of a pack of 20 cigarettes from 1955 to 2000 is recon-structed in Figure 8.12Despite a slight increase in the early 1970s, it is mainly with the tax increases after 1980 and, even more strongly, with the Tobacco Settlement
11. Using the single 1990 National Health Interview Survey, I verified that considering the quantity of tobacco smoked does not change the conclusion. Controlling for income, the higher the level education among smokers, the smaller the amount of cigarettes smoked daily. This result reinforces my previous conclusions: More educated people are less likely to smoke and, if they smoke, they are smoking fewer cigarettes per day. Results are available on request from the author.
of the late 1990s that the real price to consumers increased substantially. Figure 2 indicates that most of the differential in smoking prevalence by educational level is already present before the early 1980s and has occurred when there was no large variation in the real price of cigarettes.
Finally, it is worth emphasizing that this data set of smoking histories is based on self-reported smoking behaviors. This limitation of the data is difficult to avoid, especially in an historical context. It would potentially bias the results if more edu-cated individuals were more or less likely to report truthfully their smoking practices. I am not aware of evidence that this would be the case.
III. Cross-sectional analysis of smoking behaviors
Farrell and Fuchs (1982) use the age pattern of smoking initiation to show that “the strong negative relation between schooling and smoking observed at age 24 is accounted for by differences in smoking behavior at age 17, when all subjects were all in the same grade.”13Using the data set constructed for this paper, I replicated results similar to those obtained by Farrell and Fuchs (1982) for each ten-year birth cohort between 1910 and 1979.
The model is:
S ⳱␣CⳭXⳭε
(1) a a
Where:
ais age and goes from 17 to 60 according to the regression.
Sis a dummy for whether the individual smokes at agea.
C is a time-invariant dummy for whether or not the individual is a college graduate. At age 17, it represents future college status and, as in Farrel and Fuchs (1982), it takes the value 1 for future college graduates.
X are other time-invariant covariates: gender, race, year of birth, and survey year.
Read horizontally, Tables 1 and 2 follow smoking behavior at a particular age, across birth cohorts while read vertically, the tables follow the same birth cohort across different ages. I focus on college education for two reasons. College gradu-ation is the crucial margin for smoking prevalence, as evidenced in Figure 2. It also will allow me to compare Tables 1 and 2 with Tables 3 and 4 where I will consider a series of panels following smoking behavior before and after college graduation.
The results are included in Table 1 for males and Table 2 for females. In the first two rows of Tables 1 and 2,14the dependent variable is whether the individual was
13. Notice that the sample used in Farrell and Fuchs (1982) is not nationally representative as it is drawn from four small California cities.
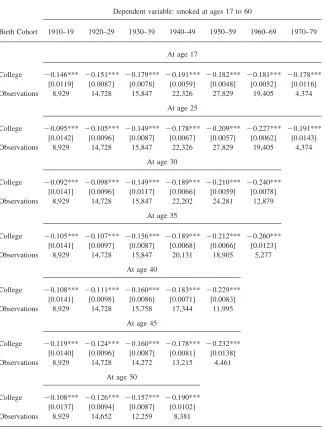
Table 1
The effect of college education on smoking behavior at different ages. Males. Cross-sectional linear regressions
Dependent variable: smoked at ages 17 to 60
Birth Cohort 1910–19 1920–29 1930–39 1940–49 1950–59 1960–69 1970–79
At age 17
College ⳮ0.146*** ⳮ0.151*** ⳮ0.179*** ⳮ0.191*** ⳮ0.182*** ⳮ0.181*** ⳮ0.178*** [0.0119] [0.0087] [0.0078] [0.0059] [0.0048] [0.0052] [0.0116] Observations 8,929 14,728 15,847 22,326 27,829 19,405 4,374
At age 25
College ⳮ0.095*** ⳮ0.105*** ⳮ0.149*** ⳮ0.178*** ⳮ0.209*** ⳮ0.227*** ⳮ0.191*** [0.0142] [0.0096] [0.0087] [0.0067] [0.0057] [0.0062] [0.0143] Observations 8,929 14,728 15,847 22,326 27,829 19,405 4,374
At age 30
College ⳮ0.092*** ⳮ0.098*** ⳮ0.149*** ⳮ0.189*** ⳮ0.210*** ⳮ0.240*** [0.0141] [0.0096] [0.0117] [0.0066] [0.0059] [0.0078] Observations 8,929 14,728 15,847 22,202 24,281 12,879
At age 35
College ⳮ0.105*** ⳮ0.107*** ⳮ0.156*** ⳮ0.189*** ⳮ0.212*** ⳮ0.260*** [0.0141] [0.0097] [0.0087] [0.0068] [0.0066] [0.0123] Observations 8,929 14,728 15,847 20,131 18,905 5,277
At age 40
College ⳮ0.108*** ⳮ0.111*** ⳮ0.160*** ⳮ0.183*** ⳮ0.229*** [0.0141] [0.0098] [0.0086] [0.0071] [0.0083] Observations 8,929 14,728 15,758 17,344 11,995
At age 45
College ⳮ0.119*** ⳮ0.124*** ⳮ0.160*** ⳮ0.178*** ⳮ0.232*** [0.0140] [0.0096] [0.0087] [0.0081] [0.0138] Observations 8,929 14,728 14,272 13,215 4,461
At age 50
College ⳮ0.108*** ⳮ0.126*** ⳮ0.157*** ⳮ0.190*** [0.0137] [0.0094] [0.0087] [0.0102] Observations 8,929 14,652 12,259 8,381
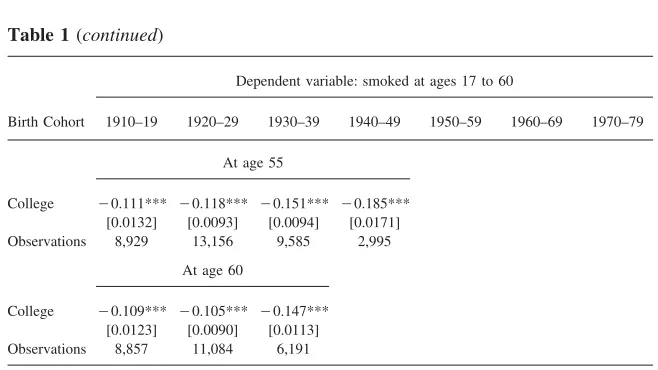
Table 1(continued)
Dependent variable: smoked at ages 17 to 60
Birth Cohort 1910–19 1920–29 1930–39 1940–49 1950–59 1960–69 1970–79
At age 55
College ⳮ0.111*** ⳮ0.118*** ⳮ0.151*** ⳮ0.185*** [0.0132] [0.0093] [0.0094] [0.0171] Observations 8,929 13,156 9,585 2,995
At age 60
College ⳮ0.109*** ⳮ0.105*** ⳮ0.147*** [0.0123] [0.0090] [0.0113] Observations 8,857 11,084 6,191
Analysis from smoking histories from the 1978, 1979, 1980, 1987, 1988, 1992, 1995, 1997, 1998, 1999 and 2000 National Health Interview Surveys for individuals age 17 and older at the time of the survey. At age 17, the individual is assigned his future college graduation status. Smoking histories are recon-structed using the age at smoking initiation and cessation. See also Note 5. Additional controls include gender, year of birth, race, and survey year dummies. Robust standard errors in square brackets. ***, **, * denote statistical significance at the 1 percent, 5 percent, and 10 percent confidence levels, respectively.
smoking at age 17 and at age 25. At age 17, the individuals is assigned, as in Farrell and Fuchs (1982) his or her future college graduation status. For males in Table 1, at age 25, when educational achievements can be considered as definitive, there is a clear negative effect of college graduation on smoking prevalence. This effect increases for younger birth cohorts. But, at age 17, before college enrollment, when males are classified according to their future definitive schooling levels, the strong negative relationship between college and smoking is already present.15Similarly, for females in Table 2, the negative gradient between education and smoking is also already present at age 17 (except for the cohort born between 1910 and 1919 for which the coefficient is insignificant).16Farrel and Fuchs (1982) use the existence
15. Actually, for males, the magnitude of the gradient is larger at age 17 than at age 25 for the birth cohorts born before 1950. This might indicate that individuals who will end up less educated start smoking sooner and that those who will become more educated are more likely to start later, between ages 17 and 25. This is confirmed in the two last rows of Table 3: Among males, future college graduates tend to start smoking later.
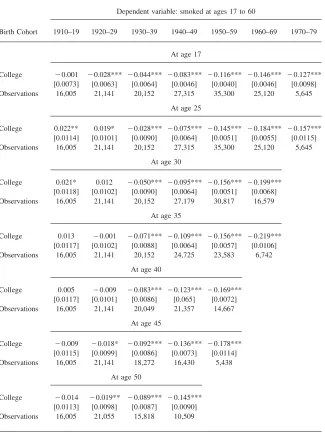
Table 2
The effect of college education on smoking behavior at different ages. Females. Cross-sectional linear regressions.
Dependent variable: smoked at ages 17 to 60
Birth Cohort 1910–19 1920–29 1930–39 1940–49 1950–59 1960–69 1970–79
At age 17
College ⳮ0.001 ⳮ0.028*** ⳮ0.044*** ⳮ0.083*** ⳮ0.116*** ⳮ0.146*** ⳮ0.127*** [0.0073] [0.0063] [0.0064] [0.0046] [0.0040] [0.0046] [0.0098] Observations 16,005 21,141 20,152 27,315 35,300 25,120 5,645
At age 25
College 0.022** 0.019* ⳮ0.028*** ⳮ0.075*** ⳮ0.145*** ⳮ0.184*** ⳮ0.157*** [0.0114] [0.0101] [0.0090] [0.0064] [0.0051] [0.0055] [0.0115] Observations 16,005 21,141 20,152 27,315 35,300 25,120 5,645
At age 30
College 0.021* 0.012 ⳮ0.050*** ⳮ0.095*** ⳮ0.156*** ⳮ0.199*** [0.0118] [0.0102] [0.0090] [0.0064] [0.0051] [0.0068] Observations 16,005 21,141 20,152 27,179 30,817 16,579
At age 35
College 0.013 ⳮ0.001 ⳮ0.071*** ⳮ0.109*** ⳮ0.156*** ⳮ0.219*** [0.0117] [0.0102] [0.0088] [0.0064] [0.0057] [0.0106] Observations 16,005 21,141 20,152 24,725 23,583 6,742
At age 40
College 0.005 ⳮ0.009 ⳮ0.083*** ⳮ0.123*** ⳮ0.169*** [0.0117] [0.0101] [0.0086] [0.065] [0.0072] Observations 16,005 21,141 20,049 21,357 14,667
At age 45
College ⳮ0.009 ⳮ0.018* ⳮ0.092*** ⳮ0.136*** ⳮ0.178*** [0.0115] [0.0099] [0.0086] [0.0073] [0.0114] Observations 16,005 21,141 18,272 16,430 5,438
At age 50
College ⳮ0.014 ⳮ0.019** ⳮ0.089*** ⳮ0.145*** [0.0113] [0.0098] [0.0087] [0.0090] Observations 16,005 21,055 15,818 10,509
Table 2(continued)
Dependent variable: smoked at ages 17 to 60
Birth Cohort 1910–19 1920–29 1930–39 1940–49 1950–59 1960–69 1970–79
At age 55
College ⳮ0.018* ⳮ0.025*** ⳮ0.086*** ⳮ0.141*** [0.0109] [0.0097] [0.0094] [0.0148] Observations 16,005 19,294 12,513 3,823
At age 60
College ⳮ0.026** ⳮ0.035*** ⳮ0.090*** [0.0103] [0.0094] [0.0112] Observations 15,913 16,769 8,152
Analysis from smoking histories from the 1978, 1979, 1980, 1987, 1988, 1992, 1995, 1997, 1998, 1999 and 2000 National Health Interview Surveys for individuals age 17 and older at the time of the survey. At age 17, the individual is assigned her future college graduation status. Smoking histories are recon-structed using the age at smoking initiation and cessation. See also Note 5. Additional controls include gender, year of birth, race, and survey year dummies. Robust standard errors in square brackets. ***, **, * denote statistical significance at the 1 percent, 5 percent, and 10 percent confidence levels, respectively.
of a negative gradient between future college graduation and tobacco use at age 17 as ground to reject the causality from schooling to smoking, in favor of a “third variable” hypothesis. However, they do not analyze smoking behavior after age 24. Tables 1 and 2 present, by birth cohort, a cross-sectional analysis of smoking be-havior at a large range of ages (17 to 60).
The remainder of the analysis now focuses on smoking behaviors between ages 25 and 60.17In Table 1 for males, all coefficients on college education are negative and significant. The general trend is for them to increase in magnitude horizontally indicating that the younger the birth cohort, the stronger the negative effect of edu-cation on smoking for a certain age. Among cohorts born later in the 20th century who have been more exposed to information, the effect of college education seems to be stronger.
The analysis for females is in Table 2. The magnitude of the coefficients is smaller among females than males. For females born between 1910 and 1919 at ages 25 and 30 and those born between 1920 and 1929 at age 25, the coefficient on college status is positive and significant. Before the information on the dangers of smoking was available, more educated women were more likely to smoke.18For those two birth cohorts, at older ages, the coefficient on college is not statistically different
17. Tables 1 and 2 use a linear regression model, but Tables A1 and A2 confirm the results using a logit model, displaying the marginal effects of the logit coefficients.
Table 3
The effect of college education on smoking behavior at different ages. Panel data with fixed effects, linear model. Males
Dependent variable: smoked at age 17 and smoked at ages 25 to 60
(1) (2) (3) (4) (5) (6) (7)
Birth cohort 1910–19 1920–29 1930–39 1940–49 1950–59 1960–69 1970–79
At age 25
College 0.047*** 0.041*** 0.024*** 0.005 ⳮ0.030*** ⳮ0.045*** ⳮ0.014 [0.0140] [0.0097] [0.0084] [0.0066] [0.0053] [0.0054] [0.0130] Observations 17,858 29,456 31,694 44,652 55,658 38,810 8,748
At age 30
College 0.048*** 0.046*** 0.023*** ⳮ0.007 ⳮ0.038*** ⳮ0.043*** [0.0145] [0.0100] [0.0089] [0.0069] [0.0058] [0.0074] Observations 17,858 29,456 31,694 44,404 48,562 25,758
At age 35
College 0.033** 0.036*** 0.016* ⳮ0.012* ⳮ0.041*** ⳮ0.050*** [0.0148] [0.0103] [0.0092] [0.0073] [0.0068] [0.0125] Observations 17,858 29,456 31,694 40,262 37,810 10,554
At age 40
College 0.029** 0.031*** 0.012 ⳮ0.011 ⳮ0.050*** [0.0146] [0.0106] [0.0095] [0.0078] [0.0091] Observations 17,858 29,456 31,516 34,688 23,990
At age 45
College 0.017 0.017* 0.006 ⳮ0.001 ⳮ0.047*** [0.0149] [0.0107] [0.0100] [0.0093] [0.0159] Observations 17,858 29,456 28,544 26,430 8,922
At age 50
College 0.027* 0.015 0.0007 0.010 [0.0149] [0.0107] [0.0106] [0.0124] Observations 17,858 29,304 24,518 16,762
At age 55
College 0.024 0.0159 0.009 0.005 [0.0148] [0.0111] [0.0120] [0.0224] Observations 17,858 26,312 19,170 5,990
Table 3(continued)
Dependent variable: smoked at age 17 and smoked at ages 25 to 60
(1) (2) (3) (4) (5) (6) (7)
Birth cohort 1910–19 1920–29 1930–39 1940–49 1950–59 1960–69 1970–79
At age 60
College 0.028* 0.027 0.021 [0.0145] [0.0116] [0.0158]
Observations 17,714 22,168 12,382
Average age at smoking initiation for smokers
College 19.14 18.45 18.60 18.35 18.38 18.52 18.16
Not college 17.50 17.14 16.92 16.91 17.13 17.01 16.74
Analysis from smoking histories from the 1978, 1979, 1980, 1987, 1988, 1992, 1995, 1997, 1998, 1999, and 2000 National Health Interview Surveys for individuals age 25 and older at the time of the survey. Smoking histories are reconstructed using the age at smoking initiation and cessation. See also Note 5. Panel linear regressions with individual fixed effects: the baseline smoking behavior is always taken at age 17. College always takes the value 0 at age 17. At ages 25 and older, it takes the value 1 for college graduates and the value 0 otherwise. Age is controlled for. Robust and clustered standard errors in square brackets. ***, **, * denote statistical significance at the 1 percent, 5 percent, and 10 percent confidence levels, respectively.
than zero. From age 55 for women born in 1910–19 and from age 45 for women born in 1920–29, this coefficient becomes negative and significant. Thus, for those two birth cohorts of females, there is a complete reversal of the gradient between education and smoking as individuals age and as the health related information becomes available. For females born after 1929, all coefficients are negative and significant. For females, looking vertically for the same birth cohort and abstracting from smoking at age 17, the older the individuals, the stronger the negative effect of education on smoking tends to be.
The results of Tables 1 and 2 suggest that comparing smoking behaviors at ages 17 and 25 like Farrell and Fuchs (1982) misses the dynamics of smoking cessation in adult ages and that there are substantial differences in quitting behavior by edu-cation level.
Table 4
The effect of college education on smoking behavior at different ages. Panel with fixed effects, linear models. Females.
Dependent variable: smoked at age 17 and smoked at ages 25 to 60
(1) (2) (3) (4) (5) (6) (7)
Birth cohort 1910–19 1920–29 1930–39 19401–49 1950–59 1960–69 1970–79
At age 25
College 0.025*** 0.046*** 0.01 0.004 ⳮ0.032*** ⳮ0.038*** ⳮ0.031*** [0.0104] [0.0098] [0.0085] [0.0061] [0.0047] [0.0048] [0.0099] Observations 32,010 42,282 40,304 54,630 70,600 50,240 11,290
At age 30
College 0.023* 0.039*** ⳮ0.011 ⳮ0.016*** ⳮ0.048*** ⳮ0.051*** [0.0110] [0.0102] [0.0088] [0.0063] [0.0050] [0.0063] Observations 32,010 42,282 40,304 54,358 61,634 33,158
At age 35
College 0.015 0.025** ⳮ0.031*** ⳮ0.036*** ⳮ0.053*** 0.058*** [0.0159] [0.0102] [0.0089] [0.0066] [0.0058] [0.0109] Observations 32,010 42,282 40,304 49,450 47,166 13,484
At age 40
College 0.007 0.017* ⳮ0.043*** ⳮ0.051*** ⳮ0.057*** [0.0112] [0.0103] [0.0090] [0.0069] [0.0077] Observations 32,010 42,282 40,098 42,714 29,334
At age 45
College ⳮ0.007 0.008 ⳮ0.056*** ⳮ0.061*** ⳮ0.065*** [0.0110] [0.0103] [0.0093] [0.0081] [0.0126] Observations 32,010 42,282 36,544 32,860 10,876
At age 50
College ⳮ0.011 0.006 ⳮ0.057*** ⳮ0.065*** [0.0110] [0.0102] [0.0096] [0.0106] Observations 32,010 42,110 31,636 21,018
At age 55
College ⳮ0.016 ⳮ0.0005 ⳮ0.055*** ⳮ0.079*** [0.0107] [0.0104] [0.0110] [0.0190] Observations 32,010 38,588 25,026 7,646
Table 4(continued)
Dependent variable: smoked at age 17 and smoked at ages 25 to 60
(1) (2) (3) (4) (5) (6) (7)
Birth cohort 1910–19 1920–29 1930–39 19401–49 1950–59 1960–69 1970–79
At age 60
College ⳮ0.024** ⳮ0.008 ⳮ0.047*** [0.0105] [0.0104] [0.0137] Observations 31,826 33,538 16,304
Average age at smoking initiation for smokers
College 21.62 20.79 19.58 19.42 18.8 18.01 17.52
Not college 22.82 21.25 19.78 18.91 17.93 17.09 16.77
Analysis from smoking histories from the 1978, 1979, 1980, 1987, 1988, 1992, 1995, 1997, 1998, 1999, and 2000 National Health Interview Surveys for individuals age 25 and older at the time of the survey. Smoking histories are reconstructed using the age at smoking initiation and cessation. See also Note 5. Panel linear regressions with individual fixed effects: the baseline smoking behavior is always taken at age 17. College always takes the value 0 at age 17. At ages 25 and older, it takes the value 1 for college graduates and the value 0 otherwise. Age is controlled for. Robust and clustered standard errors in square brackets. ***, **, * denote statistical significance at the 1 percent, 5 percent, and 10 percent confidence levels, respectively.
IV. A panel analysis of smoking and education
The evidence presented in the previous sections documents the ap-pearance, after 1950, of a negative gradient between educational achievement and smoking habits. However, since it is based on cross-sectional analyses, this evidence cannot be conclusive about the mechanisms through which education affects health decisions and does not allow distinguishing between three theories explaining the correlation between health and education: (1) education is causal in reducing smok-ing by entersmok-ing as a factor in the health production function; (2) education increases the stream of future income and consumption, and ultimately the value of life, so that it provides incentives for individuals to protect this stream by reducing mortality risks; or (3) the correlation between education and health is due to unobservables like the discount factor or ability that causes the same individuals to both study longer and take care of their health.
This section does suggest a novel approach. An individual-level panel data anal-ysis using fixed effects would allow removing the influence of unobserved individual time-invariant characteristics like time preference or ability. It is important, however, to acknowledge the limitations of this fixed effects strategy. The underlying as-sumption of strict exogeneity is strong as it implies that the error term for each period is independent of the fixed effect and all the regressors in every period. That assumption is unlikely to hold. For example, the discount factor, as suggested by Becker and Mulligan (2007) could evolve over time. Similarly, while one can plau-sibly argue that innate ability is fixed and time-invariant for an individual over time, the effect of ability on the probability of smoking is probably not invariant over time (and exogenous to schooling): Throughout school and their working lives, in-dividuals learn more about their ability. This updating of information, constraints and opportunities presumably affects choices about smoking.
The National Health Interview Surveys do not constitute a panel, but merely repeated cross sections. But, by reconstructing smoking histories based on infor-mation about the date of smoking initiation and smoking cessation,19it is possible to trace back individual smoking behaviors over time, for every age or year. In this section, like in Tables 1 and 2, I will start by considering age 17 and then ages 25 to 60, with five-year intervals. Variations in educational achievement also can be followed over time: Although the actual date of college graduation is not reported in those surveys, it seems safe to assume that it occurs after age 17 and before age 25.
This procedure allows reconstructing retrospectively a series of two period panels based on smoking histories with individual variations on smoking status, according to smoking initiation and smoking cessation and individual variations in education, based on the age of college graduation. The structure of Tables 3 and 4 is similar to Tables 1 and 2,20 but the model, in each cell, is a two-period panel regression with individual fixed effects. The two periods are age 17 on the one hand and ages 25–60 on the other hand. In each regression there are two observations per individ-ual.
The model is:
S ⳱␦C ⳭⳭ␥Ⳮε (2) t,i t,i i t t,i
Where:
t⳱17, a with a⳱ age going from 25 to 60 according to the regression.
is a dummy for whether the individual smokes at aget St,i
is a dummy for whether the individual is a college graduate at timet. Ct,i
is a time-invariant individual specific fixed effect.
i
is an age effect.
␥t
19. Only the 1978, 1979, 1980, 1987, 1988, 1992, 1995, 1997, 1998, 1999, and 2000 NHIS contains both the age at smoking initiation and at smoking cessation and are therefore used.
Tables 3 and 4 use a linear regression model, while Tables A3 and A4, present, results from conditional logit specifications (marginal effects shown), which are tech-nically more appropriate with a binary dependent variable like smoking status.21The individual fixed effect specification, under the strong assumption of strict exogeneity, should purge the estimates from individual specific time-invariant unobservables, like the discount factor or ability.
Tables 3 and 4 present the analysis with the reconstructed panel analysis separately for males and females. For males in Table 3, it is only for the birth cohorts born after 1950 that the coefficient on college education is negative and significant. For older birth cohorts, the coefficients are either not significantly different than zero or, for the older birth cohorts positive. One potential explanation for the positive co-efficients is that future college graduates tend to start smoking later than individuals who will not obtain a college degree. This is shown in the last two rows of Table 3 that display the average age at smoking initiation for the two education categories: for each birth cohorts, future college graduates start smoking on average at least one year after other individuals and, on average, they start after age 17. If, from age 17, college graduates initiate smoking at a higher rate than individuals with no college education—who are more likely to have already started by age 17—and if this is not compensated by a higher quitting rate for college graduates, this would lead to positive coefficients, as found for individuals born between 1910 and 1929 until age 40 and for the 1930–39 birth cohort until age 35 in Table 3. Another explanation for the positive coefficients might be that, before the information on the dangers of smoking was available, smoking was a normal good.
For females in Table 4,22the positive coefficients on college education are con-fined to the birth cohorts 1910–29 when they were young. For females born after 1930, all coefficients are negative and significant, except at ages 25 and 30 for the 1930–39 birth cohort and at age 25 for women born between 1940 and 1949 where the coefficient is not significantly different than zero. The general trend that the coefficient becomes more negative as each birth cohort ages is present for females. Notice in the last two rows of Table 4 that among females born before 1939, future college graduates started to smoke before women with no college degree. Thus, delayed smoking initiation cannot be an explanation for the positive coefficients among females. However, for females, the positive coefficients are limited to old birth cohorts when they were young. Figure 4 suggests that this might be due to women with no high school degree who had a lower smoking prevalence than other females until 1970. For women born after 1940, average age of smoking initiation is higher for future college graduates, like for males.
For both males and females in Tables 3 and 4, the general trend is for the coef-ficient on the college indicator to decrease (going from positive to nonsignificantly different than zero and to negative and more negative), both horizontally and ver-tically. This indicates, reading the table from left to right that, at the same age, the
21. Hahn’s (2001) results for probit models cannot be used in this case because it would require that all individuals attend college. The unconditional logit model would yield inconsistent estimates and I am therefore using the conditional logit model which only uses information from observations that changes status, that is, people who start smoking or quit smoking.
younger the birth cohort, the stronger the negative effect of education on smoking. And, going down each column, it suggests that, for the same birth cohort, the older the individuals, the stronger the negative effect of college education on smoking.
It is important to note that the negative association between smoking and college takes longer to appear than in the cross-sectional analysis in Tables 1 and 2. For females, the negative association is roughly coincident with the widespread knowl-edge of the smoking-cancer link. But, this is not true for males. It is not until the male birth cohorts of 1950–59 that the negative association appears. This suggests that the decline in smoking among men associated with college education did not begin until the late 1970s well after the dangers of smoking had become common knowledge.
The specifications in Tables 3 to 4 assume that the unobservable, individual spe-cific variables that can explain both smoking behaviors and education levels, like the discount factor or ability, are time invariant. The fixed effect regressions would not account for unobservables that vary over time, for example, if the discount factor would be endogenous as in Becker and Mulligan (1997). One could argue that the assumption that unobserved variables are time invariant is far-stretched because smoking is an addictive good and therefore that state dependence is an important factor. However, Tables 3 and 4 include in the bottom rows the average age of smoking initiation for individuals with or without a college degree. There are dif-ferences in age at smoking initiation, but those are not substantial (always less than two years). It follows that when those individuals are older (for example, between age 30 and 40) and they consider quitting tobacco, the length of their smoking addiction does not vary widely.
The results in Tables A3 and A4 under the conditional logit specification confirm the general tendency of the results included in Tables 3 and 4. Among males, for the earlier birth cohorts (1910–39), there is a positive association between education and smoking. This association weakens and loses significance for the more recent birth cohorts (for example, 1940–49). For the cohort born between 1950 and 1959, the association becomes significantly negative. Among females, for the earlier birth cohorts (1910–29), there is generally no significant association between smoking and education, but the negative gradient appears with the 1930–39 birth cohort, much earlier than among males.
Tables 3–4 and Appendix Tables A3–A4 report the results from panels including only two points in time: age 17 and a later age between 25 and 60. On the one hand, these specifications have the advantage that there is no need to assume a specific age for college graduation, information that is not included in the data: At age 17, no individuals are assumed to be college graduates, while at ages 25 and older, all those who report in the survey that they have a college degree are assumed to have already graduated. But on the other hand, those specifications yield very short panels and do not exploit all the information available.
Table 5
Panel data analysis of smoking behavior by birth cohort: long panels
Birth Cohort 1910–19 1920–29 1930–39 1940–49 1950–59 1960–69 1970–79
A. Males
Linear Model
College 0.028*** 0.020*** 0.013*** ⳮ0.004* –0.020*** ⳮ0.020*** ⳮ0.003 [0.0049] [0.0034] [0.0030] [0.0022] [0.0018] [0.0020] [0.0042]
Observations 423,771 604,413 533,016 561,945 508,813 264,811 46,571 Individuals 7,402 12,161 13,172 18,546 22,664 15,965 4,182
Conditional Logit Model (marginal effects)
College 0.014 0.029 0.0006 ⳮ0.004 ⳮ0.062*** ⳮ0.023 0.096 [0.0176] [0.0244] [0.0075] [0.0047] [0.0234] [0.0367] [0.0597]
Observations 240,899 347,600 277,826 251,326 171,357 61,515 9,075 Individuals 4,200 6,915 6,755 8,137 7,447 3,629 817
B. Females
Linear Model
College ⳮ0.013*** ⳮ0.0017 ⳮ0.051*** ⳮ0.043*** ⳮ0.038*** ⳮ0.028*** ⳮ0.019*** [0.0033] [0.0030] [0.0027] [0.0020] [0.0016] [0.0017] [0.0033]
Observations 781,462 885,527 688,575 692,416 640,443 343,626 60,493 Individuals 13,284 17,534 16,890 22,729 28,713 20,783 5,440
Conditional Logit Model (marginal effects)
College ⳮ0.056 ⳮ0.019 ⳮ0.123*** ⳮ0.197*** ⳮ0.168*** ⳮ0.168*** ⳮ0.124*** [0.0402] [0.0121] [0.0300] [0.0383] [0.0256] [0.0339] [0.0639]
Observations 220,317 316,512 256,349 250,788 190,848 72,549 9,294 Individuals 3,827 6,297 6,310 8,124 8,411 4,313 835
Analysis from smoking histories from the 1978, 1979, 1980, 1983, 1985, 1987, 1988, 1990, 1991, 1992, 1994, 1995, 1997, 1998, 1999 and 2000 National Health Interview Surveys for individuals age 25 and older at the time of the survey. Smoking histories are reconstructed using the age at smoking initiation and cessation. See also Note 5. The age of college graduation is assumed to be 21 and the specifications include age and year dummies. Robust standard errors in square brackets. ***, **, * denote statistical significance at the 1 percent, 5 percent, and 10 percent confidence levels, respectively.
model (marginal effects reported). The results are in line with those reported with the shorter, two periods-panels.
born 1940–69), while with the conditional logit model, it is only for the cohort born 1940–49 that a significant negative relationship between education and smoking can be observed. Among females, the coefficient on college education is always negative under both models and that negative relationship is consistently statistically signifi-cant for all women born after 1930.
The combined results from Tables 3–4, Appendix tables A3–A4 and Table 5 yield different conclusions for males and females. The pattern among females is consistent with the idea that more educated individuals responded faster to the diffusion of information on the dangers of smoking. Among males, we observe a complete versal—from positive to negative—of the education/smoking gradient, but that re-versal took longer to materialize and did not coincide perfectly with the gradual diffusion of the information, as the reversal was only fully completed with the cohort born after 1950. The described effects could be considered as causal only under the assumption of strict exogeneity, which is unlikely to hold.
V. Conclusions
This paper starts by analyzing smoking histories reconstructed from National Health Interview Surveys in the United States and by retracing the evolution of smoking patterns across education groups. The main conclusion is that, after the gradual arrival of the information about the dangers of tobacco, the smoking prev-alence among more educated people declined earlier and more dramatically.
The time pattern of the decline in smoking prevalence for individuals with college degrees suggests that at least some of the differential by education can be ascribed to a causal role of education in giving access to and processing the information. Figure 2 shows that the smoking prevalence among college graduates started to decline earlier than for the three other categories. The inflection point is in 1954, ten years before the first Surgeon General’s Report, four years after the consensus in the medical profession, and one year after the first article in the general press on the dangers of smoking.
Farrell and Fuchs (1982) suggest that, because the negative gradient between college and smoking observed at age 24 is already present at age 17, the association between smoking and schooling is not causal. This paper confirms their results but argues that the complete lifecycle of smoking decisions should be considered, in-cluding smoking cessation.
(2007a) shows that in rural Uganda, a negative gradient between education and HIV prevalence and incidence emerged only among young women.
The analysis proposed in this paper does not address the hypothesis that part of the negative gradient between smoking and education is due to social and peer effects. Although this appears to be a reasonable hypothesis, the evidence in this paper that smoking did not vary substantially by education category before 1950 and that the gradient appeared as the information on the dangers of smoking started to diffuse would suggest that peer and social effects could merely act as multipliers and that the interaction between education and information is more likely to have been the trigger.
Rates of return to education, as traditionally calculated, only account for labor market earnings. If the effect of education on health and longevity is, as in the case of smoking reduction, at least partially causal, it would make sense to attribute additional returns to education. I have proposed (De Walque 2003) a method to estimate these extra returns in the context of the HIV/AIDS epidemic in Africa. Compared to HIV/AIDS case, the potential addition to the returns to education is significant but modest in the case of smoking, essentially because smoking kills at relatively late ages.
References
Becker, Gary. 1993.Human Capital: A Theoretical and Empirical Analysis with Special Reference to Education. 3rd Edition. Chicago: University of Chicago Press.
———. 2007. “Health as Human Capital: Synthesis and Extensions.”Oxford Economic Papers59(3):379–410
Becker, Gary, Michael Grossman, and Kevin Murphy. 1994. “An Empirical Analysis of Cigarette Addiction.”American Economic Review84(3):396–418.
Becker, Gary, and Casey Mulligan. 1997. “The Endogenous Determination of Time Preference.”Quarterly Journal of Economics112(3):729–58.
Bedard, Kelly, and Olivier Deschenes. 2006. “The Long-Term Impact of Military Service on Health: Evidence from World War II and Korea Veterans.”American Economic Review96 (1):176–94.
Berger, Mark, and J. Paul Leigh. 1989. “Schooling, Self-Selection and Health.”Journal of Human Resources24(3):433–55.
Chaloupka, Frank, and Kenneth Warner. 2000. “The Economics of Smoking.” InHandbook of Health Economics 1A, ed. Joseph Newhouse and Anthony Culyer, 1539–1627. Amsterdam: North-Holland.
Currie, Janet, and Enrico Moretti. 2003. “Mother’s Education and the Intergenerational Transmission of Human Capital: Evidence from College Openings.”Quarterly Journal of Economics118(4):1495–1532.
Cutler, David, and Srikanth Kadiyala. 2003. “The Return to Biomedical Research: Treatment and Behavioral Effects.” InMeasuring the Gains from Medical Research. An Economic Approach, ed. Robert Topel and Kevin Murphy, 100–62. Chicago: University of Chicago Press.
Deaton, Angus, and Christina Paxson. 2004. “Mortality, Income, and Income Inequality over Time in Britain and the United States.” InPerspectives on The Economics of Aging, vol. 8, ed. David Wise, 247–86. Chicago: University of Chicago Press for National Bureau of Economic Research.
de Walque, Damien. 2003.How Do Education and Information Affect Health Decisions? The Cases of HIV/AIDS and Smoking. Dissertation, University of Chicago, Department of Economics.
———. 2007a. “How Does the Impact of an HIV/AIDS Information Campaign Vary with Educational Attainment? Evidence from Rural Uganda.”Journal of Development Economics84:686–714.
———. 2007b. “Does Education Affect Smoking Behaviors. Evidence using the Vietnam Draft as an Instrument for College Education.”Journal of Health Economics26:877–95. Farell, Phillip, and Victor Fuchs. 1982. “Schooling and Health: The Cigarette Connection.”
Journal of Health Economics1: 217–230.
Ferrence, Roberta G. 1989.The Rise and Fall of Cigarette Smoking in North America. New York, London: Garland Publishing.
Fuchs, Victor. 1982. “Time Preference and Health: An Exploratory Study.” InEconomic Aspects of Health, ed. Victor Fuchs, 93–120. Chicago: University of Chicago Press. Gilpin, Elizabeth, and John Pierce. 2002. “Demographic Differences in Patterns in the Incidence of Smoking Cessation: United States 1950–1990.”Annals of Epidemiology
12(3):141–50.
Grossman, Michael. 1972. “On the Concept of Health Capital and the Demand for Health.”
Journal of Political Economy80(2):223–55.
———. 1975. “The Correlation between Health and Schooling.” InHousehold Production and Consumption, ed. Nestor E. Terlecky, 147–224. New York: National Bureau of Economic Research.
Grossman, Michael. 2006. “Education and Nonmarket Outcomes.” InHandbook of the Economics of Education, ed. Eric Hanushek and Finis Welch, 577–633. Amsterdam: North Holland.
Hahn, Jinyong. 2001. “Comment: Binary Regressors in Nonlinear Panel-Data Models with Fixed Effects.”Journal of Business & Economic Statistics19(1):16–17.
Harris, Jeffrey. 1983. “Cigarette Smoking Among Successive Birth Cohorts of Men and Women in the United States During 1900–80.”Journal of the National Cancer Institute
71:473–79.
Kenkel, Donald. 1991. “Health Behavior, Health Knowledge, and Schooling.”Journal of Political Economy99(2):287–305.
Kenkel, Donald, Dean Lillard, and Alan Mathios. 2003. “Smoke or Fog? The Usefulness of Retrospective Smoking Data.”Addiction98:1307–13.
———. 2004. “Accounting for Misclassification Error in Retrospective Smoking Data.”
Health Economics13:1031–44.
Lleras-Muney, Adriana. 2005. “The Relationship between Education and Mortality in the U.S.”Review of Economic Studies72(1):189–221.
Meara, Ellen. 2001. “Why is Health Related to Socioeconomic Status? The Case of Pregnancy and Low Birth Weight.” National Bureau of Economic Research Working Paper 8231. Cambridge, Mass.
National Conference on Smoking & Health. 1970.A Summary of Proceedings. Sept. 9–11, 1970. Washington, D.C.
Pierce, John, Michael Fiore, Thomas Novotny, Evridiki Hatziandreu, Kantilal Patel, and Ronald Davis. 1989. “Trends in Cigarette Smoking in the United States: Educational Differences are Increasing.”Journal of the American Medical Association261:56–60. Sander, William. 1995a. “Schooling and Quitting Smoking.”The Review of Economics and
Statistics77(1):191–99.
———. 1995b. “Schooling and Smoking.”Economics of Education Review14:23–33. Tobacco Tax Council. 1990.The Tax Burden on Tobacco: Historical Compilation, vol. 25,
Richmond, Va.
U.S. Center for Disease Control and Prevention. 1994.CDC Surveillance Summaries, Surveillance for Selected Tobacco-Use Behaviors—United States, 1900–1994, MMWR 43 (No. SS-3).
———. 2004.History of the 1964 Surgeon General’s Report on Smoking and Health. (http://www.cdc.gov/tobacco/30yrsgen.htm, accessed on May 11, 2004)
U.S. Department of Health, Education, and Welfare, Public Health Service. 1964.Smoking and Health. Report of the Advisory Committee to the Surgeon General of the Public Health Service. Public Health Service Publication No. 1103. Washington, D.C.: UGSPO. U.S. Department of Health and Human Services. 1980.The Health Consequences of
Smoking for Women: A Report of the Surgeon General. Rockville, Md.
———. 1989. Reducing the Health Consequences of Smoking: 25 Years of Progress, a Report of the Surgeon General. Publication No. (CDC) 89–8411. Rockville, Md. ———. National Health Interview Survey, 1978, 1979, 1980, 1983, 1985, 1987, 1988,
1990, 1991, 1992, 1994, 1995, 1997, 1998, 1999, 2000, National Center for Health Statistics. Hyattsville, Md.
U.S. Department of Labor, Bureau of Labor Statistics. 2001. Consumer Price Index Data, 1993–2000. (http://data.bls.gov).
Viscusi, W. Kip. 1990. “Do Smokers Underestimate Risks?”Journal of Political Economy
98(6):1253–69.
———. 1992.Smoking, Making the Risky Decision. Oxford University Press.
Table A1
The effect of college education on smoking behavior at different ages. Males. Marginal effects of cross-sectional logit regressions
Dependent variable: smoked at ages 25 to 60
Birth Cohort 1910–19 1920–29 1930–39 1940–49 1950–59 1960–69 1970–79
At age 25
College ⳮ0.108*** ⳮ0.131*** ⳮ0.172*** ⳮ0.191***ⳮ0.191***ⳮ0.176***ⳮ0.190*** [0.0149] [0.0112] [0.0095] [0.0071] [0.0057] [0.0072] [0.0142] Observations 16,005 21,141 20,152 27,315 35,300 25,120 5,645
At age 30
College ⳮ0.107*** ⳮ0.121*** ⳮ0.165*** ⳮ0.193***ⳮ0.175***ⳮ0.226*** [0.0151] [0.0111] [0.0092] [0.0070] [0.0060] [0.0079] Observations 16,005 21,141 20,152 27,179 30,817 16,579
At age 35
College ⳮ0.117*** ⳮ0.125*** ⳮ0.162*** ⳮ0.179***ⳮ0.182***ⳮ0.261*** [0.0145] [0.0106] [0.0088] [0.0070] [0.0067] [0.0123] Observations 16,005 21,141 20,152 24,725 23,583 6,741
At age 40
College ⳮ0.114*** ⳮ0.119*** ⳮ0.156*** ⳮ0.157***ⳮ0.221*** [0.0140] [0.0100] [0.0084] [0.0073] [0.0083] Observations 16,005 21,141 20,049 21,357 14,667
At age 45
College ⳮ0.111*** ⳮ0.121*** ⳮ0.137*** ⳮ0.160***ⳮ0.234*** [0.0141] [0.0092] [0.0086] [0.0079] [0.0139] Observations 16,005 21,141 18,272 16,430 5,438
At age 50
College ⳮ0.093*** ⳮ0.114*** ⳮ0.117*** ⳮ0.180*** [0.0131] [0.0085] [0.0087] [0.0104] Observations 16,005 21,055 15,818 10,509
At age 55
College ⳮ0.087*** ⳮ0.088*** ⳮ0.116*** ⳮ0.187*** [0.0123] [0.0085] [0.0090] [0.0172] Observations 16,005 19,294 12,513 3,823
Table A1(continued)
Dependent variable: smoked at ages 25 to 60
Birth Cohort 1910–19 1920–29 1930–39 1940–49 1950–59 1960–69 1970–79
At age 60
College ⳮ0.133*** ⳮ0.061*** ⳮ0.157*** [0.0149] [0.0083] [0.0119] Observations 15,913 16,769 7,714
Analysis from smoking histories from the 1978, 1979, 1980, 1987, 1988, 1992, 1995, 1997, 1998, 1999, and 2000 National Health Interview Surveys for individuals age 25 and older at the time of the survey. Smoking histories are reconstructed using the age at smoking initiation and cessation. See also Note 5. Additional controls include age, gender, year of birth, race, and survey year dummies. Robust standard errors in square brackets. ***, **, * denote statistical significance at the 1 percent, 5 percent, and 10 percent confidence levels, respectively.
Table A2
The effect of college education on smoking behavior at different ages. Females. Marginal effects of cross-sectional logit regressions
Dependent variable: Smoked at ages 25 to 60
Birth cohort 1910–19 1920–29 1930–39 1940–49 1950–59 1960–69 1970–79
At age 25
College 0.017** 0.016* ⳮ0.025*** ⳮ0.067*** ⳮ0.116*** ⳮ0.135*** ⳮ0.156*** [0.0086] [0.0085] [0.0076] [0.0057] [0.0046] [0.0061] [0.0113] Observations 16,005 21,141 20,152 27,315 35,300 25,120 5,645
At age 30
College 0.017* 0.010 ⳮ0.044*** ⳮ0.083*** ⳮ0.115*** ⳮ0.173*** [0.0093] [0.0088] [0.0076] [0.0056] [0.0047] [0.0083] Observations 16,005 21,141 20,152 27,179 30,817 16,579
At age 35
College 0.011 ⳮ0.001 ⳮ0.059*** ⳮ0.089*** ⳮ0.121*** ⳮ0.218*** [0.0092] [0.0086] [0.0074] [0.0055] [0.0054] [0.0106] Observations 16,005 21,141 20,152 24,725 23,583 6,741
Table A2(continued)
Dependent variable: Smoked at ages 25 to 60
Birth cohort 1910–19 1920–29 1930–39 1940–49 1950–59 1960–69 1970–79
At age 40
College 0.004 ⳮ0.008 ⳮ0.067*** ⳮ0.090*** ⳮ0.158*** [0.0091] [0.0083] [0.0072] [0.0056] [0.0071] Observations 16,005 21,141 20,049 21,357 14,667
At age 45
College ⳮ0.007 ⳮ0.015* ⳮ0.068*** ⳮ0.108*** ⳮ0.179*** [0.0087] [0.0080] [0.0070] [0.0064] [0.0115] Observations 16,005 21,141 18,272 16,430 5,438
At age 50
College ⳮ0.011 ⳮ0.015** ⳮ0.059*** ⳮ0.138*** [0.0084] [0.0076] [0.0067] [0.0086] Observations 16,005 21,055 15,818 10,509
At age 55
College ⳮ0.014* ⳮ0.018*** ⳮ0.061*** ⳮ0.141*** [0.0067] [0.0074] [0.0067] [0.0148] Observations 16,005 19,294 12,513 3,823
At age 60
College ⳮ0.018** ⳮ0.020*** ⳮ0.095*** [0.0071] [0.0055] [0.0116] Observations 15,913 16,769 7,714
Table A3
The effect of college education on smoking behavior at different ages. Panel data with fixed effects, marginal effects of conditional logit. Males
Dependent variable: smoked at age 17 and smoked at ages 25 to 60
Birth Cohort 1910–19 1920–29 1930–39 1940–49 1950–59 1960–69 1970–79
At age 25
College 0.058 0.029 0.032** 0.007 ⳮ0.009 ⳮ0.033 0.044 [0.0521] [0.0258] [0.0160] [0.0158] [0.0167] [0.0309] [0.0466]
Observations 4374 7590 7736 10744 10930 5690 1506
At age 30
College 0.059** 0.062** 0.038** ⳮ0.004 ⳮ0.034* ⳮ0.003 [0.0293] [0.0262] [0.0188] [0.0183] [0.0200] [0.0299] Observations 4,790 7,924 8,196 11,230 9,774 4,662
At age 35
College 0.029 0.051** 0.039** ⳮ0.058 ⳮ0.037* ⳮ0.064 [0.0251] [0.0228] [0.0183] [0.0138] [0.0194] [0.0418] Observations 4,838 8,076 8,386 10,078 8,260 2,186
At age 40
College 0.072** 0.061*** 0.039* ⳮ0.001 ⳮ0.072*** [0.0306] [0.0220] [0.0204] [0.0176] [0.0230] Observations 4,786 8,186 8,546 8,530 5,854
At age 45
College 0.057* 0.048** 0.025 0.014 ⳮ0.067** [0.0296] [0.0229] [0.0199] [0.0200] [0.0324] Observations 4,784 8,174 7,830 6,938 2,452
At age 50
College 0.088** 0.039** 0.001 0.012 [0.0336] [0.0188] [0.0217] [0.0241] Observations 4746 8188 6638 4942
At age 55
College 0.072** 0.033 ⳮ0.008 ⳮ0.018 [0.0305] [0.0229] [0.0243] [0.0389] Observations 4,758 7,278 5,420 2,012